. 2019 Jan 15;50(1):64-76.e4.
doi: 10.1016/j.immuni.2018.11.017. Epub 2019 Jan 8.

The Nucleotide Sensor ZBP1 and Kinase RIPK3 Induce the Enzyme IRG1 to Promote an Antiviral Metabolic State in Neurons

Affiliations

The Nucleotide Sensor ZBP1 and Kinase RIPK3 Induce the Enzyme IRG1 to Promote an Antiviral Metabolic State in Neurons

Brian P Daniels et al. Immunity. .

Abstract

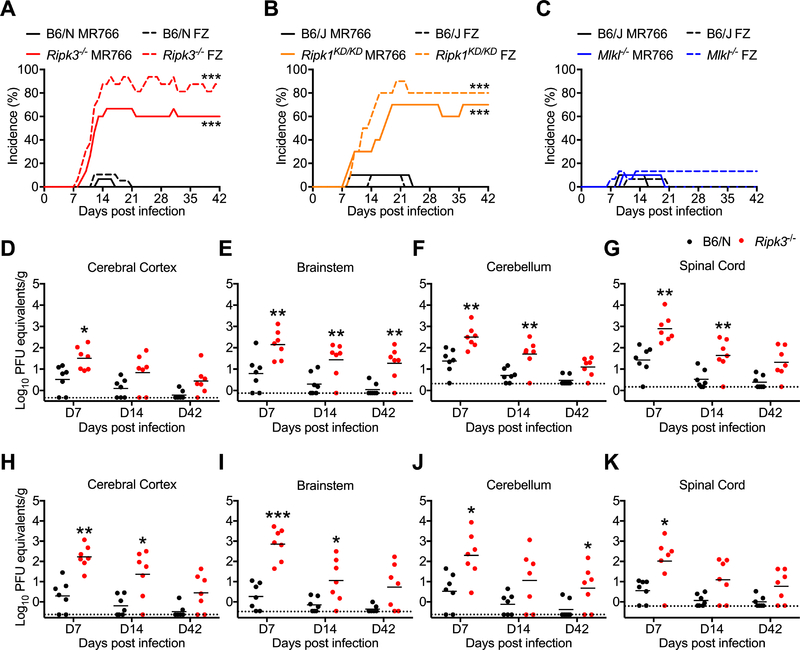
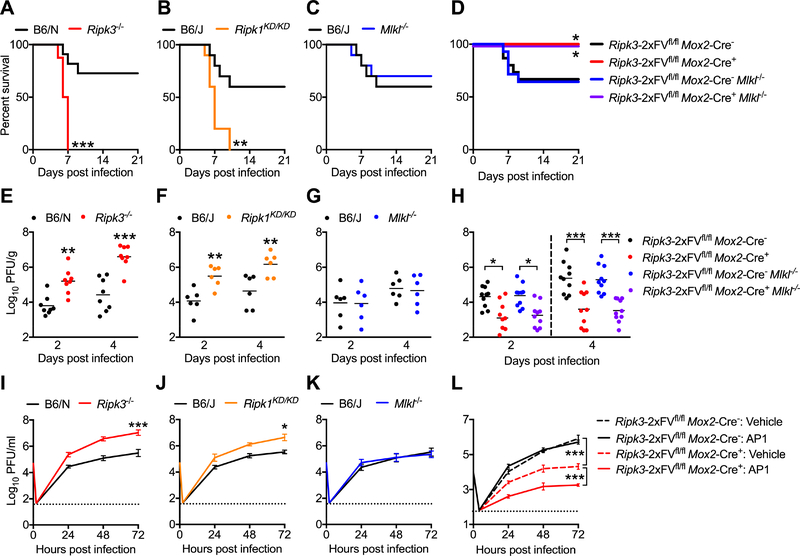
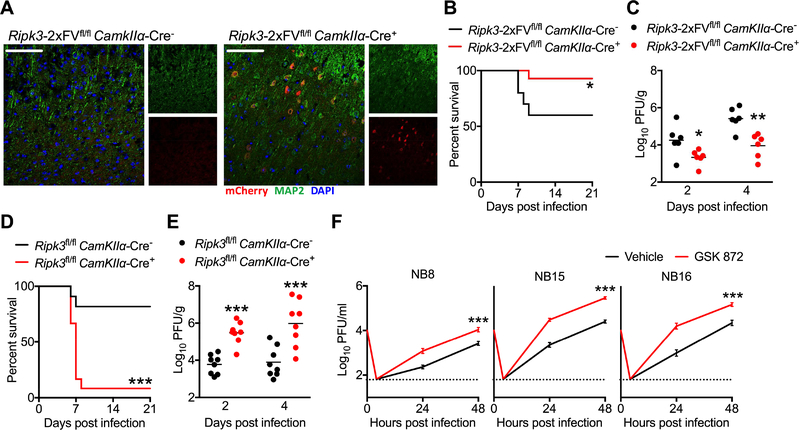
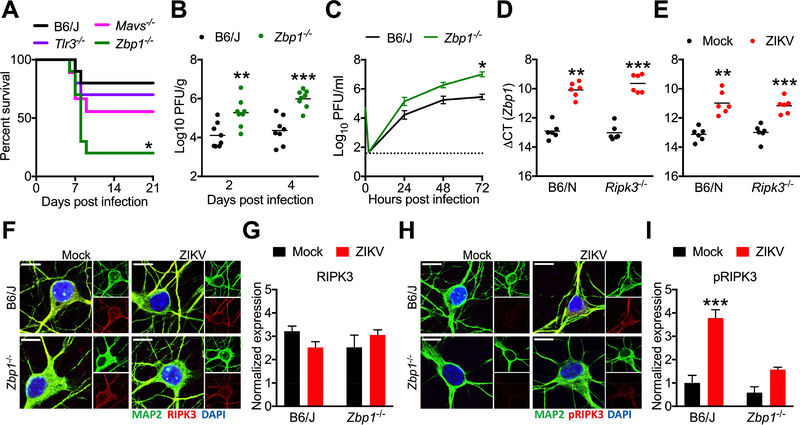
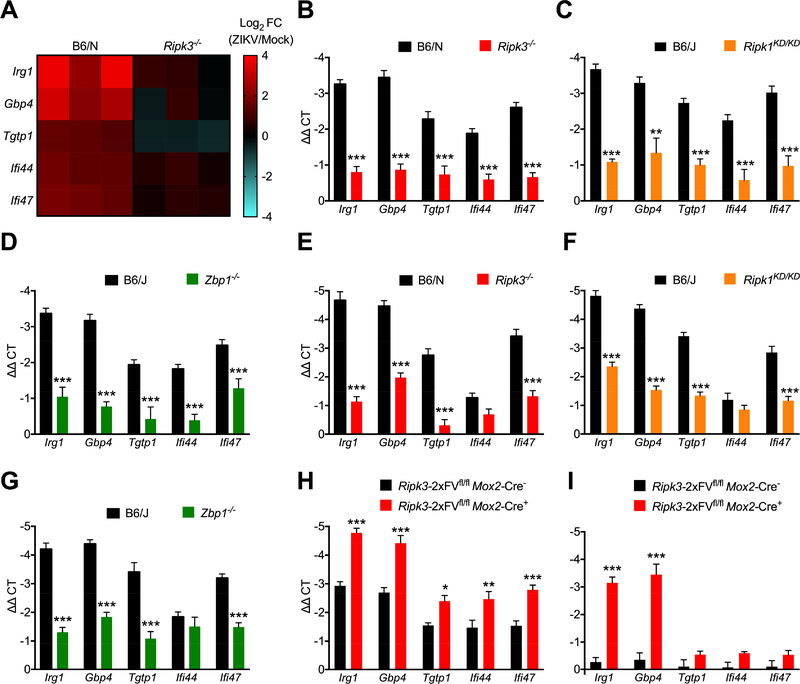
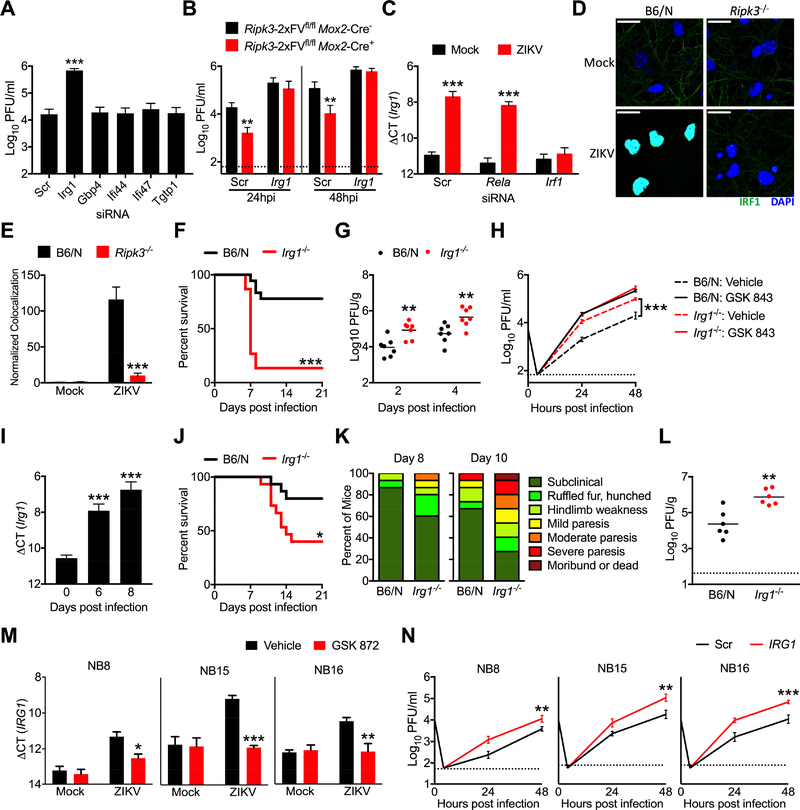
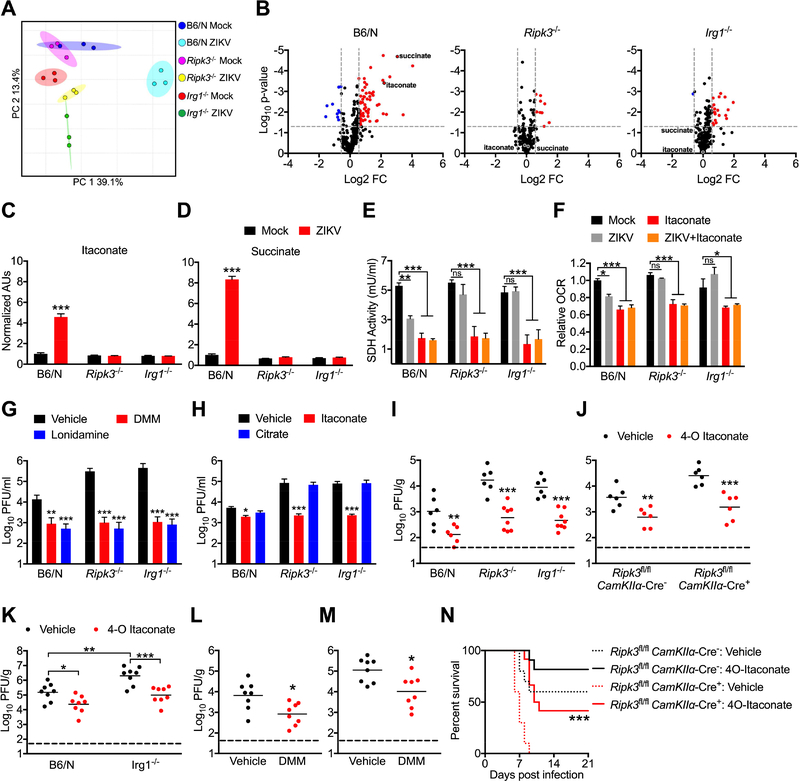
As long-lived post-mitotic cells, neurons employ unique strategies to resist pathogen infection while preserving cellular function. Here, using a murine model of Zika virus (ZIKV) infection, we identified an innate immune pathway that restricts ZIKV replication in neurons and is required for survival upon ZIKV infection of the central nervous system (CNS). We found that neuronal ZIKV infection activated the nucleotide sensor ZBP1 and the kinases RIPK1 and RIPK3, core components of virus-induced necroptotic cell death signaling. However, activation of this pathway in ZIKV-infected neurons did not induce cell death. Rather, RIPK signaling restricted viral replication by altering cellular metabolism via upregulation of the enzyme IRG1 and production of the metabolite itaconate. Itaconate inhibited the activity of succinate dehydrogenase, generating a metabolic state in neurons that suppresses replication of viral genomes. These findings demonstrate an immunometabolic mechanism of viral restriction during neuroinvasive infection.


Conflict of interest statement

Declaration of Interests

Drs. Daniels and Oberst hold a provisional patent describing the use of itaconate as an antiviral molecule in the context of neuroinvasive infection.

Figures

Figure 1:
Figure 1:. RIPK signaling controls ZIKV pathogenesis following peripheral infection.
(A-C) Percentages of Ripk3−/− (A), Ripk1KD/KD (B), or Mlkl−/− (C) mice and congenic C57BL/6NJ (B6/N) or C57BL/6J (B6/J) controls exhibiting clinical signs of paresis following subcutaneous inoculation with ZIKV-MR766 or ZIKV-Fortaleza (FZ). Signs of paresis included loss of tail tone, impaired righting reflex, irregular gait, and/or kinetic tremor. N= 10–20 mice per group. (D-K) B6/N or Ripk3−/− mice were infected subcutaneously with ZIKV-MR766 (D-G) or ZIKV-Fortaleza (H-K). On indicated days following infection, the indicated tissues were assayed for ZIKV titers via qRT-PCR. qRT-PCR data are normalized against a standard curve of known viral titers to generate PFU equivalents. *p<0.05, **p<0.01, ***p<0.001. Error bars represent SEM. Dotted lines indicate limits of detection. All data are pooled from two or three independent experiments. See also Figure S1.
Figure 2:
Figure 2:. RIPK signaling exerts CNS-intrinsic restriction of ZIKV replication.
(A-C) Survival analysis in Ripk3−/− (A), Ripk1KD/KD (B), or Mlkl−/− (C) mice and congenic controls following intracranial inoculation with ZIKV-MR766. N= 10–16 mice/genotype. (D) Survival analysis in Ripk3-2xFVfl/fl Mox2-Cre+ and Ripk3-2xFVfl/fl Mox2-Cre+ Mlkl−/− mice along with Cre littermate controls following intracranial inoculation with ZIKV-MR766. N= 9–15 mice/genotype. (E-G) Ripk3−/− (E), Ripk1KD/KD (F), or Mlkl−/− (G) mice and congenic controls were infected intracranially with ZIKV-MR766. On indicated days following infection, whole brains were assayed for ZIKV titers via plaque assay. (H) Analysis of brain viral burden in Ripk3-2xFVfl/fl Mox2-Cre+ and Ripk3-2xFVfl/fl Mox2-Cre+ Mlkl−/− mice along with Cre littermate controls following intracranial ZIKV-MR766 infection, as in (E-G). (I-K) Multistep viral growth curve analysis (MOI 0.1) in primary cortical neurons isolated from Ripk3−/− (I), Ripk1KD/KD (J), or Mlkl−/− (K) mice or congenic controls. N= 6 independent replicates. (L) Multistep viral growth curve analysis (MOI 0.1) in primary cortical neurons isolated from Ripk3-2xFVfl/fl Mox2-Cre+ mice and Cre littermate controls. Prior to infection, cultures were pretreated (2h) with AP1 or DMSO vehicle. N= 4 independent replicates. *p<0.05, **p<0.01, ***p<0.001. Error bars represent SEM. Dotted lines indicate limits of detection. All data are pooled from two or three independent experiments. See also Figure S2.
Figure 3:
Figure 3:. Neuronal RIPK3 signaling is required to control ZIKV infection in the CNS.
(A) Fluorescent immunohistochemical staining of mCherry (red), neuronal marker MAP2 (green) in cerebral cortices of a naïve Ripk3-2xFVfl/fl CamkIIα-Cre+ mouse and a Cre littermate control. Images are representative of at least 2 sections analyzed from 3 independent mice per genotype. Scale bar= 50μm. (B) Ripk3-2xFVfl/fl CamkIIα-Cre+ mice and Cre littermate controls were infected intracranially with ZIKV-MR766 and monitored for survival. N= 10 (Cre) and 14 (Cre+) mice. (C) Mice as in (B) were infected intracranially with ZIKV-MR766. On indicated days following infection, whole brains were assayed for ZIKV titers via plaque assay. (D-E) Survival (D) or tissue viral titers (E) in Ripk3fl/fl CamkIIα-Cre+ mice and Cre littermate controls following intracranial infection with ZIKV-MR766. N= 11–12 mice/genotype. (F) Primary human neuroblastoma lines (NB8, NB15, and NB16) were differentiated into neuron-like cells. Multistep growth curve analysis (MOI 0.1) was then performed following 2h pretreatment with the human RIPK3 inhibitor GSK 872 or a DMSO vehicle. N= 4 independent replicates. **p<0.01, ***p<0.001. Error bars represent SEM. Dotted lines indicate limits of detection. All data are pooled from two or three independent experiments. See also Figure S3.
Figure 4:
Figure 4:. ZBP1 signaling activates RIPK3 and restricts neuronal ZIKV infection.
(A) Survival analysis in Mavs−/−, Tlr3−/−, or Zbp1−/− mice and congenic WT controls following intracranial inoculation with ZIKV-MR766. N= 10 mice/genotype. (B) Zbp1−/− mice and congenic controls were infected intracranially with ZIKV-MR766. On indicated days following infection, whole brains were assayed for ZIKV titers via plaque assay. (C) Multistep viral growth curve analysis (MOI 0.1) in primary cortical neurons isolated from Zbp1−/− mice or congenic controls. N= 6 independent replicates. (D-E) qRT-PCR analysis of Zbp1 mRNA expression in whole brain homogenates 48h following intracranial ZIKV infection (D) or in primary cortical neurons 24h post infection (E). (F-I) Fluorescent immunocytochemical detection of neuronal marker MAP2 (green) and RIPK3 (red, F) or phosphorylated RIPK3 (red, H) in primary cortical neurons isolated from Zbp1−/− mice or congenic controls, 6h following infection with ZIKV-MR766 (MOI 10.0). Intensity quantifications in G and I represent integrated red pixel intensity values normalized to green pixel area. Nuclei are stained with DAPI (blue). Images are representative of at least 4 high power fields taken for each of 3 independent replicates. Scale bar= 10μm. *p<0.05, **p<0.01, ***p<0.001. Error bars represent SEM. Dotted lines indicate limits of detection. All data are pooled from two or three independent experiments. See also Figure S3.
Figure 5:
Figure 5:. ZBP1/RIPK1/RIPK3 induce antiviral gene transcription in ZIKV-infected neurons.
(A) Heat map depicting relative expression values of 5 candidate antiviral genes exhibiting significantly different expression in microarray analysis of Ripk3−/− primary cortical neurons compared to WT controls 24h following ZIKV-MR766 infection (MOI 0.1). (B-D) qRT-PCR analysis of mRNA expression of indicated genes in primary cortical neurons derived from Ripk3−/− (B), Ripk1KD/KD (C), or Zbp1−/− (D) mice or congenic controls at 24h following infection with ZIKV-MR766 (MOI 0.1). N= 6 independent replicates. (E-G) qRT-PCR analysis of mRNA expression of indicated genes in whole brain homogenates derived from Ripk3−/− (E), Ripk1KD/KD (F), or Zbp1−/− (G) mice or congenic controls at 48h following intracranial infection with ZIKV-MR766. N= 6 independent replicates. (H-I) qRT-PCR analysis of mRNA expression of indicated genes in primary cortical neurons derived from Ripk3-2xFVfl/fl Mox2-Cre+ mice or Cre littermate controls at 24h following infection with 0.1 MOI ZIKV-MR766 (H) or 4h following treatment with AP1(I). N= 6 independent replicates. *p<0.05, **p<0.01, ***p<0.001. Error bars represent SEM. Data in (B-G) are pooled from two or three independent experiments. See also Figure S4.
Figure 6:
Figure 6:. IRG1 restricts neurotropic flavivirus infection.
(A) WT B6/N primary cortical neurons were treated for 48h with siRNA pools (4 siRNAs per pool) targeted against indicated genes or a nontargeting control pool (Scr). Neurons were then infected with ZIKV-MR766 (MOI 0.1). Viral titers in supernatants at 24h post infection were quantified via plaque assay. N= 4 independent replicates. (B) Primary cortical neurons derived from Ripk3-2xFVfl/fl Mox2-Cre+ mice or Cre littermate controls were treated for 48h with an siRNA pool targeted against Irg1 or a nontargeting control pool (Scr). Cultures were then infected with ZIKV-MR766 (MOI 0.1) and viral titers in supernatants were measured at indicated hours post infection (hpi). N= 4 independent replicates. (C) Cortical neuron cultures as in (A) were treated with siRNA pools targeted against indicated transcription factors. Neurons were then infected with ZIKV-MR766 (MOI 0.1) and Irg1 expression was assayed via qPCR. N= 4 independent replicates. (D-E) Ripk3−/− or B6/N cortical neurons were infected at MOI 10.0 with ZIKV-MR766 for 4h. Nuclear translocation of IRF1 was assayed via immunocytochemical staining. Data are quantified as normalized arbitrary colocalized signal between IRF1 (green) and cell nuclei (blue). Images are representative of at least 3 high power fields taken from each of 4 independent replicates. Scale bar= 20μm. (F) Survival analysis in Irg1−/− mice and congenic controls following intracranial inoculation with ZIKV-MR766. N= 15–18 mice/genotype. (G) Irg1−/− mice and congenic WT controls were infected intracranially with ZIKV-MR766. On indicated days following infection, whole brains were assayed for ZIKV titers via plaque assay. (H) Multistep viral growth curve analysis (MOI 0.1, ZIKV MR-766) in primary cortical neurons isolated from Zbp1−/− mice or congenic controls. N= 4 independent replicates. (I) B6/N mice were infected subcutaneously with WNV-TX and brains harvested on indicated days following infection. Irg1 expression was assayed in whole brain homogenates via qPCR. N=6 mice/time point. (J-K) B6/N or Irg1−/− mice were infected with WNV-TX as in (I) and monitored for survival (J) or clinical signs of disease (L). N=15 mice/genotype. (L) Viral burden in brains of mice as in (J-K) were assayed via plaque assay on day 8 following infection with WNV-TX. (M) Primary human neuroblastoma lines (NB8, NB15, and NB16) were differentiated into neuron-like cells. Human IRG1 mRNA expression was measured via qRT-PCR 24h following infection with ZIKV-MR766 (MOI 0.1). Prior to infection, cultures were pretreated for 2h with the human RIPK3 inhibitor GSK 872 or DMSO vehicle. N= 4 independent replicates. (N) Neuroblastoma lines as in (M) were treated with an siRNA pool targeted against human IRG1 or a nontargeting control pool (Scr) for 48h. Multistep growth curve analysis was then performed following infection with ZIKV-MR766 (MOI 0.1). N= 4 independent replicates. *p<0.05, **p<0.01, ***p<0.001. Error bars represent SEM. Dotted lines indicate limits of detection. All data are pooled from two or three independent experiments. See also Figure S5.
Figure 7:
Figure 7:. IRG1 alters neuronal metabolism during ZIKV infection via production of itaconate.
(A) Principle component analysis following metabolomic profiling of primary cortical neurons isolated from Ripk3−/− or Irg1−/− mice or congenic controls at 24h post infection with ZIKV-MR766 (MOI 0.1). (B) Expression profiles of 294 metabolites in cultures described in (A). Significant differences (>1.5 fold change, p<0.05) are noted in red (upregulated metabolites) or blue (downregulated metabolites). (C-D) Relative ion intensities of indicated metabolites in cultures described in (A). (AUs: arbitrary units). N= 3 independent replicates. (E) SDH activity in lysates derived from B6/N, Ripk3−/−, or Irg1−/− primary cortical neurons at 24h following infection with ZIKV-MR766 (MOI 0.1). Cultures were pretreated for 2h with medium containing itaconate or saline vehicle prior to infection. N= 4 independent replicates. (F) Extracellular oxygen consumption rate (OCR) over 1h following 24h infection in neuronal cultures as described in (G). N= 4 independent replicates. (G) B6/N, Ripk3−/−, or Irg1−/− primary cortical neurons were infected with ZIKV-MR766 (MOI 0.1) following 2h pretreatment with media containing malonate, lonidamine, or DMSO vehicle. Viral titers in supernatants were measured via plaque assay. N= 4 independent replicates. (H) B6/N, Ripk3−/−, or Irg1−/− primary cortical neurons were infected with ZIKV-MR766 (MOI 10.0) following 2h pretreatment with media containing itaconate, citrate, or saline vehicle. Viral titers in supernatants at 24h post infection were measured via plaque assay. N= 4 independent replicates. (I-K) Mice of the indicated genotype were incranially infected with ZIKV-MR766 (I-J) or WNV-TX (K) and viral titers were measured via plaque assay in whole brain homogenates 2 days following infection. For all animals, infection happened concurrently with intracranial administration of 4-octyl (4-O) itaconate or DMSO vehicle. (L-M) WT B6/N mice were infected intracranially with ZIKV-MR766 (L) or WNV-TX (M) and brain viral burden was measured as in (I-K). Concurrent with infection, mice received intracranial administration of dimethylmalonate (DMM) or saline vehicle. (N) Mice of the indicated genotype were incranially infected with ZIKV-MR766 and monitored for survival. Mice received one intracranial administration of 4-O itaconate or DMSO vehicle concurrently with infection, with a second administration on day 4 following infection. N= 10–12 mice per genotype and treatment group. *p<0.05, **p<0.01, ***p<0.001. Error bars represent SEM. Data in (E-N) are pooled from two or three independent experiments. See also Figure S6 and Figure S7.

Comment in

References

    1. Bambouskova M, Gorvel L, Lampropoulou V, Sergushichev A, Loginicheva E, Johnson K, Korenfeld D, Mathyer ME, Kim H, Huang LH, et al. (2018). Electrophilic properties of itaconate and derivatives regulate the IkappaBzeta-ATF3 inflammatory axis. Nature 556, 501–504. - PMC - PubMed
    1. Brien JD, Lazear HM, and Diamond MS (2013). Propagation, quantification, detection, and storage of West Nile virus. Current protocols in microbiology 31, 15D 13 11–15D 13 18. - PubMed
    1. Cho H, Proll SC, Szretter KJ, Katze MG, Gale M Jr., and Diamond MS (2013). Differential innate immune response programs in neuronal subtypes determine susceptibility to infection in the brain by positive-stranded RNA viruses. Nat Med 19, 458–464. - PMC - PubMed
    1. Cho YS, Challa S, Moquin D, Genga R, Ray TD, Guildford M, and Chan FK (2009). Phosphorylation-driven assembly of the RIP1-RIP3 complex regulates programmed necrosis and virus-induced inflammation. Cell 137, 1112–1123. - PMC - PubMed
    1. Cordes T, Wallace M, Michelucci A, Divakaruni AS, Sapcariu SC, Sousa C, Koseki H, Cabrales P, Murphy AN, Hiller K, et al. (2016). Immunoresponsive Gene 1 and Itaconate Inhibit Succinate Dehydrogenase to Modulate Intracellular Succinate Levels. J Biol Chem 291, 14274–14284. - PMC - PubMed

Publication types

MeSH terms