. 2019 Mar 28;53(3):1800786.
doi: 10.1183/13993003.00786-2018. Print 2019 Mar.

Neutrophils disturb pulmonary microcirculation in sepsis-induced acute lung injury

Affiliations

Neutrophils disturb pulmonary microcirculation in sepsis-induced acute lung injury

Inwon Park et al. Eur Respir J. .

Abstract

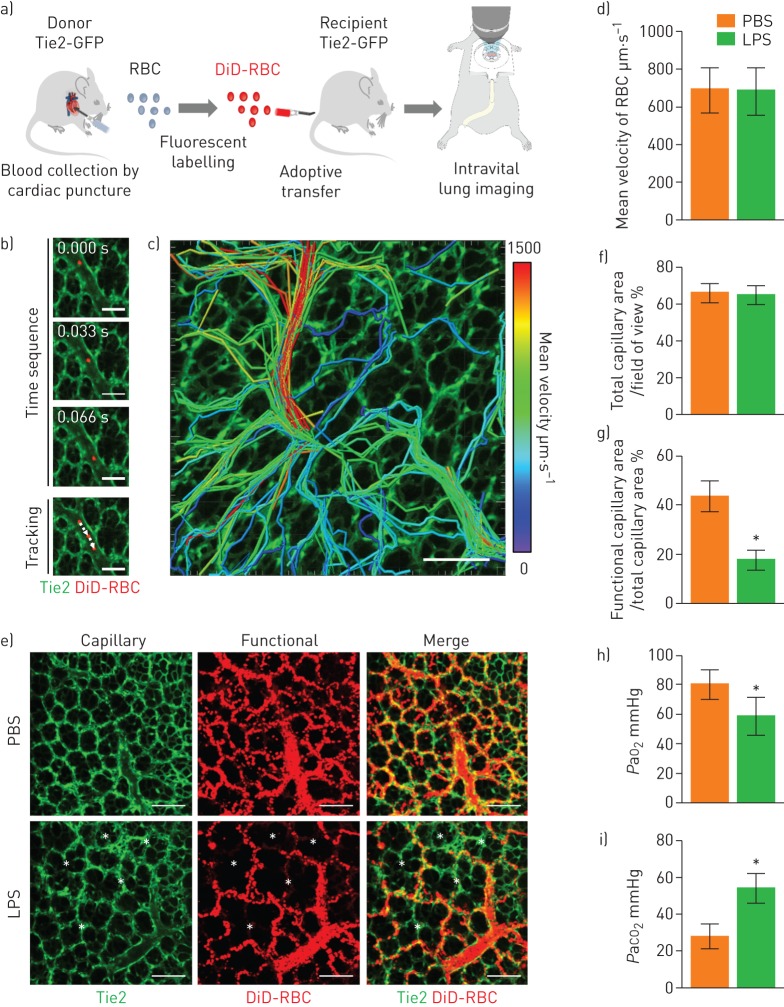
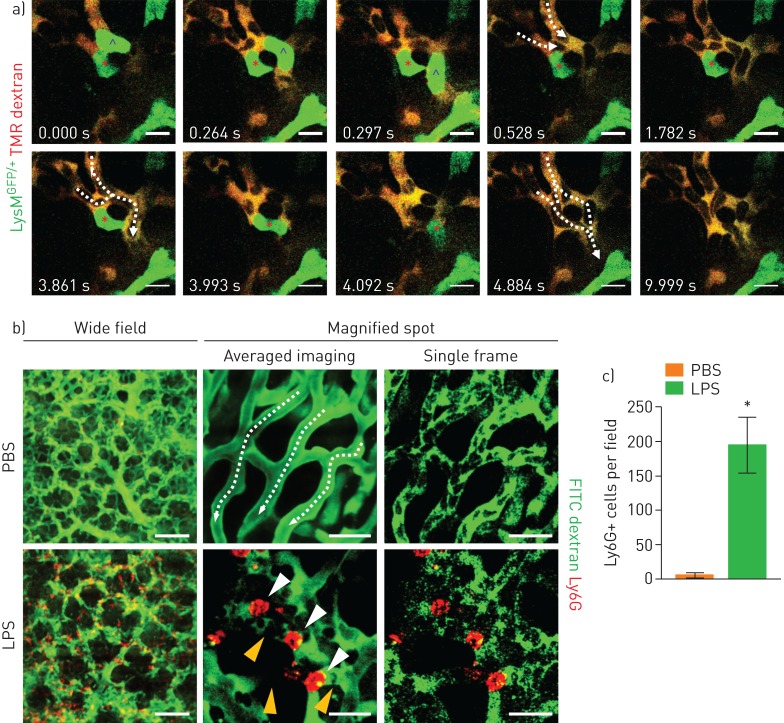
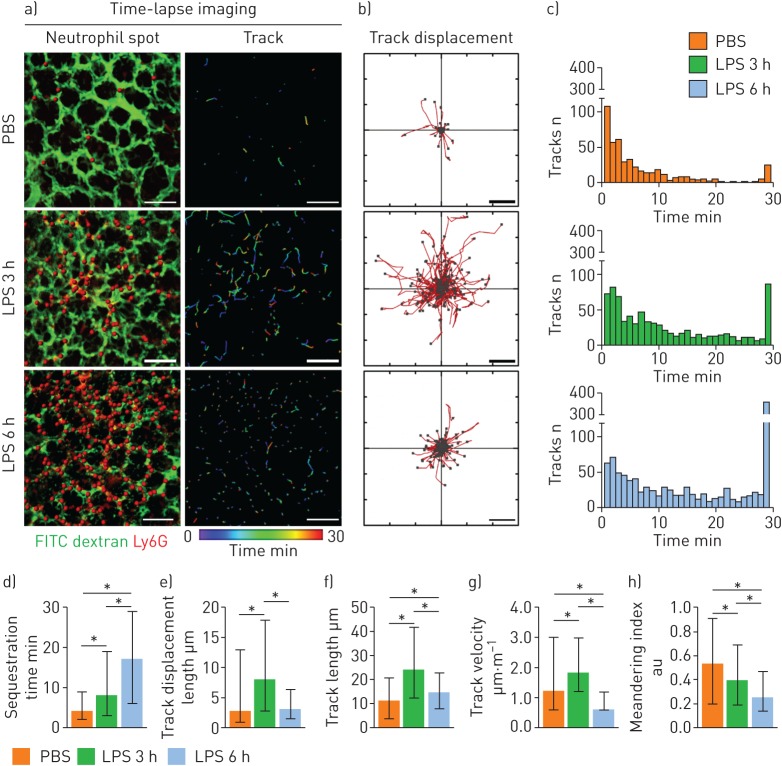
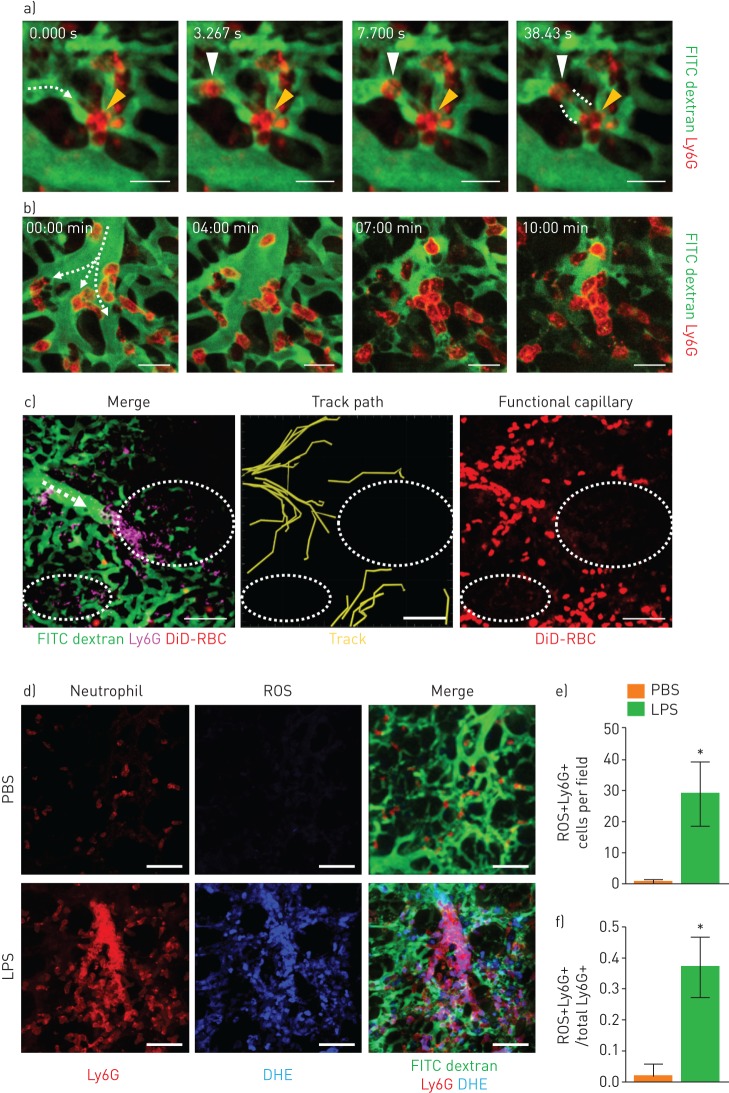
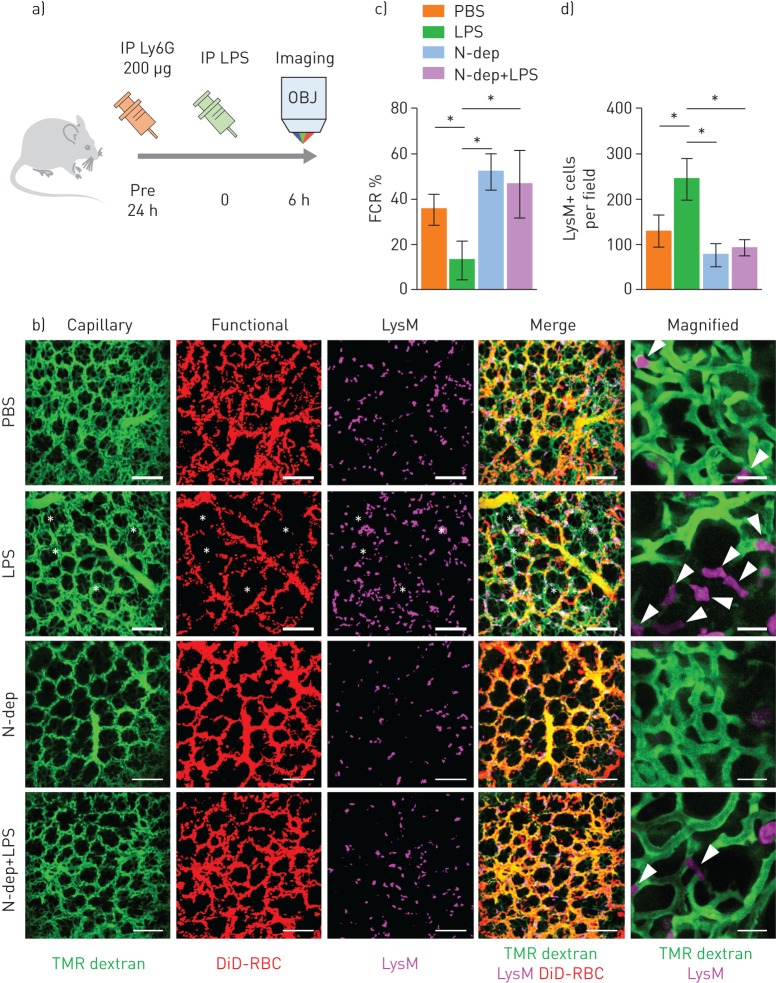
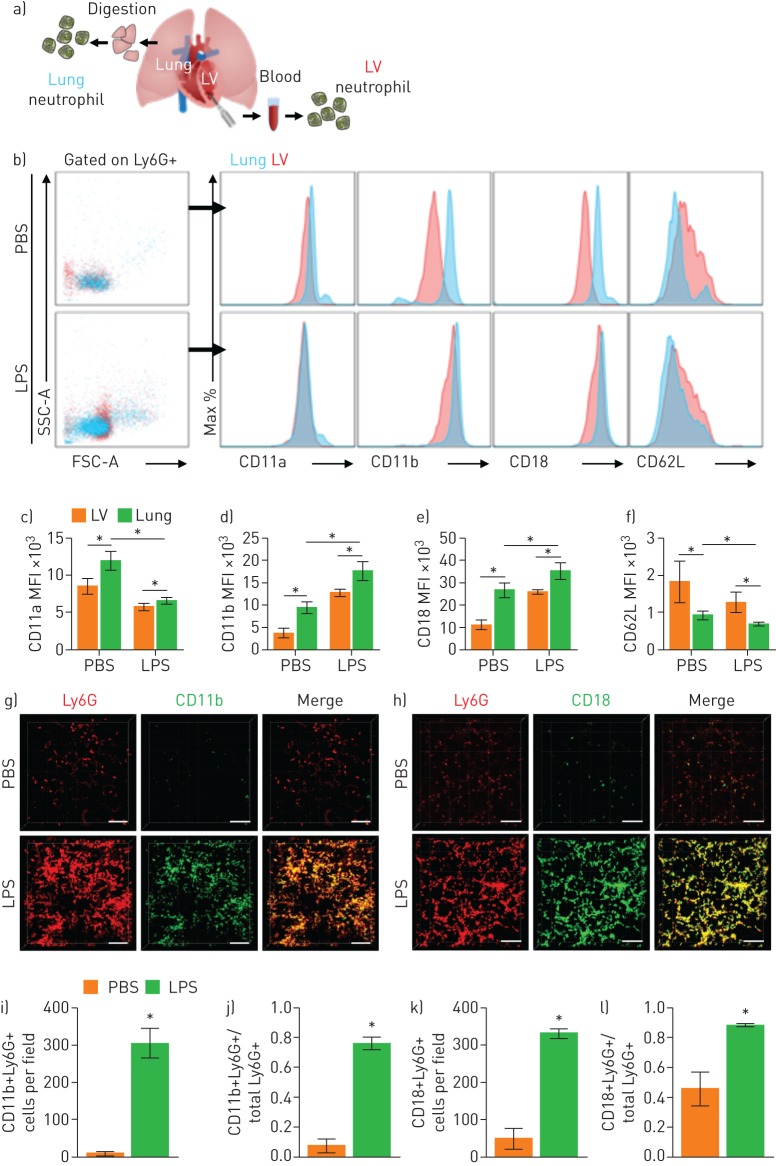
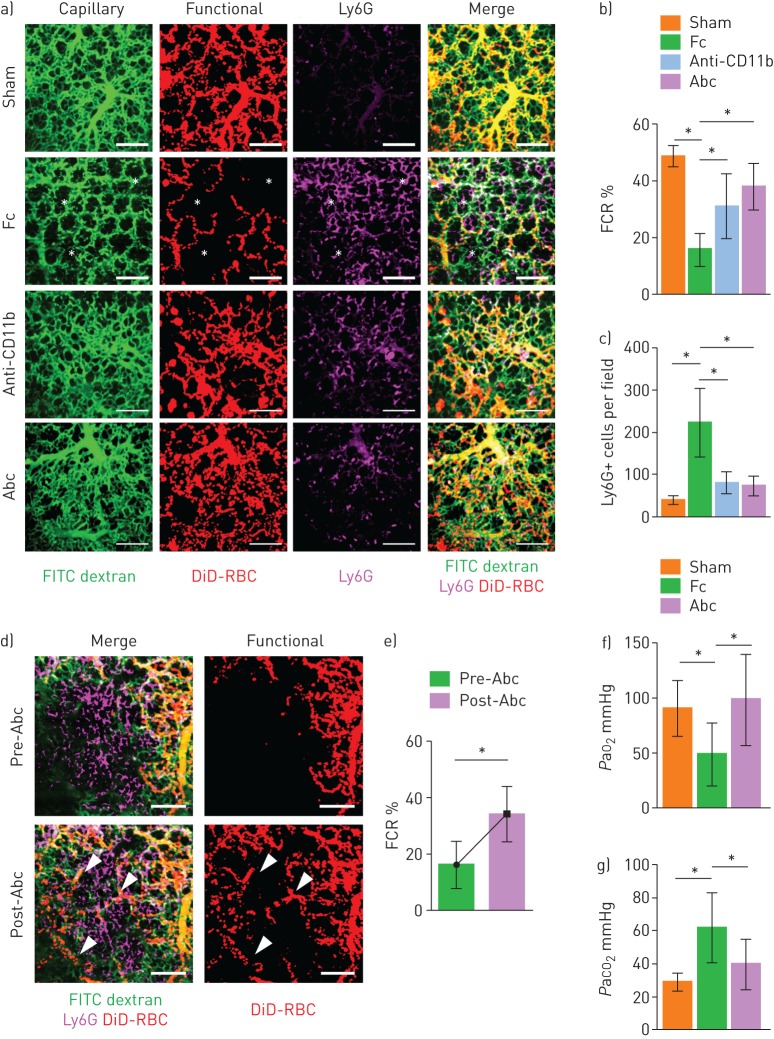
The lung is highly vulnerable during sepsis, yet its functional deterioration accompanied by disturbances in the pulmonary microcirculation is poorly understood. This study aimed to investigate how the pulmonary microcirculation is distorted in sepsis-induced acute lung injury (ALI) and reveal the underlying cellular pathophysiologic mechanism.Using a custom-made intravital lung microscopic imaging system in a murine model of sepsis-induced ALI, we achieved direct real-time visualisation of the pulmonary microcirculation and circulating cells in vivo We derived the functional capillary ratio (FCR) as a quantitative parameter for assessing the fraction of functional microvasculature in the pulmonary microcirculation and dead space.We identified that the FCR rapidly decreases in the early stage of sepsis-induced ALI. The intravital imaging revealed that this decrease resulted from the generation of dead space, which was induced by prolonged neutrophil entrapment within the capillaries. We further showed that the neutrophils had an extended sequestration time and an arrest-like dynamic behaviour, both of which triggered neutrophil aggregates inside the capillaries and arterioles. Finally, we found that Mac-1 (CD11b/CD18) was upregulated in the sequestered neutrophils and that a Mac-1 inhibitor restored the FCR and improved hypoxaemia.Using the intravital lung imaging system, we observed that Mac-1-upregulated neutrophil aggregates led to the generation of dead space in the pulmonary microcirculation that was recovered by a Mac-1 inhibitor in sepsis-induced ALI.


Conflict of interest statement

Conflict of interest: I. Park has nothing to disclose. Conflict of interest: M. Kim has nothing to disclose. Conflict of interest: K. Choe has nothing to disclose. Conflict of interest: E. Song has nothing to disclose. Conflict of interest: H. Seo has nothing to disclose. Conflict of interest: Y. Hwang has nothing to disclose. Conflict of interest: J. Ahn has nothing to disclose. Conflict of interest: S-H. Lee has nothing to disclose. Conflict of interest: J.H. Lee has nothing to disclose. Conflict of interest: Y.H. Jo has nothing to disclose. Conflict of interest: K. Kim has nothing to disclose. Conflict of interest: G.Y. Koh has nothing to disclose. Conflict of interest: P. Kim has nothing to disclose.

Figures

FIGURE 1
FIGURE 1
Impaired pulmonary microcirculation in sepsis-induced acute lung injury revealed by the functional capillary ratio. a) Schematics of intravital lung imaging experiment for pulmonary microcirculation visualisation with adoptive transfer of DiD-labelled erythrocytes. b) Sequential images of rapidly flowing DiD-labelled erythrocyte (red) inside the pulmonary vessel (green) in Tie2-GFP mouse obtained in video rate (30 frames·s−1). Scale bars, 100 µm. Time elapsed is indicated. c) Velocity colour-coded track analysis of DiD-labelled erythrocyte in pulmonary microcirculation. Colour represents the mean velocity of each segment of erythrocyte track (supplementary video S1). Scale bar, 100 µm. d) Comparison of mean velocity of red blood cells (RBC) between the PBS and lipopolysaccharide (LPS) (10 mg·kg−1) groups in the pulmonary microcirculation (n=30, 10 fields of view (FOV) per mouse, three mice per group, two-tailed t-test, p=0.8157). e) Representative functional capillary imaging in the PBS and LPS groups (supplementary video S2). The functional capillary was revealed by maximal intensity projection of real-time DiD-labelled erythrocyte imaging (supplementary figure S1a, b). White asterisks indicate dead spaces where the trajectory of the erythrocyte was not observed. Scale bars, 100 µm. f, g) Comparisons of the ratio of the total capillary area (f) and the functional capillary area (g) between the PBS and LPS groups (n=30, 10 FOV per mouse, three mice per group, two-tailed t-test, *p<0.05). h, i) Comparisons of the arterial oxygen (PaO2) and carbon dioxide (PaCO2) tension at 6 h after LPS between the PBS (n=6) and LPS (n=16) groups (Mann–Whitney test, *p<0.05). Data are presented as mean±sd. GFP: green fluorescent protein.
FIGURE 2
FIGURE 2
Entrapment of neutrophil inside the pulmonary capillary. a) Real-time imaging of LysMGFP/+ (green) neutrophil entrapment in the pulmonary capillary (tetramethylrhodamine (TMR) dextran, red) (supplementary video S3). Each circulation inside the capillary resumes after the neutrophil in the upper region (blue caret) and the lower region (red asterisk) has squeezed through the pulmonary capillary. Scale bars, 10 µm. Dashed arrows indicate the direction of flow. Time elapsed is indicated. b) Representative intravital imaging of Ly6G+ cells (red) and consequent flow in pulmonary microcirculation (fluorescein isothiocyanate (FITC) dextran, green) in the PBS and lipopolysaccharide (LPS) (10 mg·kg−1) groups (supplementary video S4). Magnified spots consist of averaged imaging up to 30 frames and single frame imaging. Dashed arrows indicate the direction of flow. White arrowheads indicate entrapped neutrophils, and yellow arrowheads indicate obstructed capillary with no flow. Scale bars, 100 µm (wide field) and 20 µm (magnified spot). c) Comparison of number of Ly6G+ cells in pulmonary microcirculation between the PBS and LPS groups (n=30, 10 fields of view per mouse, three mice per group, two-tailed t-test, *p<0.05). Data are presented as mean±sd.
FIGURE 3
FIGURE 3
Increased entrapment time and dynamically altered motility of neutrophils during the development of sepsis-induced acute lung injury. a) Representative time-lapse imaging of Ly6G+ cells (red spots) in the pulmonary microcirculation (fluorescein isothiocyanate (FITC) dextran, green) in the PBS and lipopolysaccharide (LPS) 3 h and 6 h groups (supplementary video S5). The colour-coded track describes the motion of tracked Ly6G+ cells over a period of 30 min. Scale bars, 100 µm. b) Overlay of the track of Ly6G+ cells from (a). Each Ly6G+ cell track in (a) is plotted from the central point and shows XY displacement. Scale bars, 10 µm. c) Histogram of track duration of Ly6G+ cells shown in (a). d–h) Comparisons of sequestration time, track displacement length, track length, track velocity and meandering index of Ly6G+ cells in the pulmonary microcirculation in the PBS (n=466) and LPS 3 h (n=794) and 6 h (n=1076) groups (three mice per group, Kruskal–Wallis test with post hoc Dunn's multiple comparison test, *p<0.05). Data are presented as median (interquartile range).
FIGURE 4
FIGURE 4
Neutrophil aggregates in the capillaries and arterioles generate dead space and release reactive oxygen species (ROS) in situ. a) Representative real-time imaging of capillary obstruction with Ly6G+ cells in sepsis-induced acute lung injury model (supplementary video S6). Dashed arrow indicates the direction of flow. Yellow arrowheads indicate previously entrapped neutrophils and white arrowheads indicate newly appeared neutrophils obstructing the capillary followed by dead space formation inside the capillary. Dashed line indicates a capillary dead space. Scale bars, 20 µm. b) Representative time-lapse imaging of cluster formation by Ly6G+ cells in the branching region of an arteriole connected to a capillary (supplementary video S7). Dashed arrows indicate the direction of flow. Scale bars, 20 µm. c) Representative imaging of dead space generation triggered by cluster formation (supplementary video S8). Dashed arrow indicates the direction of flow. White dashed circles indicate circulatory dead spaces. Scale bars, 100 µm. d) Representative intravital imaging of ROS (dihydroethidium (DHE), blue) co-localised with neutrophils (Ly6G, red) in the pulmonary microcirculation (fluorescein isothiocyanate (FITC) dextran, green) in the PBS and lipopolysaccharide (LPS) groups. Scale bars, 50 µm. e, f) Comparisons of the number of ROS+Ly6G+ cells and the ratio of ROS+Ly6G+ cells to total Ly6G+ cells in the PBS and LPS groups (n=30, 10 fields of view per mouse, three mice per group, two-tailed t-test, *p<0.05). Data are presented as mean±sd.
FIGURE 5
FIGURE 5
Neutrophil depletion (N-dep) improves the functional capillary ratio (FCR) of the pulmonary microcirculation in a sepsis-induced acute lung injury (ALI) model. a) Schematics of intravital lung imaging of N-dep in a sepsis-induced ALI model. b) Representative intravital imaging of FCR in the pulmonary microcirculation in the PBS, lipopolysaccharide (LPS), N-dep and N-dep+LPS group. Anatomical capillary (tetramethylrhodamine (TMR) dextran, green), functional capillary (DiD-labelled erythrocyte, red) and LysM+ (LysMGFP/+, magenta) cell imaging was acquired. White asterisks indicate dead spaces. Magnified images show entrapped LysM+ cells (arrowheads) and consequent flow disturbance (supplementary video S9). Scale bars, 20 µm in magnified, otherwise, 100 µm. c, d) Comparisons of FCR (%) and LysM+ cell count among PBS, LPS, N-dep and N-dep+LPS groups (n=30, 10 fields of view per mouse, three mice per group, one-way ANOVA with post hoc Holm–Sidak's multiple comparisons test, *p<0.05). Data are presented as mean±sd. IP: intraperitoneal; OBJ: objective lens; RBC: red blood cells.
FIGURE 6
FIGURE 6
Mac-1 integrin is upregulated in entrapped neutrophils in the pulmonary microcirculation. a) Schematic diagram showing isolation sampling of two groups of neutrophils (lung, blue; left ventricle (LV), red). b) Surface expression of integrin of Ly6G+ cells from the lung and LV. c–f) Comparisons of expression of integrin from flow cytometry in the PBS and lipopolysaccharide (LPS) groups (n=5 per each group, Mann–Whitney test, *p<0.05). Data are presented as mean±sd. g, h) Representative three-dimensional intravital imaging of integrin in sequestered neutrophils. Cellular surface expression of CD11b (green) and CD18 (green) in Ly6G+ cells (red) is visualised in vivo. Scale bars, 100 µm. i–l) Comparisons of number of CD11b+Ly6G+ cells and CD18+Ly6G+ cells and ratios of CD11b+Ly6G+ cells and CD18+Ly6G+ cells over total Ly6G+ cells in the PBS and LPS groups (n=9, three fields of view per mouse, three mice per group, Mann–Whitney test, *p<0.05). Data are presented as mean±sd. SSC-A: side scatter-area; MFI: mean fluorescence intensity.
FIGURE 7
FIGURE 7
Mac-1 inhibitor ameliorates the functional capillary ratio (FCR) of the pulmonary microcirculation in sepsis-induced acute lung injury. a) Representative intravital imaging of FCR in the pulmonary microcirculation in the sham, fragment crystallisable (Fc), Anti-CD11b and abciximab (Abc) groups. Anatomical capillary (tetramethylrhodamine (TMR) dextran, green), functional capillary (DiD-labelled erythrocytes, red) and neutrophil (Ly6G, magenta) imaging was acquired. White asterisks indicate dead spaces. Scale bars, 100 µm. b, c) Comparisons of FCR and number of Ly6G+ cells in the pulmonary microcirculation (n=14–25, three mice per group, two-tailed t-test, *p<0.05). Data are presented as mean±sd. d) Representative intravital lung imaging of the pre- and post-Abc groups (supplementary video S10). White arrowheads indicate restoration of erythrocyte perfusion. Scale bars, 100 µm. e) Comparison of FCR in the pre- and post-Abc groups (n=20 and 24, 6–8 fields of view per mouse, three mice per group, two-tailed t-test, *p<0.05). Data are presented as mean±sd. f, g) Comparisons of the arterial oxygen (PaO2) and carbon dioxide (PaCO2) tension in the sham (n=8), Fc (n=10) and Abc (n=6) groups (Kruskal–Wallis test with post hoc Dunn's multiple comparison tests, *p<0.05). Data are presented as mean±sd. RBC: red blood cells.

Similar articles

Cited by

References

    1. Torio CM, Moore BJ. National inpatient hospital costs: the most expensive conditions by payer, 2013: statistical brief #204. In:Healthcare Cost and Utilization Project (HCUP) Statistical Briefs. Rockville, MD, Agency for Healthcare Research and Quality (US), 2016. - PubMed
    1. Hall MJ, Levant S, DeFrances CJ. Trends in inpatient hospital deaths: National Hospital Discharge Survey, 2000–2010. NCHS Data Brief 2013; 118:1–8. - PubMed
    1. Singer M, Deutschman CS, Seymour CW, et al. . The third international consensus definitions for sepsis and septic shock (Sepsis-3). JAMA 2016; 315: 801–810. - PMC - PubMed
    1. Angus DC, van der Poll T. Severe sepsis and septic shock. N Engl J Med 2013; 369: 840–851. - PubMed
    1. Lagu T, Rothberg MB, Shieh MS, et al. . Hospitalizations, costs, and outcomes of severe sepsis in the United States 2003 to 2007. Crit Care Med 2012; 40: 754–761. - PubMed

Publication types

Substances