. 2019 May 15;25(10):3074-3083.
doi: 10.1158/1078-0432.CCR-18-1942. Epub 2019 Jan 11.

WNT/β-catenin Pathway Activation Correlates with Immune Exclusion across Human Cancers

Affiliations

WNT/β-catenin Pathway Activation Correlates with Immune Exclusion across Human Cancers

Jason J Luke et al. Clin Cancer Res. .

Abstract

Purpose: The T-cell-inflamed phenotype correlates with efficacy of immune-checkpoint blockade, whereas non-T-cell-inflamed tumors infrequently benefit. Tumor-intrinsic WNT/β-catenin signaling mediates immune exclusion in melanoma, but association with the non-T-cell-inflamed tumor microenvironment in other tumor types is not well understood.

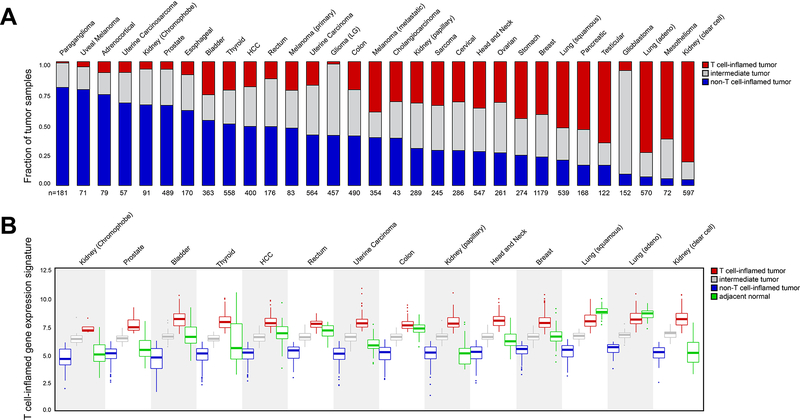
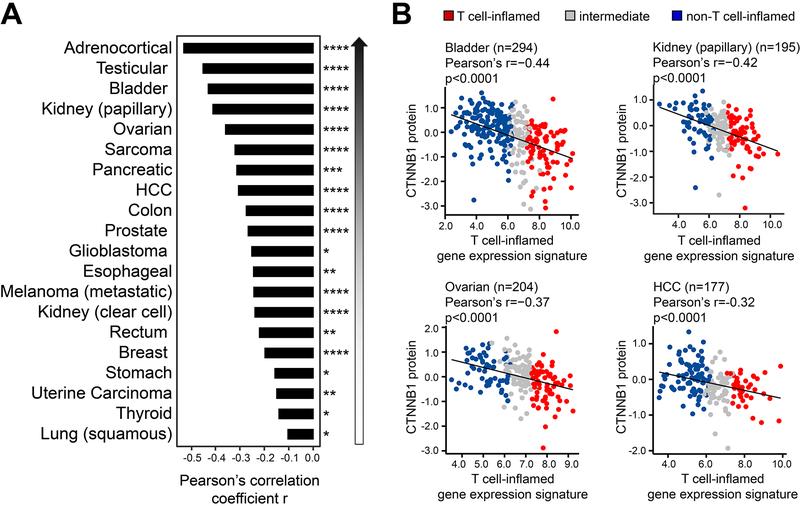
Experimental design: Using The Cancer Genome Atlas (TCGA), a T-cell-inflamed gene expression signature segregated samples within tumor types. Activation of WNT/β-catenin signaling was inferred using three approaches: somatic mutations or somatic copy number alterations (SCNA) in β-catenin signaling elements including CTNNB1, APC, APC2, AXIN1, and AXIN2; pathway prediction from RNA-sequencing gene expression; and inverse correlation of β-catenin protein levels with the T-cell-inflamed gene expression signature.

Results: Across TCGA, 3,137/9,244 (33.9%) tumors were non-T-cell-inflamed, whereas 3,161/9,244 (34.2%) were T-cell-inflamed. Non-T-cell-inflamed tumors demonstrated significantly lower expression of T-cell inflammation genes relative to matched normal tissue, arguing for loss of a natural immune phenotype. Mutations of β-catenin signaling molecules in non-T-cell-inflamed tumors were enriched three-fold relative to T-cell-inflamed tumors. Across 31 tumors, 28 (90%) demonstrated activated β-catenin signaling in the non-T-cell-inflamed subset by at least one method. This included target molecule expression from somatic mutations and/or SCNAs of β-catenin signaling elements (19 tumors, 61%), pathway analysis (14 tumors, 45%), and increased β-catenin protein levels (20 tumors, 65%).

Conclusions: Activation of tumor-intrinsic WNT/β-catenin signaling is enriched in non-T-cell-inflamed tumors. These data provide a strong rationale for development of pharmacologic inhibitors of this pathway with the aim of restoring immune cell infiltration and augmenting immunotherapy.See related commentary by Dangaj et al., p. 2943.


Conflict of interest statement

Disclosures: JL: DSMB: TTC Oncology; SAB: 7 Hills, Actym, Alphamab Oncology, Array, BeneVir, Mavu, Tempest; Consultancy: Aduro, Astellas, AstraZeneca, Bayer, Bristol-Myers Squibb, Castle, CheckMate, Compugen, EMD Serono, IDEAYA, Immunocore, Janssen, Jounce, Merck, NewLink, Novartis, RefleXion, Spring Bank, Syndax, Tempest, Vividion, WntRx; Research Support: (clinical trials unless noted) AbbVie, Array (Scientific Research Agreement; SRA), Boston Biomedical, Bristol-Myers Squibb, Celldex, CheckMate (SRA), Compugen, Corvus, EMD Serono, Evelo (SRA), Delcath, Five Prime, FLX Bio, Genentech, Immunocore, Incyte, Leap, MedImmune, Macrogenics, Novartis, Pharmacyclics, Palleon (SRA), Merck, Tesaro, Xencor

Travel: Array, AstraZeneca, Bayer, BeneVir, Bristol-Myers Squibb, Castle, CheckMate, EMD Serono, IDEAYA, Immunocore, Janssen, Jounce, Merck, NewLink, Novartis, RefleXion

Patents: (both provisional) Serial #15/612,657 (Cancer Immunotherapy), PCT/US18/36052 (Microbiome Biomarkers for Anti-PD-1/PD-L1 Responsiveness: Diagnostic, Prognostic and Therapeutic Uses Thereof)

RB declares no disclosures or conflicts of interest

RS has received consulting fees or honoraria from Bristol-Myers Squibb, Eisai, Exelixis, AstraZeneca, Puma and has research support from Bayer, Bristol-Myers Squibb, Eisai, MIrati, CytomX.

SS is holding a patent on WNT/b-catenin targeting to enhance anti-tumor immune responses (PCT15/155,099), serves on the SAB on Venn Therapeutics, Tango Therapeutics and consults for TAKEDA, Replimune, Ribon, Torque and Arcus.

T.F.G. has received consultancy fees from Merck, Roche-Genentech, Abbvie, Bayer, Jounce, Aduro, Fog Pharma, Adaptimmune, FivePrime, and Sanofi. T.F.G. has received research support from Roche-Genentech, BMS, Merck, Incyte, Seattle Genetics, Celldex, Ono, Evelo, Bayer, Aduro. T.F.G. has intellectual property/licensing agreements with Aduro, Evelo, and BMS. T.F.G is a co-founder/shareholder with Jounce.

Figures

Figure 1.
Figure 1.. Landscape of T cell inflammation across 31 human solid tumors.
(A) The fraction of non-T cell-inflamed (blue), intermediate (grey) and T cell-inflamed (red) tumors in each cancer, sorted by the fraction of non-T cell-inflamed tumor high to low, with the most non-inflamed cancer on the left (Paraganglioma) and the most inflamed cancer on the right (Kidney, clear cell). The number of samples in each cancer is shown on the x-axis. (B) Distribution of T cell-inflamed gene expression in non-T cell-inflamed (blue), intermediate (grey) and T cell-inflamed (red) tumors, as well as in normal samples (green). Cancers are shown on the x-axis in the same order as in (A), and only 14 cancers with ≥ 10 normal samples are shown. The expression level of the T cell-inflamed gene expression signature (defined as, the average expression of genes from the signature in a sample) is shown on the y-axis. Each data point represents one tumor or normal sample.
Figure 2.
Figure 2.. Somatic mutation and high-level SCNA profile in β-catenin signaling in non-T cell-inflamed and T cell-inflamed tumor groups.
(A) Overview of potential coding somatic mutations in CTNNB1 predicted to cause protein sequence changes. Each circle represents each amino acid change, with the height of the connection line represents the total number of samples carrying this mutation. Color of the circle represents mutation type, with missense mutations in green (nonsynonymous SNVs), truncating mutations in red (nonsense SNVs, frameshift deletions/insertions, splicing site variants), and in-frame mutations in blue (in-frame insertions/deletions/substitutions). Sites affected by multiple mutation types are colored in purple. Silent mutations (synonymous SNVs) are not shown. Protein domains are shown as dark grey boxes on the protein schema, HEAT_2 = HEAT repeats, Arm = Armadillo/beta-catenin-like repeat as defined in Pfam database. (B) Fraction of non-T cell-inflamed and T cell-inflamed tumors carrying β-catenin pathway activation mutations in exon 3 or high-level copy number gain. The number above each bar represents the number of altered samples in each group. (C) Landscape of activation mutations (exon 3) or high-level copy number gain in CTNNB1, and damaging mutations or high-level copy number loss in APC, APC2, AXIN1 and AXIN2 across non-T cell-inflamed tumors. The percentage of samples carrying mutations or SCNAs in each gene is presented to the left side, and the sample number is shown to the right side. Color represents predicted functional consequence of somatic mutations (red: activation, green: damaging) or SCNAs (gold: high-level CN gain, blue: high-level CN loss). CN = copy number. (D) Difference in the percentage of β-catenin mutated or copy number altered patients between non-T cell-inflamed and T cell-inflamed tumor groups per cancer. Cancers are shown to the left side and sorted by percentage difference in patients carrying mutations between tumor groups (top to bottom: larger to smaller percentage differences). 19 cancers with higher percentage of β-catenin mutated patients in non-T cell-inflamed tumor group relative to T cell-inflamed group are shown.
Figure 3.
Figure 3.. β-catenin activation in non-T cell-inflamed and T cell-inflamed tumor groups.
14 cancers with significantly higher percentage of β-catenin activated patients in non-T cell-inflamed tumor group relative to T cell-inflamed group and at least 5 target molecules are shown (also listed in Supplementary Table 2). (A) The percentage of β-catenin activated patients in each tumor group per cancer (β-catenin activation score > 0.5), with the subset of tumors with β-catenin signaling activated and total number of tumor samples shown to the right side of each bar inside parentheses. (B) Difference in the percentage of β-catenin activated patients between non-T cell-inflamed and T cell-inflamed tumor groups per cancer. In both panels, cancers are shown to the left side and sorted by percentage difference in the activated patients between tumor groups (top to bottom: larger to smaller percentage differences). The significance of such difference was computed using Fisher’s exact test, two-sided. p < 0.05 was considered statistically significant, and significance is indicated by: * p < 0.05, ** p < 0.01, *** p < 0.001, **** p < 0.0001, after FDR-correction for multiple comparisons.
Figure 4.
Figure 4.. Inverse correlation between β-catenin protein level and T cell-inflamed gene expression.
(A) Pearson’s correlation per tumor type. 20 cancers with significant inverse correlation are shown. (B) Dot plots of β-catenin protein on Y axis and T cell-inflamed gene expression on X axis in bladder urothelial carcinoma, kidney papillary, ovarian serous cystadenocarcinoma, liver hepatocellular carcinoma (HCC) shown with linear regression correlations using Pearson’s test. The significance of such difference was computed using Pearson’s correlation, one-sided test. p < 0.05 was considered statistically significant, and significance is indicated by: * p < 0.05, ** p < 0.01, *** p < 0.001, **** p < 0.0001, after FDR-correction for multiple comparisons.

Comment in

References

    1. Topalian SL, Hodi FS, Brahmer JR, Gettinger SN, Smith DC, McDermott DF, et al. Safety, activity, and immune correlates of anti-PD-1 antibody in cancer. The New England journal of medicine 2012;366(26):2443–54 doi 10.1056/NEJMoa1200690. - DOI - PMC - PubMed
    1. Hodi FS, O’Day SJ, McDermott DF, Weber RW, Sosman JA, Haanen JB, et al. Improved Survival with Ipilimumab in Patients with Metastatic Melanoma. The New England journal of medicine 2010:10.1056/NEJMoa1003466. - DOI - PMC - PubMed
    1. Robert C, Schachter J, Long GV, Arance A, Grob JJ, Mortier L, et al. Pembrolizumab versus Ipilimumab in Advanced Melanoma. The New England journal of medicine 2015. doi 10.1056/NEJMoa1503093. - DOI - PubMed
    1. Larkin J, Chiarion-Sileni V, Gonzalez R, Grob JJ, Cowey CL, Lao CD, et al. Combined Nivolumab and Ipilimumab or Monotherapy in Untreated Melanoma. The New England journal of medicine 2015;373(1):23–34 doi 10.1056/NEJMoa1504030. - DOI - PMC - PubMed
    1. Harlin H, Meng Y, Peterson AC, Zha Y, Tretiakova M, Slingluff C, et al. Chemokine expression in melanoma metastases associated with CD8+ T-cell recruitment. Cancer research 2009;69(7):3077–85 doi 10.1158/0008-5472.CAN-08-2281. - DOI - PMC - PubMed