. 2019 Jan 11;4(31):eaao4310.
doi: 10.1126/sciimmunol.aao4310.

Tumor-infiltrating human CD4+ regulatory T cells display a distinct TCR repertoire and exhibit tumor and neoantigen reactivity

Affiliations

Tumor-infiltrating human CD4+ regulatory T cells display a distinct TCR repertoire and exhibit tumor and neoantigen reactivity

Mojgan Ahmadzadeh et al. Sci Immunol. .

Abstract

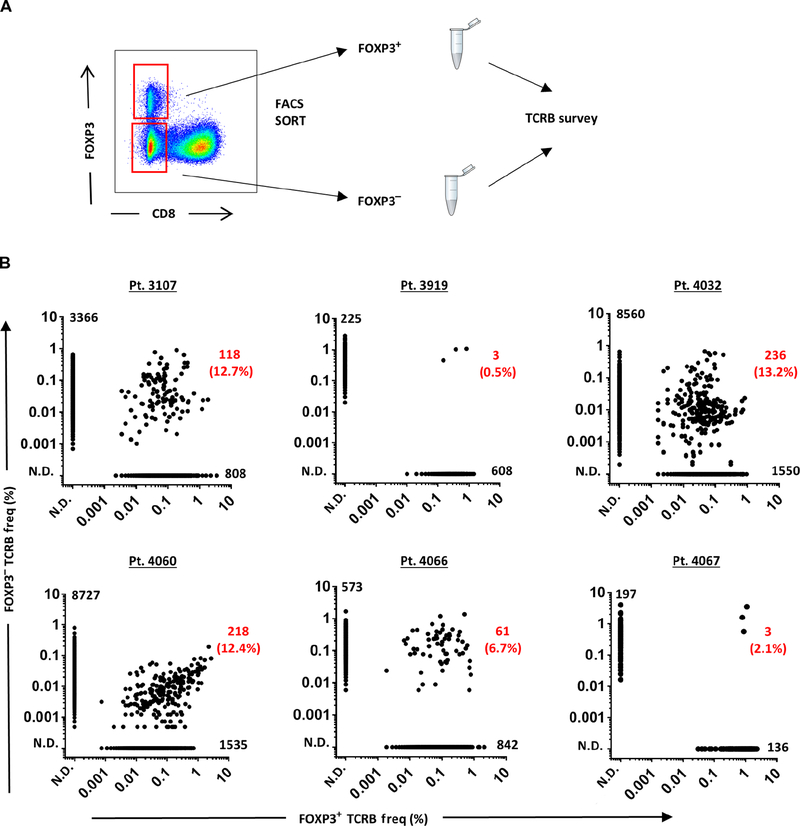
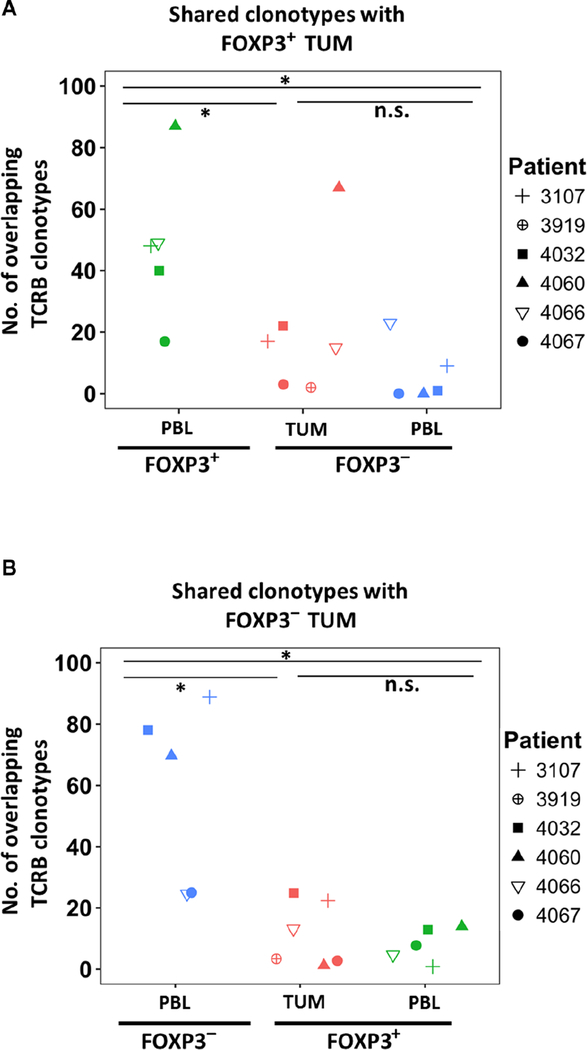
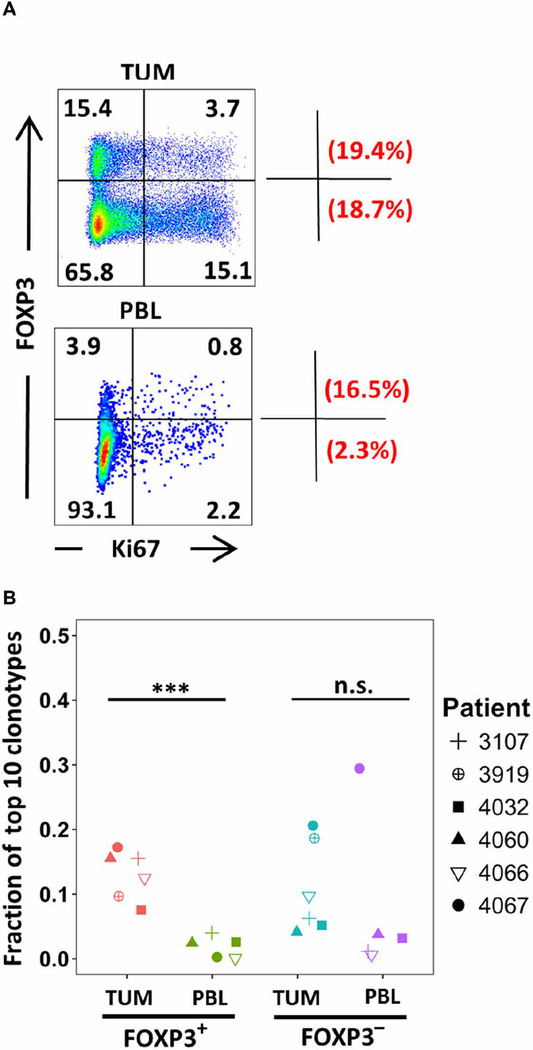
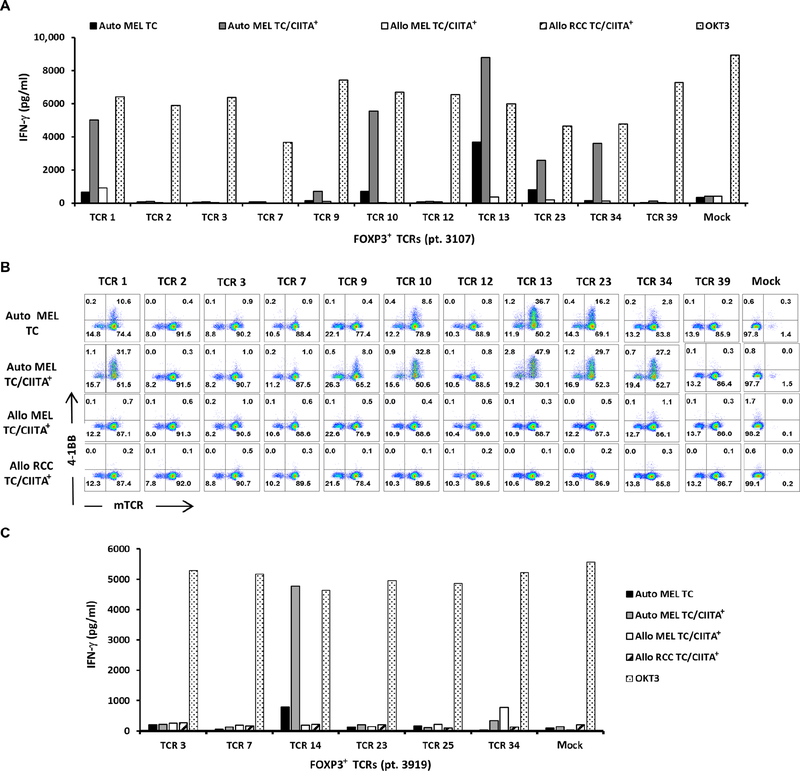
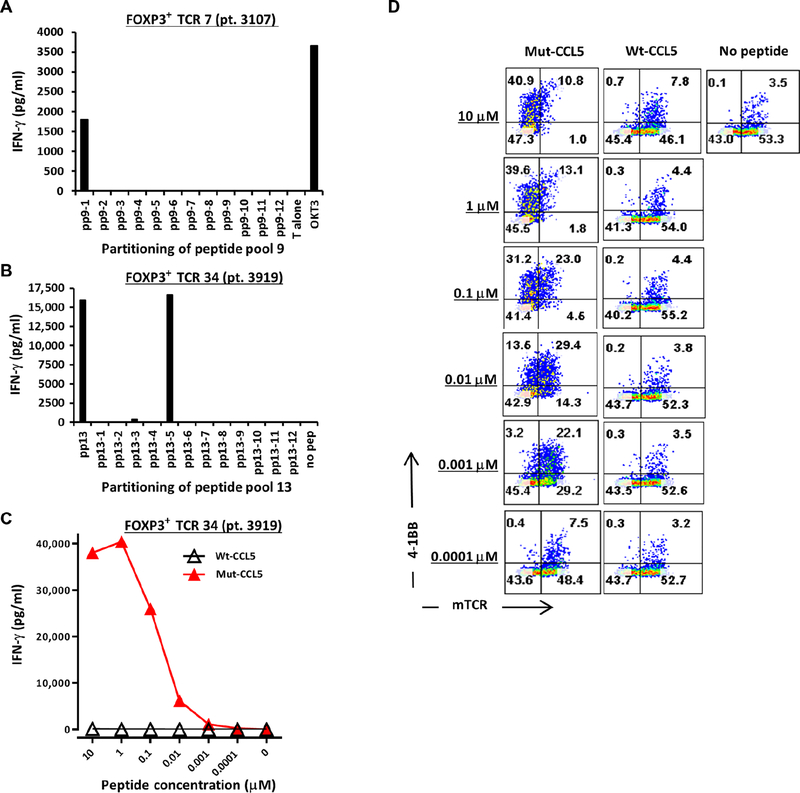
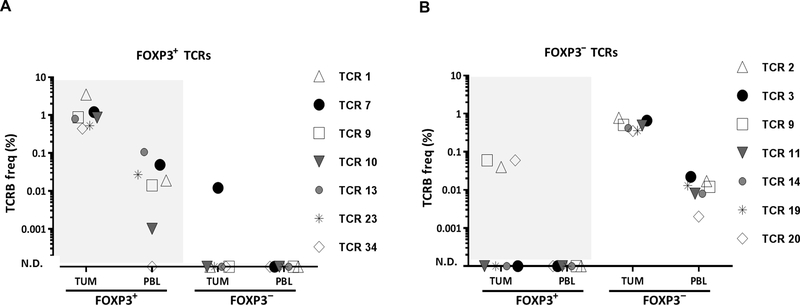
CD4+ regulatory T (Treg) cells have an essential function in maintaining self-tolerance; however, they may also play a detrimental role in antitumor immune responses. The presence of elevated frequencies of Treg cells in tumors correlates with disease progression and poor survival in patients with cancer. The antigen specificity of Treg cells that have expanded in the tumor microenvironment is poorly understood; answering this question may provide important insights for immunotherapeutic approaches. To address this, we used a novel combinatorial approach to characterizing the T cell receptor (TCR) profiles of intratumoral Treg cells from patients with metastatic melanoma, gastrointestinal, and ovarian cancers and elucidated their antigen specificities. The TCR repertoires of tumor-resident Treg cells were diverse yet displayed significant overlap with circulating Treg cells but not with conventional T cells in tumor or blood. TCRs isolated from Treg cells displayed specific reactivity against autologous tumors and mutated neoantigens, suggesting that intratumoral Treg cells act in a tumor antigen-selective manner leading to their activation and clonal expansion in the tumor microenvironment. Tumor antigen-specific Treg-derived TCRs resided in the tumor and in the circulation, suggesting that both Treg cell compartments may serve as a source for tumor-specific TCRs. These findings provide insights into the TCR specificity of tumor-infiltrating human Treg cells that may have potential implications for cancer immunotherapy.


Conflict of interest statement

Competing interests: Authors declare that they have no competing financial interests.

Figures

Fig. 1.
Fig. 1.. TCRB repertoire of intratumoral FOXP 3+ Treg cells was primarily distinct from FOXP3 Tconv cells.
(A) Representation of sorting strategy to isolate FOXP3+ Treg cells and FOXP3 Tconv cells from freshly thawed single-cell suspension of a patient’s (3107) tumor digest. The dot plot was gated on CD3+ lymphocytes. The TCRB immunosequencing was performed on each sorted population to determine the rank and frequency of TCRB clonotypes. (B) The frequency of all productive TCRB sequences in FOXP3+ and FOXP3 subsets for each patient (pt.) was plotted along the x axis and y axis, respectively. Each dot represents a unique TCRB clonotype. The number of overlapping clonotypes and the percentage per total FOXP3+ clonotypes are indicated in red. The number of unique TCRB clonotypes for FOXP3+ (x axis) and FOXP3 (y axis) is indicated next to each axis, respectively. N.D., not detected.
Fig. 2.
Fig. 2.. The dominant TCRB clonotypes in intratumoral FOXP 3+ Treg cells significantly overlapped with circulating FOXP3+ Treg cells.
Each symbol represents a patient’s total number of overlapping TCRB clonotypes among the top 100 TCRB sequences from intratumoral FOXP3+ (A) or FOXP3 (B) subset compared with the other T cell compartments. The total samples were n = 6 and n = 5 for tumor and for PBL, respectively. The dominant TCRB clonotypes of FOXP3+ TUM did not share any clonotypes with FOXP3 PBL for patients 4060 and 4067 (A). *P < 0.05 using Wilcoxon signed-rank test; n.s., nonsignificant values.
Fig. 3.
Fig. 3.. Clonal expansion of tumor-infiltrating FOXP 3+ Treg cells.
(A) A single-cell suspension of tumor digest and PBL from the same patient (3107) was stained for CD3, CD8, FOXP3, and Ki67; the dot plots were gated on CD8CD3+ T cells. The values within each quadrant represent the percentage of cells in that quadrant. The fraction of dividing cells within the Treg (Ki67+FOXP3+/total FOXP3+) and Tconv (Ki67+FOXP3/total FOXP3) is depicted as percentage values in the upper corner and lower corner outside the dot plots, respectively. The quadrants were set on the basis of negative control. (B) The fraction of the top 10 TCRB clonotypes was calculated by taking the sum of their TCRB frequencies divided by the total TCRB frequencies per each FOXP3+ or FOXP3 subset in tumor or PBL for each patient. Each symbol represents one patient. The total samples were n = 6 and n = 5 for tumor and for PBL, respectively. ***P < 0.0005 using Wilcoxon signed-rank test.
Fig. 4.
Fig. 4.. FOXP 3+ Treg-derived TCRs exhibited tumor reactivity.
(A) The most dominant TCR clonotypes derived from the intratumoral FOXP3+ Treg cells (patient 3107) were transduced into autologous PBL and subsequently cocultured overnight with autologous (Auto MEL) or allogenic (Allo MEL or Allo RCC) TC lines, and the IFN-γ in the supernatant was quantified by ELISA. (B) The cocultured cells were also stained with anti-CD3, anti-CD4, anti-mTCRB, and anti−4–1BB antibodies to quantify the percentage of 4–1BB up-regulation on mTCRB+ T cells by FACS. The dot plots were gated on CD4+CD3+ propidium iodine (PI) T cells. (C) The most dominant TCR clonotypes derived from the intratumoral FOXP3+ Treg cells (patient 3919) were transduced into HLA class II–matched donor PBL and cocultured overnight with autologous or allogenic TC, and the IFN-γ in the supernatant was quantified by ELISA. Data are representative of at least two independent experiments.
Fig. 5.
Fig. 5.. FOXP 3+ Treg-derived TCRs exhibited specific reactivity against mutant neo-antigens.
(A) FOXP3+ TCR 7 (patient 3107) was cocultured overnight with autologous DC pulsed with individual long mutated peptides from pp9, and IFN-γ production was quantified by ELISA. (B) HLA class II–matched donor PBL was transduced with FOXP3+ TCR 34 (patient 3919) and subsequently cocultured overnight with the donor-derived DCs that were pulsed with pp13 or its individual peptides, and IFN-γ production was quantified by ELISA. (C) FOXP3+ TCR 34 was co-cultured with titrated amount of high-performance liquid chromatography (HPLC) purified mutated (mut-) or wild-type (wt-) CCL5 (initially identified as pp13–5), and IFN-γ in the supernatant was quantified by ELISA. (D) The cocultured cells from (B) were stained similarly as in Fig. 4B to assess the up-regulation of 4–1BB on FOXP3+ TCR 34–transduced T cells (mTCRB+ cells) after an overnight coculture with DC pulsed with mut- or wt-CCL5 peptides (HPLC). The dot plots were gated on CD4+CD3+ PI T cells. All data are representative of at least two independent experiments.
Fig. 6.
Fig. 6.. Tumor-reactive FOXP 3+ TCRs were also found in the circulating Treg population.
(A) The frequency of six tumor-reactive and one neoantigen-reactive FOXP3+ TCRs (patient 3107) was assessed in each FOXP3 subset in the tumor and PBL using TCRB immunosequencing survey. (B) Similarly, the frequency of seven tumor-reactive FOXP3 TCRs (patient 3107) was assessed in each FOXP3 compartment. Each symbol represents a single reactive TCR. The total TCRB clonotypes for FOXP3+ TUM, FOXP3+ PBL, FOXP3 TUM, and for FOXP3 PBL were 926, 3007, 3484, and 50,586 sequences, respectively.

Similar articles

Cited by

References

    1. Baecher-Allan C, Viglietta V, Hafler DA, Human CD4+CD25+ regulatory T cells. Semin. Immunol 16, 89–98 (2004). - PubMed
    1. Sakaguchi S, Yamaguchi T, Nomura T, Ono M, Regulatory T cells and immune tolerance. Cell 133, 775–787 (2008). - PubMed
    1. Josefowicz SZ, Lu L-F, Rudensky AY, Regulatory T cells: Mechanisms of differentiation and function. Annu. Rev. Immunol. 30, 531–564 (2012). - PMC - PubMed
    1. Rudensky AY, Regulatory T cells and Foxp3. Immunol. Rev. 241, 260–268 (2011). - PMC - PubMed
    1. Ahmadzadeh M, Felipe-Silva A, Heemskerk B, Powell DJ Jr., Wunderlich JR, Merino MJ, Rosenberg SA, FOXP3 expression accurately defines the population of intratumoral regulatory T cells that selectively accumulate in metastatic melanoma lesions. Blood 112, 4953–4960 (2008). - PMC - PubMed

Publication types