. 2019 Feb 4;216(2):267-278.
doi: 10.1084/jem.20180729. Epub 2019 Jan 11.

Heterozygous Tbk1 loss has opposing effects in early and late stages of ALS in mice

Affiliations

Heterozygous Tbk1 loss has opposing effects in early and late stages of ALS in mice

David Brenner et al. J Exp Med. .

Abstract

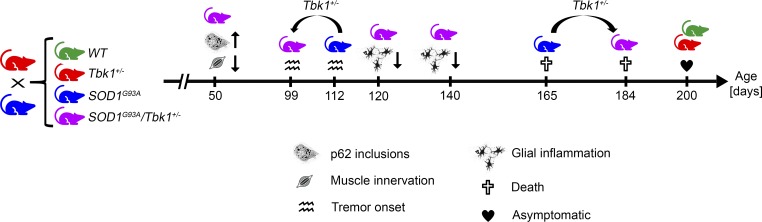
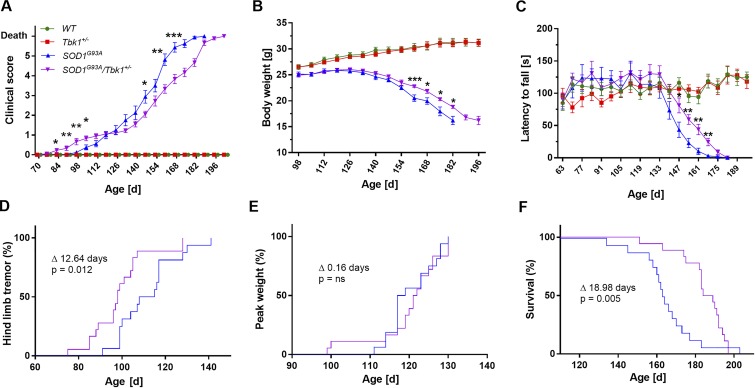
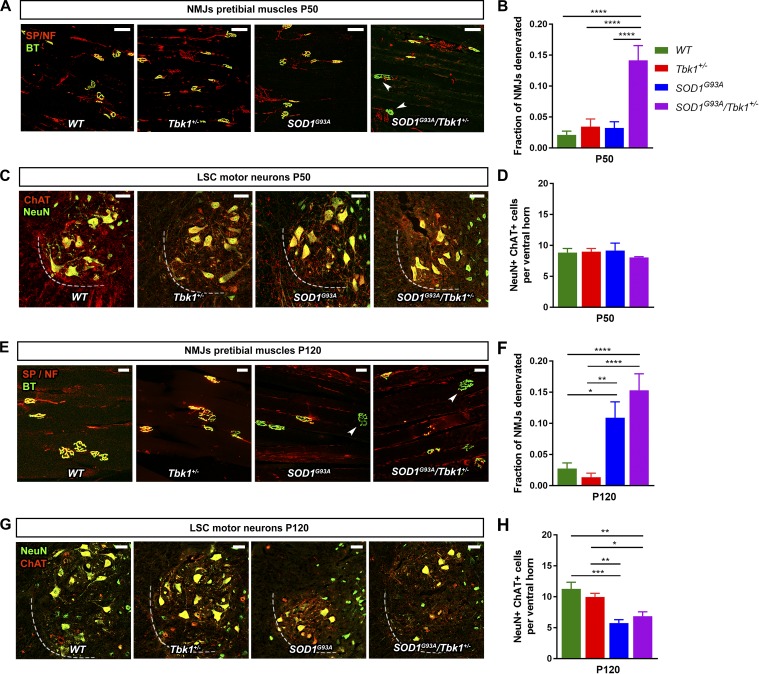
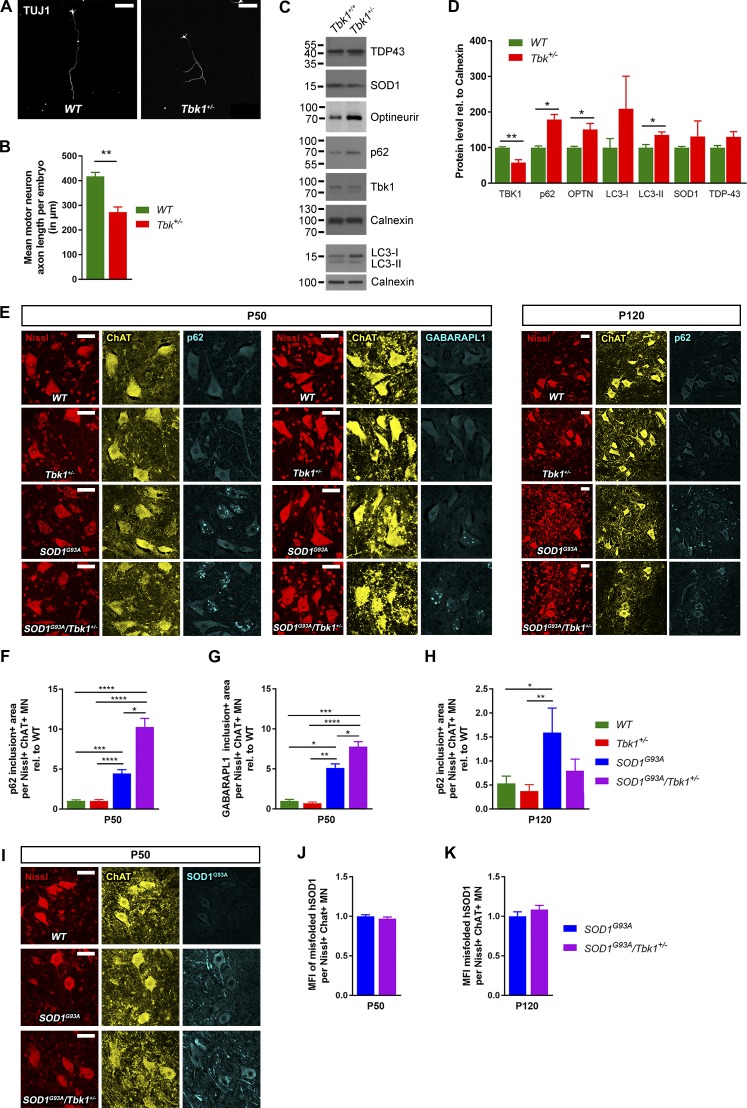
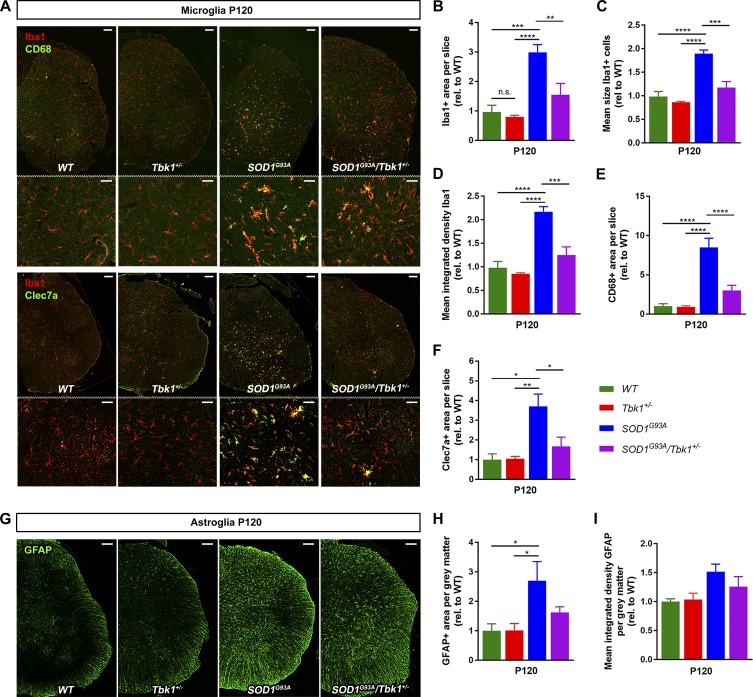
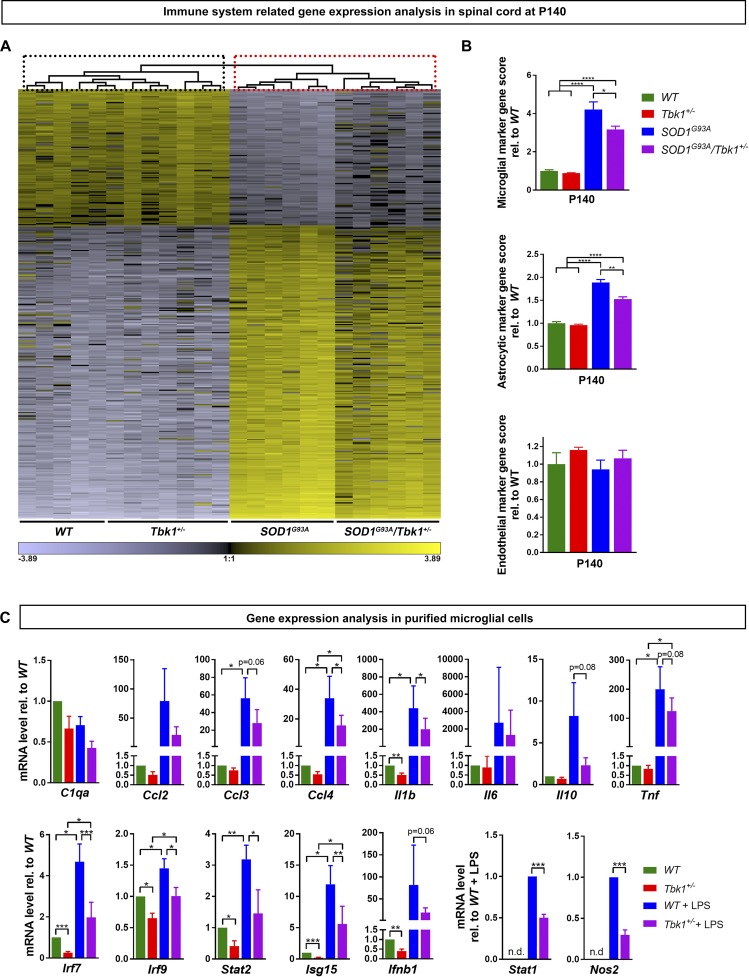
Heterozygous loss-of-function mutations of TANK-binding kinase 1 (TBK1 ) cause familial ALS, yet downstream mechanisms of TBK1 mutations remained elusive. TBK1 is a pleiotropic kinase involved in the regulation of selective autophagy and inflammation. We show that heterozygous Tbk1 deletion alone does not lead to signs of motoneuron degeneration or disturbed autophagy in mice during a 200-d observation period. Surprisingly, however, hemizygous deletion of Tbk1 inversely modulates early and late disease phases in mice additionally overexpressing ALS-linked SOD1G93A , which represents a "second hit" that induces both neuroinflammation and proteostatic dysregulation. At the early stage, heterozygous Tbk1 deletion impairs autophagy in motoneurons and prepones both the clinical onset and muscular denervation in SOD1G93A/Tbk1+/- mice. At the late disease stage, however, it significantly alleviates microglial neuroinflammation, decelerates disease progression, and extends survival. Our results indicate a profound effect of TBK1 on brain inflammatory cells under pro-inflammatory conditions and point to a complex, two-edged role of TBK1 in SOD1-linked ALS.


Figures

None
Graphical abstract
Figure 1.
Figure 1.
Heterozygous Tbk1 deletion prepones early motor symptoms but slows disease progression and prolongs survival in the SOD1G93A ALS mouse model. (A) Progression of the clinical score at group level. SOD1G93A/Tbk1+/− mice show a bi-phasic, first accelerated and then slowed, disease progression compared with SOD1G93A siblings. (B) Weight curve at group level. SOD1G93A/Tbk1+/− mice show a slowed progression of weight loss compared with SOD1G93A siblings. (C) Performance in the rotarod test at group level over time. SOD1G93A/Tbk1+/− mice show a slowed progression of motor decline compared with SOD1G93A siblings. (D) Kaplan-Meier plot of the fraction of mice with hind limb tremor (score of 1). SOD1G93A/Tbk1+/− mice present with a significantly earlier onset of hind limb tremor than SOD1G93A siblings. (E) Kaplan-Meier plots of the fraction of mice having reached their weight peak. SOD1G93A/Tbk1+/− and SOD1G93A siblings exhibit a similar onset of weight loss. (F) As demonstrated by Kaplan-Meier survival curves, heterozygous deletion of Tbk1 significantly prolongs survival of SOD1G93A mice. n = 16–18 male mice per group in all graphs. Data in A–C are presented as means ± SEM and were analyzed by one-way ANOVA followed by Tukey's multiple comparisons post hoc test. Kaplan-Meier plots were analyzed using the log-rank (Mantel-Cox) test. *, P < 0.05; **, P < 0.01; ***, P < 0.001.
Figure 2.
Figure 2.
Tbk1 haploinsufficiency enhances NMJ denervation in the early phase of the SOD1G93A ALS mouse model. (A) Representative images of NMJs of pretibial muscles at P50 stained with α-bungarotoxin (BT; presynaptic, green), anti-Synaptophysin (SP), and anti–pan-Neurofilament (NF; postsynaptic, red). Completely denervated NMJs are indicated by arrowheads. Scale bar, 100 µm. (B) SOD1G93A/Tbk1+/− mice show significant NMJ denervation as compared with the other genotypes at P50. (C) Representative images of MNs in the anterior horn of the LSC at P50. Scale bar, 50 µm. (D) MN counts in the LSC at P50 do not significantly differ among the four genotypes. (E) Representative images of NMJs of pretibial muscles at P120. Completely denervated NMJs are indicated by arrowheads. Scale bar, 50 µm. (F) No significant difference in the level of NMJ denervation was observed between SOD1G93A/Tbk1+/− and SOD1G93A mice at P120. (G) Representative images of MNs in the anterior horn of the LSC at P120. Scale bar, 50 µm. (H) MN counts in the LSC at P120 do not significantly differ among Tbk1+/− and WT mice or between SOD1G93A/Tbk1+/− and SOD1G93A siblings. n = 5–7 female mice per group in all graphs. Data are presented as means ± SEM. Data presented in B and F were analyzed by Kruskal-Wallis test followed by Dunn's multiple comparisons post hoc test. Data presented in D and H was analyzed by one-way ANOVA followed by Tukey's multiple comparisons post hoc test. *, P < 0.05; **, P < 0.01; ***, P < 0.001; ****, P < 0.0001.
Figure 3.
Figure 3.
Tbk1 haploinsufficiency induces markers of impaired autophagy in cultured MNs and in SOD1G93A mice. (A) Representative images of primary MNs from E12.5 mouse embryos 1 wk in culture stained against TUJ1. Scale bar, 100 µm. (B) Heterozygous Tbk1 deletion significantly impairs axonal outgrowth of primary MNs. (C) Representative Western blots of lysate from primary MNs stained against TBK1, p62, OPTN, LC3, SOD1, and TDP-43. (D) Quantification of Western blots from C. TBK1 was reduced by 50% in Tbk1+/− MNs. The autophagy proteins p62, OPTN, and LC3-II significantly accumulated in primary MNs upon heterozygous Tbk1 deletion. n = 3; each n is a pool of three embryos. (E) Representative images of LSC MNs of P50 and P120 mice stained against p62 or GABARAPL1. While p62 aggregates are located within large MNs at P50, the gross of aggregated p62 is located outside of ChAT+ MN somata at P120. Scale bar, 50 µm. (F and G) At P50, heterozygous Tbk1 deletion increases the area of p62+ (F) and GABARAPL1+ (G) round-body inclusions in the LSC of SOD1G93A mice. (H) At P120, the area of intracellular p62+ inclusions per MN does not differ between SOD1G93A/Tbk1+/− and SOD1G93A siblings. (I) Representative images of mouse LSC MNs at P50, stained against human misfolded SOD1G93A (with antibody B8H10). Scale bar, 50 µm. (J and K) Heterozygous Tbk1 deletion does not alter the mean fluorescence intensity of misfolded human SOD1G93A in LSC MNs of P50 and P120 mice. n = 5–7 female mice per group in all in vivo graphs. Data are presented as means ± SEM. Data presented in B, D, J, and K were analyzed by Student’s t test. Data presented in F–H were analyzed by Kruskal-Wallis test followed by Dunn's multiple comparisons post hoc test. *, P < 0.05; **, P < 0.01; ***, P < 0.001; ****, P < 0.0001.
Figure 4.
Figure 4.
Tbk1 haploinsufficiency mitigates microglial neuroinflammation in SOD1G93A mice. (A) Representative photomicrographs of LSC hemispheres stained for the microglia markers Iba1, CD68, and Clec7a. Scale bars, 100 µm; 50 µm in magnified images. (B–F) SOD1G93A/Tbk1+/− mice showed a reduced Iba+, CD68+, and Clec7a+ area, reduced integrated density, and reduced mean size of Iba+ microglia, compared with SOD1G93A siblings. (G) Representative photomicrographs of astrogliosis in the gray matter of the LSC at the age of P120. Scale bar, 100 µm. (H and I) A nonsignificant trend toward reduced GFAP+ area (I) and mean integrated density of GFAP (H) in SOD1G93A/Tbk1+/− mice compared with SOD1G93A siblings was observed. n = 5–7 female mice per group. Data are presented as means ± SEM. Data were analyzed by one-way ANOVA followed by Tukey's multiple comparisons post hoc test. *, P < 0.05; **, P < 0.01; ***, P < 0.001; ****, P < 0.0001.
Figure 5.
Figure 5.
Tbk1 haploinsufficiency reduces glial activation gene profiles in SOD1G93A mice and in purified microglia. (A) Heat map diagram of unbiased average linkage hierarchical cluster analysis based on 366 significantly altered transcripts identified by one-way ANOVA across all four genotypes (P value threshold: 6.25 × 10⁻⁵; corresponding to a P value of 0.05, Bonferroni corrected for multiple testing). The cluster analysis does not separate Tbk1+/− from WT animals (highlighted by dotted black box), but completely separates SOD1G93A/Tbk1+/− mice from their SOD1G93A siblings (highlighted by dotted red box). n = 5–7 mice per group. (B) Scores of cell-specific marker gene expression. Expression of microglial and astroglial marker genes was significantly reduced in SOD1G93A/Tbk1+/− mice compared with SOD1G93A siblings. n = 5–7 mice per group. (C) RT-qPCR of lysates from purified primary microglia untreated or stimulated with LPS (50 ng/ml for 6 h). Ccl4, Il1b, and Nos2 and the IFN-I signaling cascade components Irf7, Irf9, Stat1, Stat2, Isg15, and Ifnb were significantly down-regulated in Tbk1+/− microglia already under basal conditions and/or after activation with LPS. n = 6; each n is a pool of two to three pups. n.d., not detectable. Data are presented as means ± SEM. Data in B were analyzed by one-way ANOVA followed by Tukey's multiple comparisons post hoc test. Data in C were analyzed by one-tailed Student’s t test. *, P < 0.05; **, P < 0.01; ***, P < 0.001; ****, P < 0.0001.

Similar articles

Cited by

References

    1. Ahmad L., Zhang S.-Y., Casanova J.-L., and Sancho-Shimizu V.. 2016. Human TBK1: A Gatekeeper of Neuroinflammation. Trends Mol. Med. 22:511–527. 10.1016/j.molmed.2016.04.006 - DOI - PMC - PubMed
    1. Beers D.R., Henkel J.S., Xiao Q., Zhao W., Wang J., Yen A.A., Siklos L., McKercher S.R., and Appel S.H.. 2006. Wild-type microglia extend survival in PU.1 knockout mice with familial amyotrophic lateral sclerosis. Proc. Natl. Acad. Sci. USA. 103:16021–16026. 10.1073/pnas.0607423103 - DOI - PMC - PubMed
    1. Boillée S., Yamanaka K., Lobsiger C.S., Copeland N.G., Jenkins N.A., Kassiotis G., Kollias G., and Cleveland D.W.. 2006. Onset and Progression in Inherited ALS Determined by MNs and Microglia. Science. 312:1389–1392. - PubMed
    1. Bonnard M., Mirtsos C., Suzuki S., Graham K., Huang J., Ng M., Itié A., Wakeham A., Shahinian A., Henzel W.J., et al. . 2000. Deficiency of T2K leads to apoptotic liver degeneration and impaired NF-kappaB-dependent gene transcription. EMBO J. 19:4976–4985. 10.1093/emboj/19.18.4976 - DOI - PMC - PubMed
    1. Cirulli E.T., Lasseigne B.N., Petrovski S., Sapp P.C., Dion P.A., Leblond C.S., Couthouis J., Lu Y.-F., Wang Q., Krueger B.J., et al. . 2015. Exome sequencing in amyotrophic lateral sclerosis identifies risk genes and pathways. Science. 347:1436–1441. - PMC - PubMed

Publication types

MeSH terms