. 2019 Mar 8;294(10):3744-3759.
doi: 10.1074/jbc.RA118.004825. Epub 2019 Jan 11.

CNS-derived extracellular vesicles from superoxide dismutase 1 (SOD1)G93A ALS mice originate from astrocytes and neurons and carry misfolded SOD1

Affiliations

CNS-derived extracellular vesicles from superoxide dismutase 1 (SOD1)G93A ALS mice originate from astrocytes and neurons and carry misfolded SOD1

Judith M Silverman et al. J Biol Chem. .

Abstract

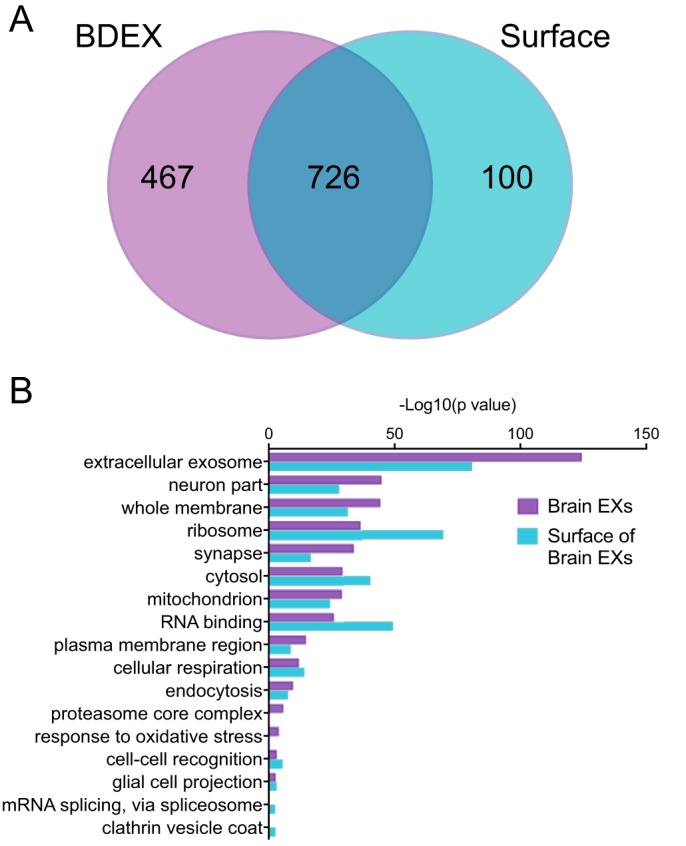
Extracellular vesicles (EVs) are secreted by myriad cells in culture and also by unicellular organisms, and their identification in mammalian fluids suggests that EV release also occurs at the organism level. However, although it is clearly important to better understand EVs' roles in organismal biology, EVs in solid tissues have received little attention. Here, we modified a protocol for EV isolation from primary neural cell culture to collect EVs from frozen whole murine and human neural tissues by serial centrifugation and purification on a sucrose gradient. Quantitative proteomics comparing brain-derived EVs from nontransgenic (NTg) and a transgenic amyotrophic lateral sclerosis (ALS) mouse model, superoxide dismutase 1 (SOD1)G93A, revealed that these EVs contain canonical exosomal markers and are enriched in synaptic and RNA-binding proteins. The compiled brain EV proteome contained numerous proteins implicated in ALS, and EVs from SOD1G93A mice were significantly depleted in myelin-oligodendrocyte glycoprotein compared with those from NTg animals. We observed that brain- and spinal cord-derived EVs, from NTg and SOD1G93A mice, are positive for the astrocyte marker GLAST and the synaptic marker SNAP25, whereas CD11b, a microglial marker, was largely absent. EVs from brains and spinal cords of the SOD1G93A ALS mouse model, as well as from human SOD1 familial ALS patient spinal cord, contained abundant misfolded and nonnative disulfide-cross-linked aggregated SOD1. Our results indicate that CNS-derived EVs from an ALS animal model contain pathogenic disease-causing proteins and suggest that brain astrocytes and neurons, but not microglia, are the main EV source.

Keywords: amyotrophic lateral sclerosis (ALS) (Lou Gehrig disease); astrocyte; central nervous system (CNS); exosome (vesicle); extracellular vesicles; neurodegeneration; protein homeostasis; proteomics; secretion.


Conflict of interest statement

N. R. C. is the Chief Scientific Officer of ProMIS Neurosciences, which has licensed the 3H1 misfolded SOD1–specific antibody technology

Figures

Figure 1.
Figure 1.
Intact EVs are isolated from the extracellular spaces of whole mouse brains with minimal contamination. A, EVs were collected from whole brains from NTg animals, and 100,000 × g pellets were floated through a stepwise sucrose gradient (fraction 1 = 0%, fraction 6 = 60% sucrose). B, NTg-purified BDEVs were compared directly with equal and increasing amounts of NTg brain homogenate prepared with a wand homogenizer. GRP78, PrP, and SOD1 exposure was for 30 s; Bcl-2 and GM130 exposure was for 300 s. C, electron micrographs of BDEVs (100,000 × g pellets) from NTg– and human SOD1G93A–overexpressing animals show vesicular structures with canonical exosome morphology. Scale bar, 100 nm. D, BDEV 100,000 × g pellets were fractionated in an 11-step iodixanol gradient (fraction 1 = 0%, fraction 11 = 60%). E, electron micrographs of purified tissue-derived MVs, isolated at 15,000 × g, and EXs isolated at 100,000 × g. Brain MV scale bar = 200 nm. Brain EX, Spinal Cord MV and EX, and Brain and Spinal Cord MV inset scale bars, 100 nm.
Figure 2.
Figure 2.
Quantitative identification of BDEX and surface proteomes. A–D, quantitative proteomics data were analyzed using Perseus (89, 90). Data are presented as the -fold difference on the x axis and the negative log of the p values on the y axis. For each plot, proteins are marked with a different color and shape according to the significance of the enrichment in either sample. Pink squares, significant p values after applying Benjamin–Hochberg correction for false discovery rate; blue triangles, not significant with false discovery correction but have p values < 0.01; green diamonds, p values between 0.01 and 1. Select proteins are labeled. Significantly enriched KEGG terms, when present, are listed below the graphs. A, SOD1G93A BDEX over NTg BDEX. B, surface proteins from SOD1G93A BDEX over surface proteins from NTg BDEX. C, the relative abundance ratios for surface versus whole vesicles, where all of the proteins are from NTg samples. D, relative abundance ratios for SOD1G93A vesicle surface proteins versus NTg whole vesicles. E, Venn diagram of overlap between surface-depleted BDEX proteome and surface proteome. F, Venn diagrams showing overlap between mouse BDEX and vesicles found in human CSF (49) and vesicles secreted by human SH-SY5Y neuroblastoma cell line (50).
Figure 3.
Figure 3.
BDEXs and surface proteomes have significantly enriched gene ontology annotations that reflect their neuronal and vesicular origin. Enrichment of GO annotations in the BDEX proteome or the BDEX surface proteome, compared with the entire mouse genome, was performed using ErmineJ (91, 92). False discovery rate correction was used to determine significant enrichments. A, Venn diagram of the overlap in GO annotations between the BDEX and the surface proteome. B, a selection of significantly overrepresented GO terms is shown; the full list can be found in Tables S8 and S9.
Figure 4.
Figure 4.
Flow cytometric analysis suggests that the majority of BDMV may be of astrocyte origin. A, forward-side scatter plots of BDEX and MVs before and after lysis in 1% Nonidet P-40 shows separation of vesicle signal from noise. Percentage of total events within an arbitrary gate is shown for illustrative purpose only. B and C, the percentage positive of total events (including noise) for an astrocyte marker (GLAST), neuronal marker NCAM (CD56), exosome marker (CD81), synaptic vesicle marker (SNAP25), and microglia marker (CD11b). The number of positive events found after lysis was subtracted. Data were analyzed by two-way ANOVA. No difference between G93A and NTg BDMV (B, p = 0.4012) or BDEX (C, p = 0.8095) marker expression was found. The percentage positive of all events collected, after subtraction of positive events in the lysed sample, is shown. Data are from 4–5 identical experiments. D, significant decreases in the percentage of positive events in NTg brain EXs for most markers are observed compared with NTg brain MVs. Data were analyzed by two-way ANOVA with Sidak's multiple-comparison test: p = 0.0002 (interaction), p < 0.0001 (marker), and p < 0.0001 (vesicle). E and F, the percentage positive of total events (including noise) after lysis subtraction in vesicles collected from spinal cords. Data were analyzed by two-way ANOVA. No difference between G93A and NTg spinal cord MV (E, p = 0.6218) and EX (F, p = 0.4530) marker expression was found. G, when spinal cord MVs are compared directly with the EXs by two-way ANOVA, p = 0.0007 (interaction), p < 0.0001 (marker), and p = 0.0321 (vesicle). Sidak's multiple-comparison test showed some significant differences within individual markers. H and I, comparison of percentage positive MV (H) and EX (I) events between brains and spinal cords (Sp. Cord). Data were analyzed by two-way ANOVA with Sidak's multiple-comparison test: for MVs (H), p = 0.0001 (interaction), p < 0.0001 (marker), and p < 0.0001 (tissue); for EXs (I), p < 0.0001 (interaction), p < 0.0001 (marker), and p = 0.7523 (tissue). Error bars, S.E.
Figure 5.
Figure 5.
Mouse brain EVs reflect neurodegeneration occurring over time. Brain microvesicles from mice sacrificed at 2 and 5 months of age (MOA) were probed with antibodies against GLAST (A), CD11b (B), CD56 (C), and CD81 (D), and the number of positive vesicles was determined by flow cytometry. Positive events are reported as the percentage of the total positive population (including noise) minus the percentage of positive events after vesicle lysis. Data were analyzed by two-way ANOVA with a Sidak multiple-comparison test for the effect of genotype and age: Glast (A), p = 0.0007 (interaction), p = 0.0511 (age), and p = 0.0206 (genotype); CD11b (B), p = 0.3539 (interaction), p = 0.0001 (age), and p = 0.03779 (genotype). C and D, results not significant. Error bars, S.E.
Figure 6.
Figure 6.
Brain and spinal cord EVs from mice overexpressing human SOD1G93A contain and are decorated by misfolded SOD1. A, intact EXs immunoprecipitate with misfolded SOD1-specific antibodies 3H1 and 10C12 (3, 53). B and C, quantitation of the signal from three immunoprecipitation experiments: brain (B), Student's t test, p = 0.0447 (3H1) and p = 0.0170 (10C12); Spinal cord (C), Student's t test, p = 0.0070 (3H1) and p = 0.0159 (10C12). D, purified vesicle lysates from 100,000 × g pellet (EX) and 15,000 × g pellet (MV) from brains and spinal cords were assayed for misfolded SOD1 in a chemiluminescent ELISA. Anti-misfolded SOD1 antibody 3H1 was used as the capture antibody. Data are provided as raw luminescence units (RLU), as no standards of misfolded SOD1 were available for comparison. Data were analyzed by paired Student's t test. E, intact EXs from human spinal cord tissues, four each of control and SOD1 FALS (n = 3 SOD1-A4V, n = 1 SOD1-N139K), immunoprecipitated with misfolded SOD1-specific antibodies 3H1 and 10C12 (3, 53). Quantitation of the signal, normalized to the weight of source tissue, from four immunoprecipitation experiments is shown. Differences were determined by a Kruskal–Wallis nonparametric ANOVA (p = 0.0009) with Dunn's multiple-comparison test (p = 0.0496 for 3H1, p = 0.0219 for 10C12). F, purified MV lysates from human spinal cords, three control and two SOD1A4V FALS tissues, were assayed for misfolded SOD1 by ELISA. Anti-misfolded SOD1 antibody 3H1 was used as the capture antibody. Data were analyzed by Student's t test (p = 0.1003). IP, immunoprecipitation; IB, immunoblotting; error bars, S.E.
Figure 7.
Figure 7.
Differential aggregation profiles of mutant SOD1 in mice and human brain EVs. The protein cargo of microvesicles harvested from NTg and multiple ALS model mice (A–C) or human spinal cord tissue (D–F) was analyzed by reducing and nonreducing SDS-PAGE followed by SOD1 immunoblot. For representative immunoblots (A and D), reducing lanes include β-mercaptoethanol (β-merc.). Iodoacetamide (iodoact.) was included to block artifactual disulfide bonds from forming during sample processing. -mon., monomer band (∼17 kDa); *, aggregate band(s). B and C, quantitation of volume intensity of immunoblots from n = 2–4 brain MV samples per genotype normalized to the amount of protein analyzed. +β-merc./-iodoact., reducing lanes; −β-merc./+iodoact., nonreducing lanes. B, HuSOD1G93A reported on right y axis; C, aggregate; *, band at top of gel. Mean and S.E. (error bars) are shown. Differences were determined by two-way ANOVA with Sidak's multiple-comparison test. B, p = 0.2667 (interaction), p ≤ 0.0001 (genotype), and p = 0.0140 (reduction). C, p = 0.2003 (interaction), p = 0.0031 (genotype), and p = 0.4553 (reduction). E and F, quantitation of volume intensity of immunoblots from n = 4 FALS A4V samples and n = 4 control samples, normalized to the amount of protein analyzed. Mean and S.E. are shown. Aggregate signal (F) is the sum of the volume intensities for bands marked with an asterisk in D. +β-merc./−iodoact., reducing lanes; −β-merc./+iodoact., nonreducing lanes. Differences were determined by two-way ANOVA with Sidak's multiple-comparison test. E, p = 0.4012 (interaction), p = 0.5241 (disease status), and p = 0.0184 (reduction). F, p = 0.2204 (interaction), p = 0.0466 (disease status), and p = 0.0761 (reduction). Error bars, S.E.

Similar articles

Cited by

References

    1. Ravits J. (2014) Focality, stochasticity and neuroanatomic propagation in ALS pathogenesis. Exp. Neurol. 262, 121–126 10.1016/j.expneurol.2014.07.021 - DOI - PubMed
    1. Renton A. E., Chiò A., and Traynor B. J. (2014) State of play in amyotrophic lateral sclerosis genetics. Nat. Neurosci. 17, 17–23 10.1038/nn.3584 - DOI - PMC - PubMed
    1. Grad L. I., Guest W. C., Yanai A., Pokrishevsky E., O'Neill M. A., Gibbs E., Semenchenko V., Yousefi M., Wishart D. S., Plotkin S. S., and Cashman N. R. (2011) Intermolecular transmission of superoxide dismutase 1 misfolding in living cells. Proc. Natl. Acad. Sci. U.S.A. 108, 16398–16403 10.1073/pnas.1102645108 - DOI - PMC - PubMed
    1. Münch C., O'Brien J., and Bertolotti A. (2011) Prion-like propagation of mutant superoxide dismutase-1 misfolding in neuronal cells. Proc. Natl. Acad. Sci. U.S.A. 108, 3548–3553 10.1073/pnas.1017275108 - DOI - PMC - PubMed
    1. Ayers J. I., Fromholt S., Koch M., DeBosier A., McMahon B., Xu G., and Borchelt D. R. (2014) Experimental transmissibility of mutant SOD1 motor neuron disease. Acta Neuropathol. 128, 791–803 10.1007/s00401-014-1342-7 - DOI - PubMed

Publication types