. 2019 Feb 19;116(8):3030-3035.
doi: 10.1073/pnas.1817322116. Epub 2019 Jan 11.

Symbiotic organs shaped by distinct modes of genome evolution in cephalopods

Affiliations

Symbiotic organs shaped by distinct modes of genome evolution in cephalopods

Mahdi Belcaid et al. Proc Natl Acad Sci U S A. .

Abstract

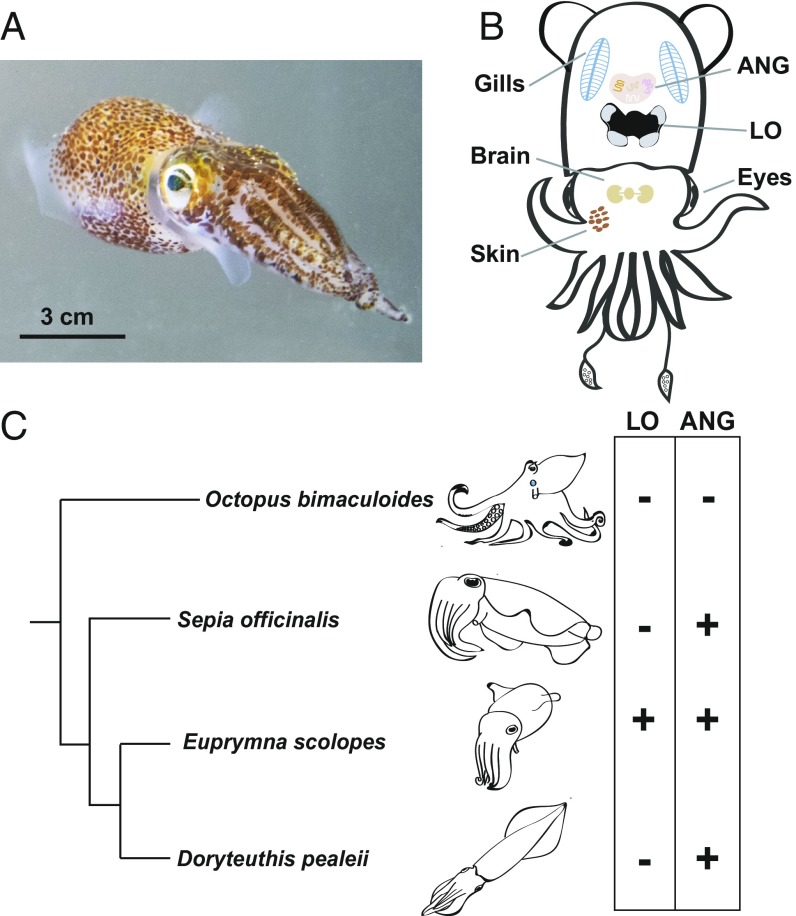
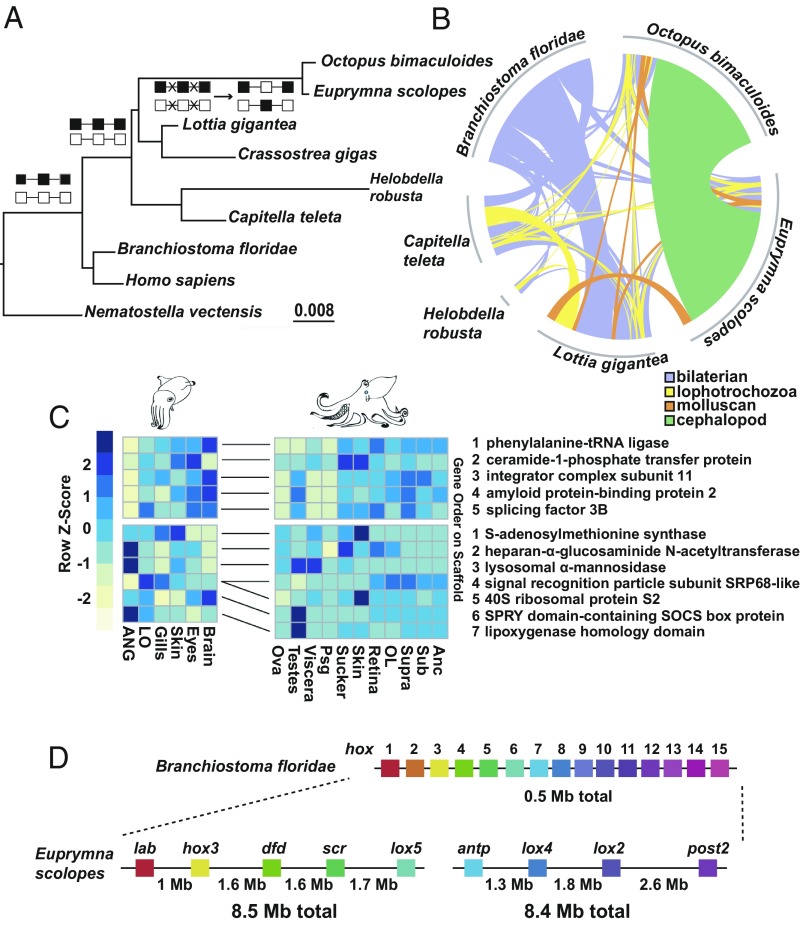
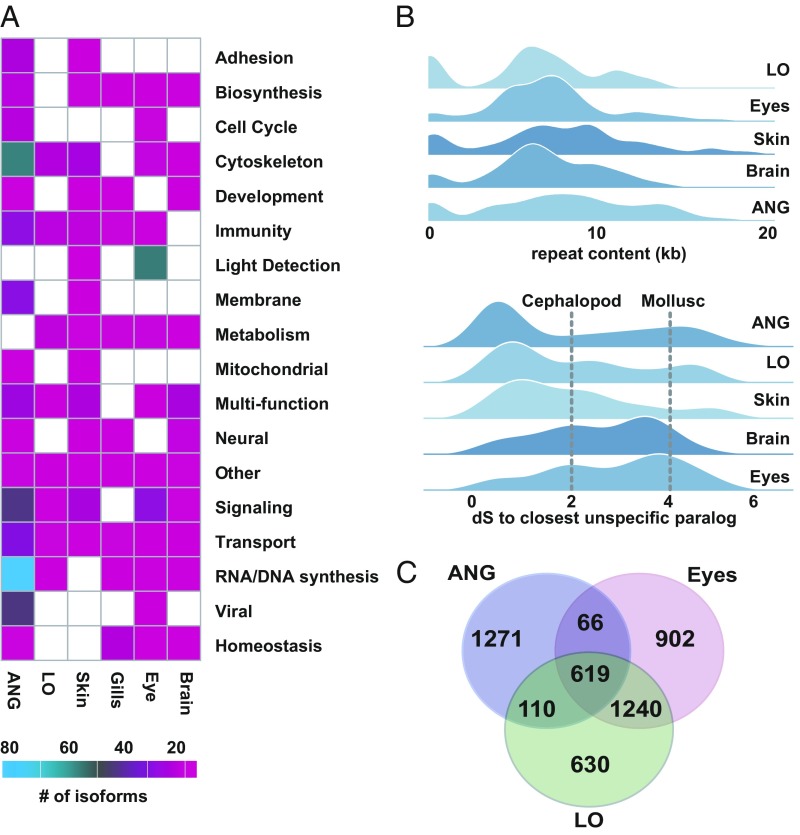
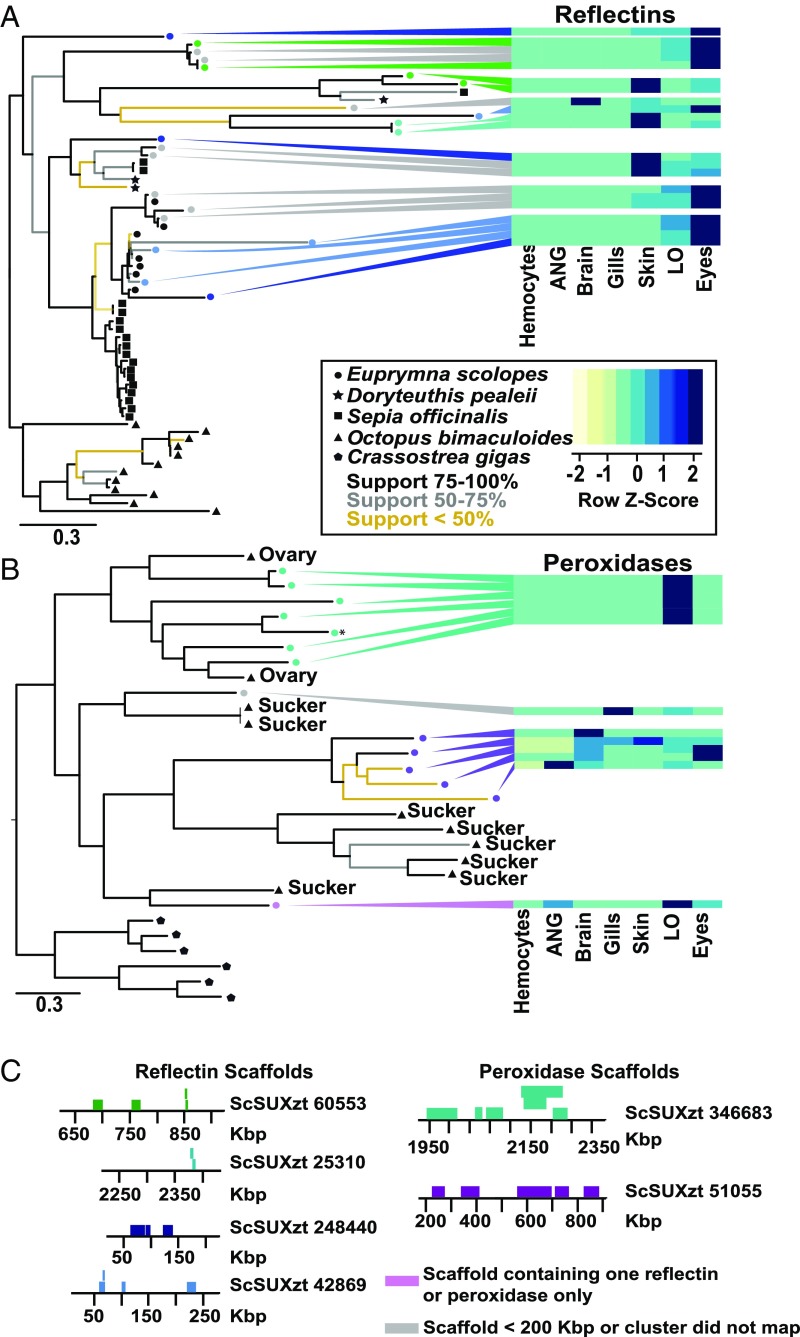
Microbes have been critical drivers of evolutionary innovation in animals. To understand the processes that influence the origin of specialized symbiotic organs, we report the sequencing and analysis of the genome of Euprymna scolopes, a model cephalopod with richly characterized host-microbe interactions. We identified large-scale genomic reorganization shared between E. scolopes and Octopus bimaculoides and posit that this reorganization has contributed to the evolution of cephalopod complexity. To reveal genomic signatures of host-symbiont interactions, we focused on two specialized organs of E. scolopes: the light organ, which harbors a monoculture of Vibrio fischeri, and the accessory nidamental gland (ANG), a reproductive organ containing a bacterial consortium. Our findings suggest that the two symbiotic organs within E. scolopes originated by different evolutionary mechanisms. Transcripts expressed in these microbe-associated tissues displayed their own unique signatures in both coding sequences and the surrounding regulatory regions. Compared with other tissues, the light organ showed an abundance of genes associated with immunity and mediating light, whereas the ANG was enriched in orphan genes known only from E. scolopes Together, these analyses provide evidence for different patterns of genomic evolution of symbiotic organs within a single host.

Keywords: cephalopods; evolution; genomics; symbiosis; transcriptomics.


Conflict of interest statement

The authors declare no conflict of interest.

Figures

Fig. 1.
Fig. 1.
The Hawaiian bobtail squid, Euprymna scolopes, a model host for microbiome research and cephalopod innovations. (A) The animal, shown here in the water column, is a nocturnal predator that uses the luminescence of the LO symbiont Vibrio fischeri for camouflage. Scale bar, 3 cm. Image courtesy of Elizabeth Ellenwood (photographer). (B) Overview of key symbiotic and nonsymbiotic organs within E. scolopes. Whereas males only have an LO symbiosis, the females have the additional symbiosis of the ANG, a reproductive organ housing a consortium of bacteria from predominantly two phyla (8). In addition to these symbiotic tissues, gene expression was also analyzed from the gills, brain, eye, and skin. (C) Distribution of LOs and ANGs that occur only in coleoid cephalopods. Branch lengths are derived from Tanner et al. (35).
Fig. 2.
Fig. 2.
Establishment of coleoid cephalopod genome architecture. (A) High rate of genome reorganization at the base of the coleoid cephalopods, as measured by the cumulative amount of microsyntenies lost and gained. Branch length estimation using MrBayes (SI Appendix) on a fixed tree topology using binary presence or absence matrix of shared orthologous microsyntenic blocks. Squares (black/white) connected by lines above the nodes indicate two hypothetical microsyntenic blocks illustrating a common scenario where conserved bilaterian and lophotrochozoan synteny is disrupted (crossed lines) followed by the emergence of a new order through rearrangement in the cephalopod stem lineage. (B) Prevalence of the unique cephalopod microsynteny (green shaded area) in O. bimaculoides and E. scolopes genomes. Total length of arches for individual species corresponds to the number of genes in microsyntenies. (C) Heat map of cephalopod unique microsyntenic clusters showing both neuronal (Upper) and broader gene expression (Lower) in E. scolopes and O. bimaculoides. Color bar indicates relative normalized gene expression level. Individual orthologous genes between E. scolopes and O. bimaculoides are connected by solid lines between heat maps with numbers indicating gene order along the scaffold. ANC, axial nerve cord; OL, optic lobe; Psg, posterior salivary gland; Supra/Sub, supraesophageal and subesophageal brain. (D) A large partial hox cluster on two separate scaffolds was recovered, totaling to a length of at least 16 Mb. Branchiostoma floridae hox cluster is shown for comparison with colors indicating orthologous genes.
Fig. 3.
Fig. 3.
Characterization (i.e., functional categories) of key tissues revealing the high contribution of novel genes toward ANG evolution as well as strong similarity between LO and eye transcriptomes. (A) Total counts of unique isoforms across different functional categories in six adult tissues. (B) (Upper) Joy plot of the number of nucleotides within 20 kilobases (kb) windows located up and downstream of the tissue-specific genes from (A) that are attributed to repetitive elements. Regions around ANG genes show higher repeat content compared with other tissues (P < 0.1, Wilcoxon rank sum test). (Lower) Joy plot of the synonymous substitutions distances (dS) between the genes specifically expressed in a given tissue to their closest paralog expressed elsewhere. Distributions from tissues representing cephalopod synapomorphies (brain and eyes) show an older mean (P < 0.1, Wilcoxon rank sum test) compared with the distributions from ANG, LO, and skin tissues. (C) Venn diagram representing the number of shared transcripts among LO, ANG, and eye tissues identifying a significant overlap between LO and eye transcripts.
Fig. 4.
Fig. 4.
Independent tandem gene cluster formation in squid and octopus and the origin of light organ-specific gene expression. Phylogenetic trees highlight highly specific expansion patterns that correlate with general shared expression between the light organ and the eyes for reflectins (A) or the appearance of the light organ-specific expression pattern for heme peroxidases (B). Heat maps indicate relative normalized expression levels for each tissue (Z scores). Scale bar underneath phylogenetic trees indicates amino acid substitutions per site. Color of the nodes (A and B) identifies genomically colocalized genes (shown in C). Those genes are clustered in tandem on several scaffolds with positions and gene identifiers labeled. (C) Tandem clusters of reflectin and peroxidase genes in the E. scolopes genome. Scaffold ID and approximate location (kbp) is shown for each gene (represented by rectangle). Colors correspond to the sequences on the trees in A for reflectins and (B) for peroxidases.

Comment in

  • Squid genomes in a bacterial world.
    Bosch TCG. Bosch TCG. Proc Natl Acad Sci U S A. 2019 Feb 19;116(8):2799-2801. doi: 10.1073/pnas.1822166116. Epub 2019 Jan 23. Proc Natl Acad Sci U S A. 2019. PMID: 30674665 Free PMC article. No abstract available.

References

    1. Moran NA, McCutcheon JP, Nakabachi A. Genomics and evolution of heritable bacterial symbionts. Annu Rev Genet. 2008;42:165–190. - PubMed
    1. Markmann K, Parniske M. Evolution of root endosymbiosis with bacteria: How novel are nodules? Trends Plant Sci. 2009;14:77–86. - PubMed
    1. Matsuura Y, et al. Evolution of symbiotic organs and endosymbionts in lygaeid stinkbugs. ISME J. 2012;6:397–409. - PMC - PubMed
    1. Griesmann M, et al. Phylogenomics reveals multiple losses of nitrogen-fixing root nodule symbiosis. Science. 2018;361:eaat1743. - PubMed
    1. McFall-Ngai MJ. The importance of microbes in animal development: Lessons from the squid-vibrio symbiosis. Annu Rev Microbiol. 2014;68:177–194. - PMC - PubMed

Publication types

MeSH terms

LinkOut - more resources