. 2019 Jan 11;10(1):163.
doi: 10.1038/s41467-018-08046-4.

Estrogen signaling in arcuate Kiss1 neurons suppresses a sex-dependent female circuit promoting dense strong bones

Affiliations

Estrogen signaling in arcuate Kiss1 neurons suppresses a sex-dependent female circuit promoting dense strong bones

Candice B Herber et al. Nat Commun. .

Abstract

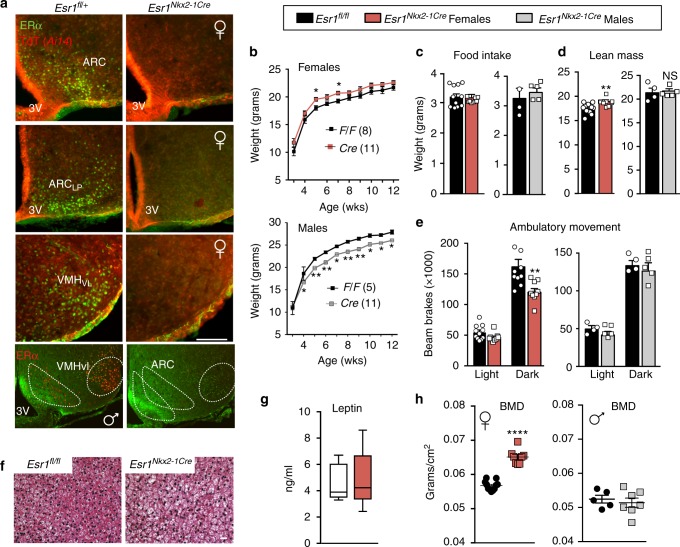
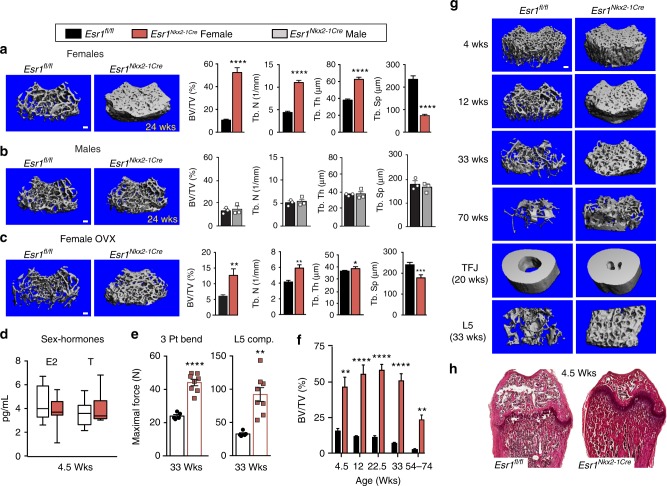
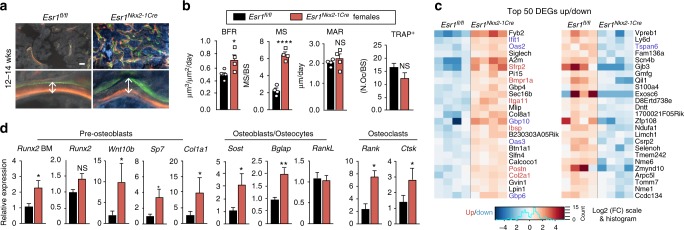
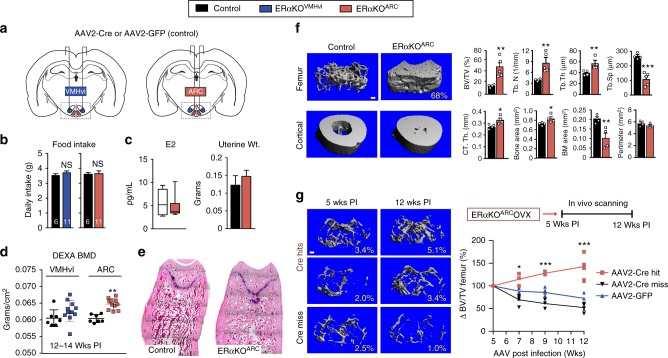
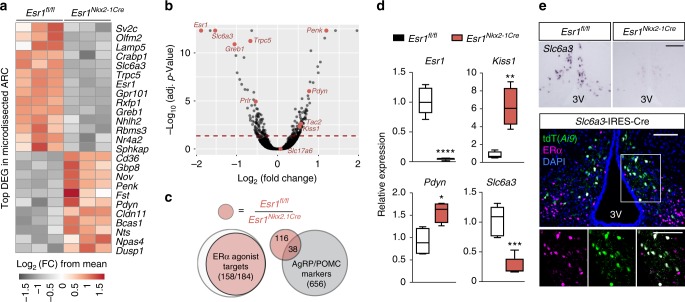
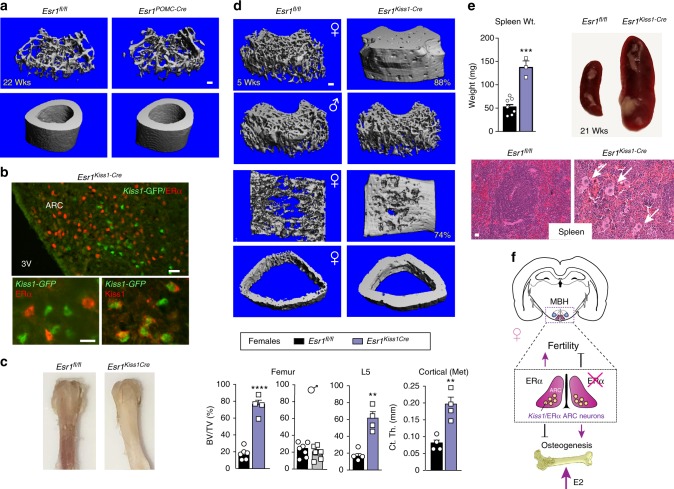
Central estrogen signaling coordinates energy expenditure, reproduction, and in concert with peripheral estrogen impacts skeletal homeostasis in females. Here, we ablate estrogen receptor alpha (ERα) in the medial basal hypothalamus and find a robust bone phenotype only in female mice that results in exceptionally strong trabecular and cortical bones, whose density surpasses other reported mouse models. Stereotaxic guided deletion of ERα in the arcuate nucleus increases bone mass in intact and ovariectomized females, confirming the central role of estrogen signaling in this sex-dependent bone phenotype. Loss of ERα in kisspeptin (Kiss1)-expressing cells is sufficient to recapitulate the bone phenotype, identifying Kiss1 neurons as a critical node in this powerful neuroskeletal circuit. We propose that this newly-identified female brain-to-bone pathway exists as a homeostatic regulator diverting calcium and energy stores from bone building when energetic demands are high. Our work reveals a previously unknown target for treatment of age-related bone disease.


Conflict of interest statement

The authors declare no competing interests.

Figures

Fig. 1
Fig. 1
Ablating ERα in MBH impairs energy expenditure and increases bone density. a Immunohistochemistry of ERα (green) or native TdTomato (TdT (Ai14); red) on coronal brain sections (scale bar = 100 µm) of Esr1fl/+; Ai14fl/+; Nkx2-1Cre (control) or Esr1fl/fl; Ai14fl/+; Nkx2-1Cre (mutant) from females or males (bottom panels). Lp lateroposterior. Fl/+ = heterozygous for Esr1 floxed allele. b Body weight curves of control (black line) or mutant females (red line) (F1,250 = 57.01, p < 0.0001) and males (grey line) (F3,316 = 25.39, p < 0.0001) fed on standard chow from 3 weeks of age. c Daily food intake per animal over 24 h determined in CLAMS (controls (black bars) mutant females (red bars) and mutant males (grey bars)). d Lean mass and e averages of ambulatory movement per animal over 12 h determined by metabolic chamber analyses for Esr1fl/fl and Esr1Nkx2-1Cre female and male cohorts, female ambulatory movement (F 1,36 = 10.14, p = 0.003). ce Animals are 8–9-week old. f Representative images of hematoxylin and eosin (H&E) staining of BAT Esr1fl/fl and Esr1Nkx2-1Cre females housed at 22 °C (8–16 weeks). Scale bar = 100 μm. g Serum leptin levels in 9-week-old control (open bars bar, n = 5) and mutant females (red  bar, n = 5) (center line = median; bounds extend minimum to maximum). h BMD measured by DEXA in Esr1fl/fl (black circles) and Esr1Nkx2-1Cre females (red squares, 16–23 weeks) and males (grey squares, 11–18 weeks). Unless otherwise indicated, number per group for female controls (n = 11) and mutants (n = 9) and for male controls (n = 4) and mutants (n = 5). Error bars are SEM. Two-way ANOVA (b, e). Unpaired Student’s t tests (c, d, g, h). For all figures, p values = *p < 0.05; **p < 0.01; ***p < 0.001; ****p < 0.0001. NS = p > 0.05
Fig. 2
Fig. 2
Sex-dependent increase in bone mass and strength in Esr1Nkx2-1Cre females. Representative μCT 3D reconstruction images of distal femurs in ∼24-week-old Esr1fl/fl and Esr1Nkx2-1Cre a females, b males, and c OVX females (15–21 weeks). Right panels show quantitative morphometric properties of distal femurs showing fractional bone volume (BV/TV (%)); trabecular number (Tb. N) trabecular thickness (Tb. Th), and separation (Tb. Sp). For females (n = 11) controls and (n = 8) mutants and for males (n = 3, 3). For OVX (n = 11) controls and (n = 8) mutants. Esr1fl/fl (black boxes), Esr1Nkx2-1Cre females (red bars) and males (grey bars). d LC–MS/MS of plasma E2 and T for Esr1fl/fl (n = 9, open box) and Esr1Nkx2-1Cre (n = 11, red box) juvenile females at 4.5 weeks of age (center line = median; bounds extend minimum to maximum). e Scatter plot of mechanical testing of distal femurs and L5 vertebral bodies (33 weeks) Esr1fl/fl (black squares), Esr1Nkx2-1Cre (red squares). f BV/TV (%) of the distal femur generated by either μCT or 2D histomorphometric analysis over time from 4.5 weeks of age to 54–74 weeks of age, for genotype (F1,50 = 172.1, p < 0.0001), animal number in each Esr1fl/fl and Esr1Nkx2-1Cre group for 4.5 weeks (n = 3, 4), 12 weeks (n = 5, 6), 22.5 weeks (4, 5), 33 weeks (7, 9), and 54+ weeks (9, 7). g Representative μCT images of age-dependent changes in femoral bone mass, as well as image of cortical bone at the tibial fibular joint (TFJ) in females (20 weeks), and L5 vertebral bodies (33 weeks) in Esr1fl/fl and Esr1Nkx2-1Cre females. h Representative H&E staining of female femurs from Esr1fl/fl and Esr1Nkx2-1Cre juvenile females at 4.5 weeks. Error bars are ±SEM (standard error of the mean). Two-way ANOVA (e), Unpaired Student’s t test (ad, f). *p < 0.05; **p < 0.01; ***p < 0.001; ****p < 0.0001. Scale bars = 100 μm
Fig. 3
Fig. 3
Increased bone formation in Esr1Nkx2-1Cre females. a Representative images of labeled mineralized surface of distal femur with calcein (green) and demeclocycline (orange) over a period of 1 week in a 12 week old female. Scale bars = 50 μm. b Dynamic histomorphometric results for Esr1fl/fl (n = 4, black bars) and Esr1Nkx2-1Cre (n = 4, red bars) 12–14 week females showing bone formation rate (BFR), mineralized surface (MS), and mineralized apposition rate (MAR). Number of active osteoclasts normalized to bone surface quantified by TRAP-positive staining determined in distal femurs from 5- to 7-week-old Esr1fl/fl (n = 5) and Esr1Nkx2-1Cre (n = 6) females. c Heat map of top 50 differentially expressed genes (DEGs) up and down in 4.5-week-old Esr1fl/fl and Esr1Nkx2-1Cre bone marrow Esr1fl/fl (n = 4) and Esr1Nkx2-1Cre (n = 4) females. BMP regulated genes (red) and IFN regulated genes (blue). d Quantification of indicated transcripts marking pre-osteoblasts, osteocytes, and osteoclasts in 4.5–7-week female control (n = 10) and mutant (n = 7) flushed bone marrow (BM), or in female control (n = 13) and mutant (n = 8) femur bone chips. Error bars are ±SEM. Unpaired Student’s t test (b, d). *p < 0.05; ****p < 0.0001. NS = p > 0.05
Fig. 4
Fig. 4
Bone volume in intact and OVX female mice after acute loss of ERα in ARC. a Schematic of stereotaxic delivery of AAV2-GFP or AAV2-Cre-GFP to 16-week-old Esr1fl/fl females to either the VMHvl or ARC regions to delete ERα 5-week postinfection (PI). b Food intake for AAV2-GFP (black bars), AAV2-Cre-VMHvl (blue bars) and AAV2-Cre-ARC (red bars). c LC–MS/MS plasma E2 and uterine weight for control (n = 6, open box) and for ERαKOARC (n = 9–11, red box) (center line = median; bounds are minimum to maximum). d Scatter plot of BMD for controls, ERαKOVMHvl, and ERαKOARC females. e Representative images of distal femur (H&E) in control and ERαKOARC females. f μCT images with morphometric properties of distal femur for controls (n  = 4) and ERαKOARC (n = 5) and tibio-fibular joint in control (n = 4) and ERαKOARC (n =  4) females. Scale bar = 100 μm. g Representative μCT images of distal femur in OVX females 5- and 12-week postinfection, showing AAV2-Cre hit to ARC (Cre-Hits, Red line), AAV2-Cre miss to ARC (Cre-Miss, black line and AAV2-GFP to ARC (blue line)). Schematic of time line for in vivo bone imaging from 5- to 12-week PI, with graph showing percent change in volumetric bone normalized to 5 week PI. Cre-Hits (n = 5), Cre-Miss (n = 4), and GFP (n = 5), AAV2-Cre Hit versus GFP or Miss (F2,40 = 56.9, p < 0.0001). Error bars are ±SEM. Student’s unpaired t test (d, f). Two-way ANOVA (g). *p < 0.05; **p < 0.01; ***p < 0.001
Fig. 5
Fig. 5
Bone formation correlates with changes in KNDy and DAT ARC neurons. a Heat map of top 25 most significant DEGs in ARC of Esr1fl/fl (n = 3) and Esr1Nkx2.1Cre females (n = 3) (15 weeks). b Volcano plot of data set with highlighted genes (red). Dashed red line represents significance cutoff with adjusted p value < 0.05). c Overlap of DEGs with adjusted p value < 0.05 and |log2 fold change| > 0.6 between ARC from Esr1fl/fl and Esr1Nkx2.1Cre mice (red) with identified ERα agonist-responsive transcripts (white), and with identified markers of AgRP and POMC neurons (grey). d Expression of Esr1, Kiss1, Pdyn, and Slc6a3 measured by qPCR (n = 4–6 per genotype with controls as open boxes and Esr1Nkx2.1Cre females as red boxes; (center line = median; bounds are minimum to maximum). e Representative ISH of Slc6a3 in ARC and confocal image of ARC co-labeled with Slc6a3 reporter (Ai9, tdT), ERα and DAPI. Image scale bars for top and bottom panels = 100 µm. Student’s unpaired t test (d). Error bars are ±SEM. *p < 0.05; **p < 0.01; ***p < 0.001; ****p < 0.0001
Fig. 6
Fig. 6
Deletion of ERα in Kiss1 neurons elicits an increase in bone mass. a Representative μCT images of femoral and cortical bone for Esr1fl/fl (n = 3) and Esr1PomcCre (n = 3) at 22 weeks of age. b Representative images demonstrating loss of ERα (red) in Cre-GFP-expressing Kiss1 neurons stained for either GFP (green) or KISS1 (red) in the female ARC. Scale bars = 25 µm (top panel) and 10 µm (bottom panels). c Photograph of Esr1fl/fl and Esr1KissCre female femurs at 6 weeks of age. d μCT images of the distal femur, L5 vertebrae and cross section of cortical bone at metaphysis in Esr1fl/fl (black) control and Esr1KissCre mutant females (purple) as well as the distal femur from males (grey, 4.5 weeks). %BV/TV for female distal femur controls (n = 6) and mutants (n = 4), for L5 controls (n =  4) and mutants (n = 4), and the cortical thickness at metaphysis for controls (n =  4) and mutants (n = 4). %BV/TV for male distal femur controls (n = 7) and mutants (n = 6) males. e Spleen weights of younger (4–12 weeks) Esr1fl/fl (n = 7) and Esr1KissCre (n = 3) and images of spleen from a control and a mutant female at 21 weeks of age. Representative images of (20×) H&E stained spleens from control and mutant females at 21 weeks. White arrows point to megakaryocytes. f Schematic showing the positive and negative roles of central estrogen signaling in ARCKiss1 neurons on fertility and bone, respectively. Error bars are ±SEM. Unpaired Student’s t test (d, e). **p < 0.01; ***p < 0.001; ****p < 0.0001. Scale bars = 100 μm

References

    1. McDougall KE, et al. Estrogen receptor-alpha dependency of estrogen’s stimulatory action on cancellous bone formation in male mice. Endocrinology. 2003;144:1994–1999. doi: 10.1210/en.2002-0074. - DOI - PubMed
    1. Samuels A, Perry MJ, Goodship AE, Fraser WD, Tobias JH. Is high-dose estrogen-induced osteogenesis in the mouse mediated by an estrogen receptor? Bone. 2000;27:41–46. doi: 10.1016/S8756-3282(00)00289-1. - DOI - PubMed
    1. Perry MJ, Gujra S, Whitworth T, Tobias JH. Tamoxifen stimulates cancellous bone formation in long bones of female mice. Endocrinology. 2005;146:1060–1065. doi: 10.1210/en.2004-1114. - DOI - PubMed
    1. Modder UI, et al. Dose–response of estrogen on bone versus the uterus in ovariectomized mice. Eur. J. Endocrinol. 2004;151:503–510. doi: 10.1530/eje.0.1510503. - DOI - PubMed
    1. Ohlsson C, et al. Estrogen receptor-alpha expression in neuronal cells affects bone mass. Proc. Natl. Acad. Sci. USA. 2012;109:983–988. doi: 10.1073/pnas.1111436109. - DOI - PMC - PubMed

Publication types