. 2019 Jan 11;10(1):161.
doi: 10.1038/s41467-018-08002-2.

Feasible future global scenarios for human life evaluations

Affiliations

Feasible future global scenarios for human life evaluations

Christopher Barrington-Leigh et al. Nat Commun. .

Abstract

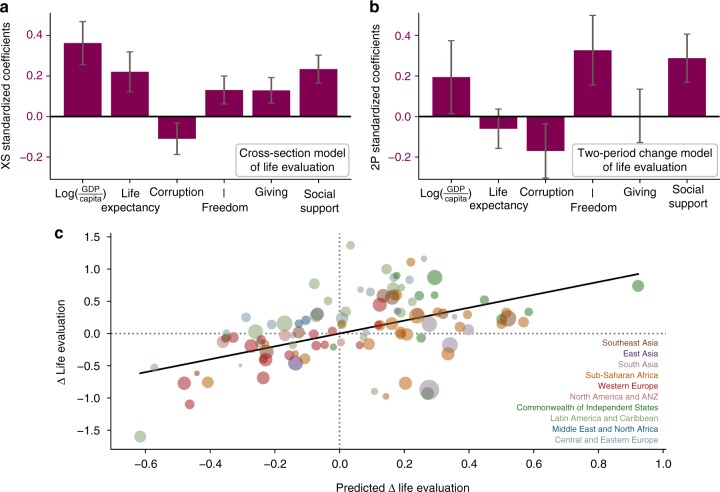
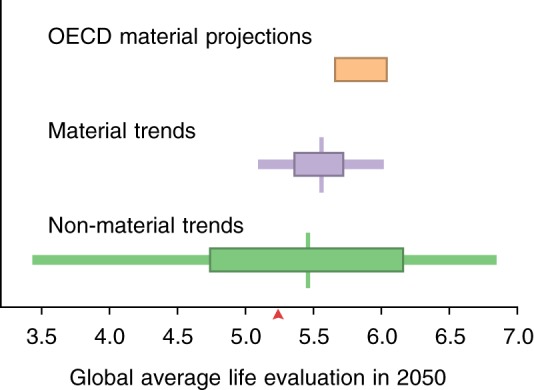
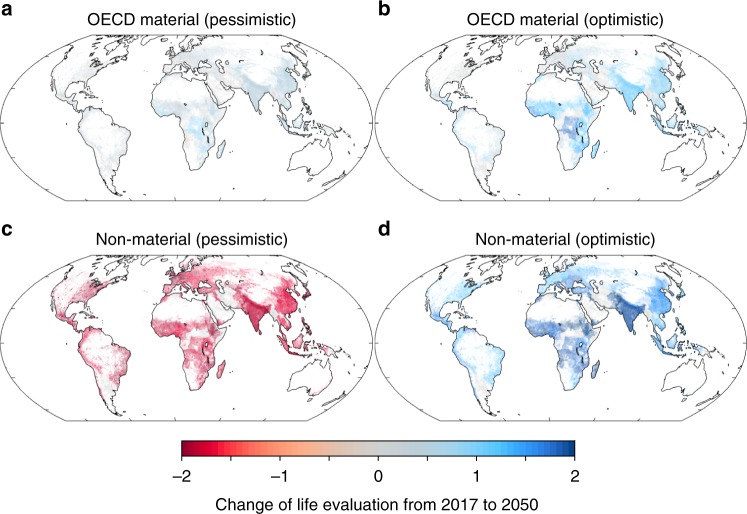
Subjective well-being surveys show large and consistent variation among countries, much of which can be predicted from a small number of social and economic proxy variables. But the degree to which these life evaluations might feasibly change over coming decades, at the global scale, has not previously been estimated. Here, we use observed historical trends in the proxy variables to constrain feasible future projections of self-reported life evaluations to the year 2050. We find that projected effects of macroeconomic variables tend to lead to modest improvements of global average life evaluations. In contrast, scenarios based on non-material variables project future global average life evaluations covering a much wider range, lying anywhere from the top 15% to the bottom 25% of present-day countries. These results highlight the critical role of non-material factors such as social supports, freedoms, and fairness in determining the future of human well-being.


Conflict of interest statement

The authors declare no competing interests.

Figures

Fig. 1
Fig. 1
Predictions of life evaluations from proxy variables. a Six predictor variables are used simultaneously to predict life evaluations in static cross-section between countries (XS). All corresponding country-year observations are used, after removing global year-to-year changes. Effect sizes are shown, with 90% confidence intervals, normalized to standard deviations, in order to compare the estimated coefficients across predictor variables. The strongest predictor is the income variable, but all predictors have significant strength, and their confidence intervals largely overlap. b As in a but for the dynamic, two-period model (2P) which explains changes over time within countries. In the 2P model, confidence intervals are looser, and the income coefficient excludes zero with only ~90% confidence intervals. However, models for annual changes (see Supplementary Information) show similar patterns and have tighter confidence intervals. c The relationship between observed and predicted changes in life evaluation using the 2P model. The changes are the differences in national average life evaluations between 2005–2007 and 2014–2016. Symbol size corresponds to the population size of each country
Fig. 2
Fig. 2
Projected feasible life evaluations in 2050 scenarios. The results of two sets of material scenarios are shown for the year 2050, based on macroeconomic projections (OECD, orange) and recent trends (purple), as well as a set of non-material scenarios based on recent trends (green). The central vertical lines indicate projections based on the median trends, the thick horizontal bar indicates the range based on the 30th to 70th %ile trends, and the thinner horizontal bar indicates the range based on the 10th to 90th %ile trends. Outcomes are calculated with coefficients from the 2P model and are weighted by projected population sizes to aggregate across countries. The red arrow indicates the population-weighted average life evaluation recorded in 2016
Fig. 3
Fig. 3
Geographic distribution of feasible life evaluation changes. Projections for 2050 are for the OECD material growth scenarios (a, b), and scenarios in which the non-material predictor variables change at the 10th and 90th percentile rates of recent observations among all countries (c, d). Coefficients used in the projection are based on the two-period model of life evaluations. The shading on the map is weighted by projected population density

References

    1. Samir KC, Wolfgang L. The human core of the shared socioeconomic pathways: population scenarios by age, sex and level of education for all countries to 2100. Glob. Environ. Change. 2017;42:181–192. doi: 10.1016/j.gloenvcha.2014.06.004. - DOI - PMC - PubMed
    1. Hsiang S, et al. Estimating economic damage from climate change in the United States. Science. 2017;356:1362–1369. doi: 10.1126/science.aal4369. - DOI - PubMed
    1. Diener, E., Oishi, S. & Tay, L. Advances in subjective well-being research. Nat. Hum. Behav. 2, 253-260 (2018). - PubMed
    1. Global Happiness Council. Global Happiness Policy Report (Global Happiness Council, 2018).
    1. Zhang X, Zhang X, Chen X. Happiness in the air: how does a dirty sky affect mental health and subjective well-being? J. Environ. Econ. Manag. 2017;85:81–94. doi: 10.1016/j.jeem.2017.04.001. - DOI - PMC - PubMed

Publication types