. 2019 Jan 11;10(1):176.
doi: 10.1038/s41467-018-08184-9.

Feature-specific prediction errors and surprise across macaque fronto-striatal circuits

Affiliations

Feature-specific prediction errors and surprise across macaque fronto-striatal circuits

Mariann Oemisch et al. Nat Commun. .

Abstract

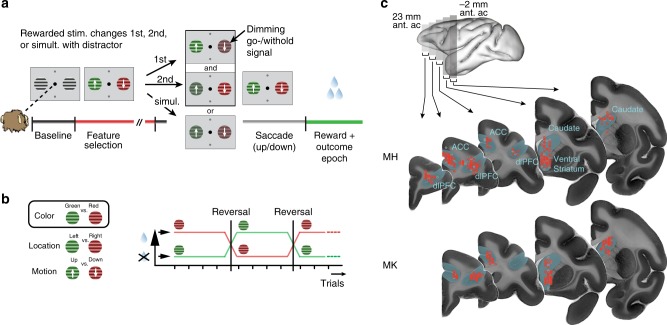
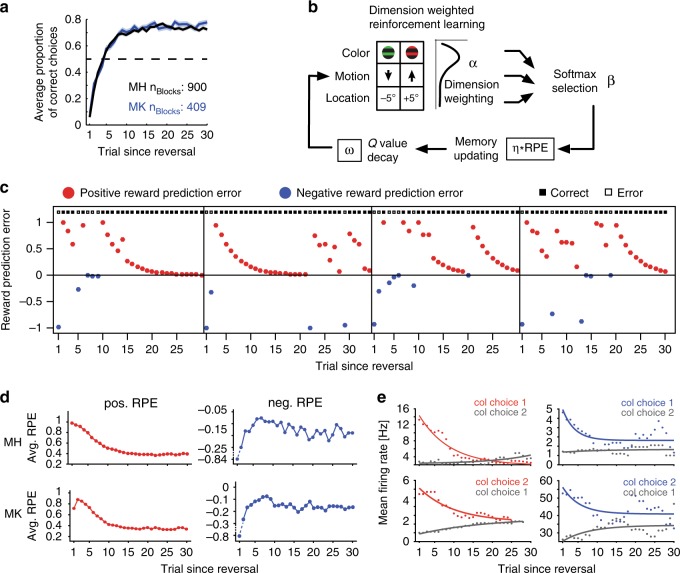
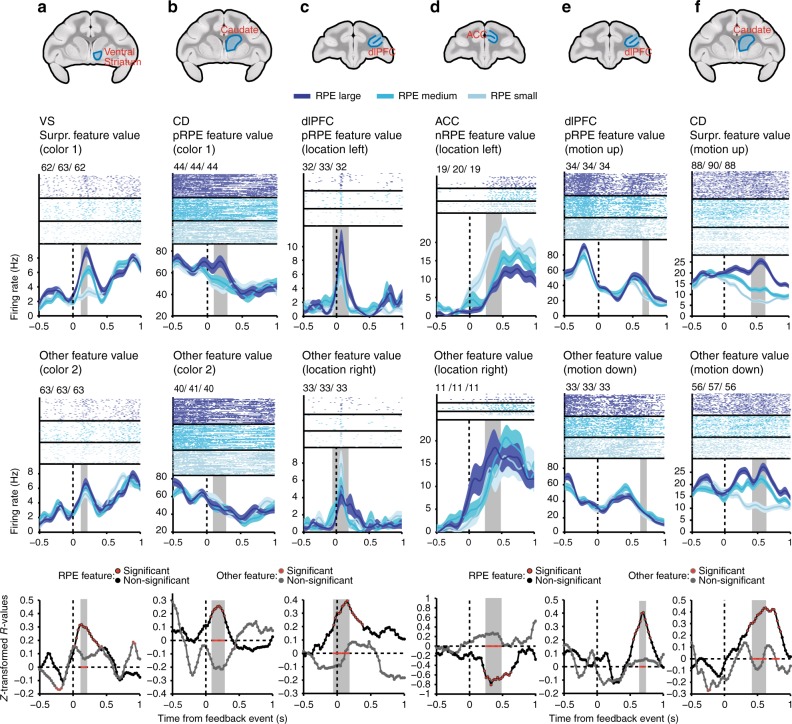
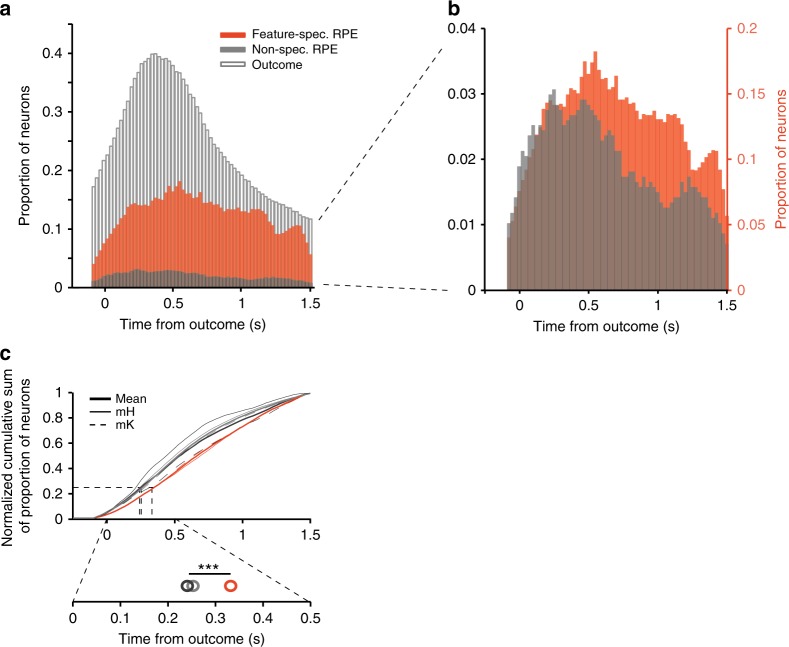
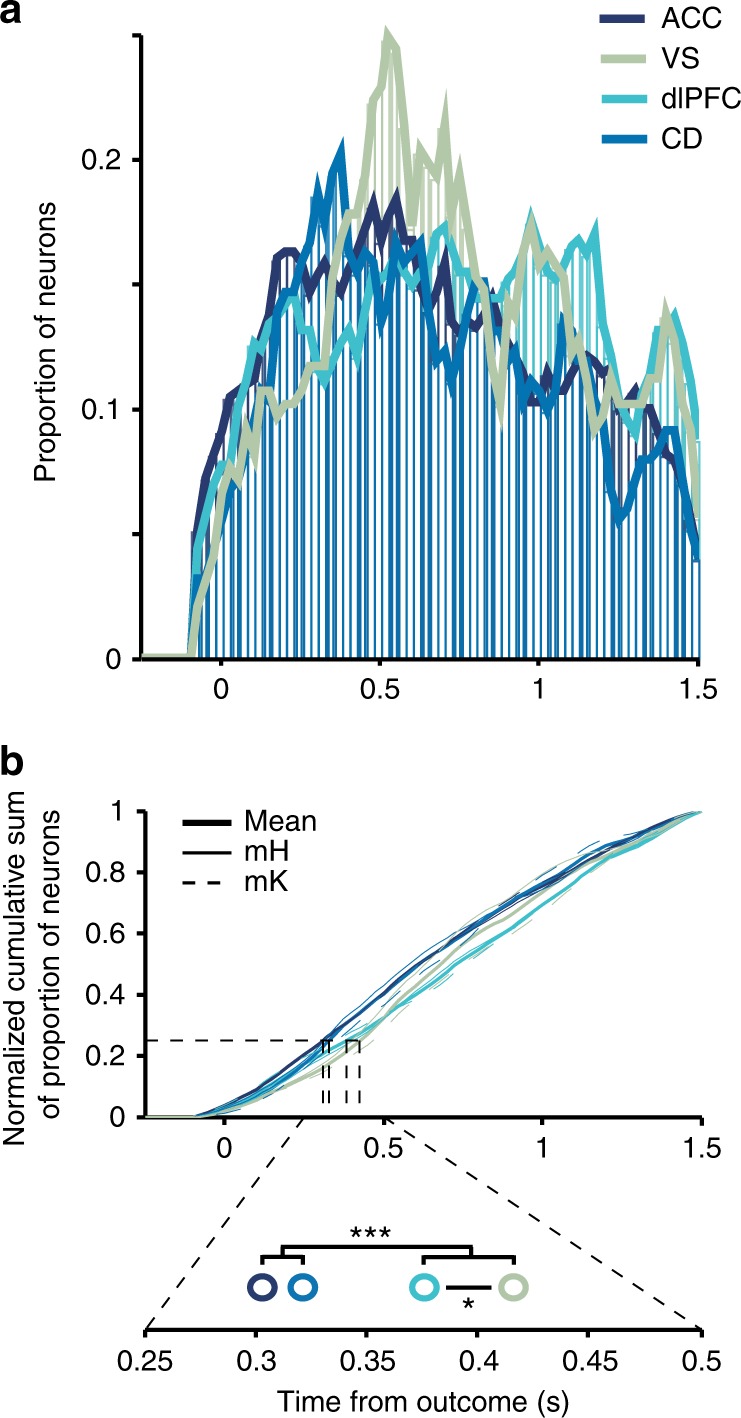
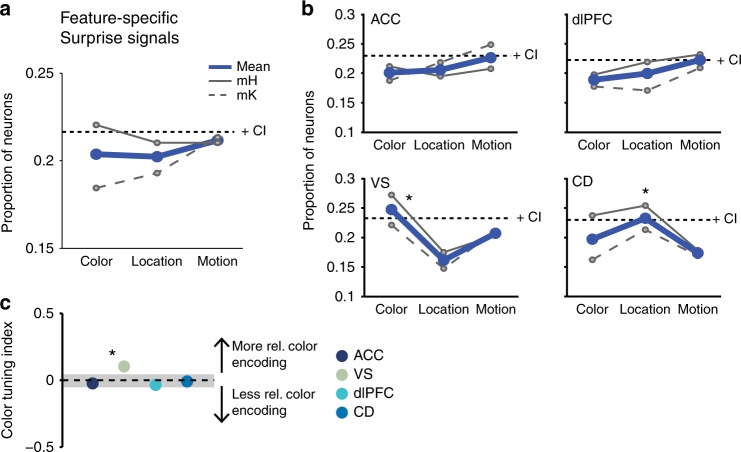
To adjust expectations efficiently, prediction errors need to be associated with the precise features that gave rise to the unexpected outcome, but this credit assignment may be problematic if stimuli differ on multiple dimensions and it is ambiguous which feature dimension caused the outcome. Here, we report a potential solution: neurons in four recorded areas of the anterior fronto-striatal networks encode prediction errors that are specific to feature values of different dimensions of attended multidimensional stimuli. The most ubiquitous prediction error occurred for the reward-relevant dimension. Feature-specific prediction error signals a) emerge on average shortly after non-specific prediction error signals, b) arise earliest in the anterior cingulate cortex and later in dorsolateral prefrontal cortex, caudate and ventral striatum, and c) contribute to feature-based stimulus selection after learning. Thus, a widely-distributed feature-specific eligibility trace may be used to update synaptic weights for improved feature-based attention.


Conflict of interest statement

The authors declare no competing interests.

Figures

Fig. 1
Fig. 1
Feature-based reversal learning task and anatomical recording locations. a Animals are presented with two black/white stimulus gratings to the left and right of a central fixation point. The stimulus gratings then become colored and start moving in opposite directions. Dimming of the stimuli served as Choice/Go signal. At the time of the dimming of the target stimulus the animals had to indicate the motion direction of the target stimulus by making a corresponding up or downward saccade in order to receive a liquid reward. Dimming of the target stimulus occurred either before, after or at the same time as the dimming of the distractor stimulus. b Left: Three features characterize each stimulus—color, location, and motion direction. Only the color feature is directly linked to reward outcome. The task is a deterministic reversal learning task, whereby only one color at a time is rewarded. Right: This reward contingency switches repeatedly and unannounced in a block-design fashion. c Illustration of recording locations relative to stereotaxic zero for monkey H (top) and monkey K (bottom). Neuron locations are collapsed across 5 mm coronal slices indicated by the gray bars on the brain on top. Red circles represent neurons that encoded a feature-specific prediction error, gray circles represent neurons that did not. Ant. ac. refers to anterior of anterior commissure. Imaging data provided by the Duke Center for in vivo microscopy,
Fig. 2
Fig. 2
Task performance and reinforcement learning model-derived RPEs. a Average proportion of correct choices relative to the reversal for monkey H (gray) and monkey K (blue). Shaded error bars represent standard error of the mean (SEM). Numbers of blocks included in the analysis are indicated for both monkeys. b Dimension weighted reinforcement learning model with main parameters alpha, beta, omega, and eta (α, β, ω, and η) for feature weighting, selection noise, decay rate, and learning rate, respectively. c Model-derived reward prediction errors for four example reversal blocks. Positive RPEs are indicated in red, negative RPEs are indicated in blue. Small black filled and white filled squares at the top of each graph indicate correct and error choices, respectively. d Average positive (left) and negative (right) model-derived RPEs across the first 30 trials of a reversal block for monkey H (top) and monkey K (bottom). e Average firing rates of four example neurons in the outcome epoch following color 1 and color 2 choices across trials in a reversal block, in correct trials (left two neurons) and in error trials (right two neurons). These neurons were later identified to encode color-specific positive and negative RPEs, respectively. For visualization purposes only, exponential functions were fit to the data points
Fig. 3
Fig. 3
Example neurons encoding feature-specific RPE signals. For each of six example neurons (af), the spike rasters and spike-density functions are displayed (for visualization purposes only) for prediction error values of three different magnitudes (trials evenly split into RPE large, RPE medium, and RPE small), for the feature (e.g., color 1) for which an RPE was encoded (preferred RPE feature, top row), and for the feature for which an RPE was less or not encoded (e.g., color 2, nonpreferred RPE feature, and middle row). The bottom most row displays the z-transformed R values of the correlation between spike rate and RPE for the two feature values above (solely this last row displays the statistical analyses performed). Black (nonsignificant) or red filled (significant) circles represent z-transformed R values of the correlation between spike rate and RPE for preferred RPE feature trials. Gray (nonsignificant) or red filled (significant) outlines represent z-transformed R values of the correlation between spike rate and RPE for nonpreferred RPE feature trials (Spearman correlation). Red stars indicate those time bins for which the R values between the two feature values differed significantly (Z-test, see Methods, Eq. ( 1)). Gray transparent bars in all plots indicate the time window of RPE encoding. Small numbers at the top left of each subplot containing spike rasters indicate the numbers of trials that were included in the RPE large/RPE medium/RPE small groups, respectively. The title above each column of figures indicates the area that neuron was recorded from as well as the type of feature and RPE signal encoded by that neuron. Anatomical images at the top-most additionally illustrate the recording locations. Shaded error bars represent SEM. Imaging data provided by the Duke Center for in vivo microscopy,
Fig. 4
Fig. 4
Temporal profile of feature-specific RPE, nonspecific RPE and outcome signals. a Histogram of the proportion of units encoding feature-specific RPEs, nonspecific RPEs and outcome in time, combined across both monkeys. For each neuron, all time bins for which an RPE/outcome was encoded are included (nfeat-spec = 774; nnon-spec = 167). b Displays the same as (a) for nonspecific and feature-specific RPE encoding, but zoomed in and scaled similarly to enhance comparison of the two RPE types. c Normalized cumulative sums of the histograms in (a). Top: Thick lines represent the mean across both monkeys, while thin continuous lines represent cumulative sums of monkey H, and thin dotted lines represent cumulative sums of monkey K. The cumulative sum of feature-specific RPEs differed significantly from those of nonspecific RPEs and outcome (Kolmogorov–Smirnoff test, Bonferroni–Holm multiple-comparison correction; both p < .001). Bottom: Magnification of the cumulative sums around the 25% window. Open circles represent the time points at which 25% of the respective signal is encoded. The horizontal bar with three asterisks indicates that the 25% time point of feature-specific RPEs differs significantly from those of nonspecific RPEs and outcome (randomization procedure, both p < 0.001)
Fig. 5
Fig. 5
Latency comparison of feature-specific RPE encoding across areas. a Histogram of the proportion of feature-specific RPE encoding units in ACC, VS, dlPFC, and CD combined in time across both monkeys. For each neuron, all time bins for which an RPE was encoded are included (nACC = 256; nVS = 132; ndlPFC = 234; nCD = 152). To enhance visualization of the four histograms lines representing the outlines of each histogram are added. b Normalized cumulative sums of the histograms in (a). Top: Thick lines represent the mean across both monkeys, while thin continuous lines represent cumulative sums of monkey H, and thin dotted lines represent cumulative sums of monkey K. The cumulative sums of all areas except for ACC and CD differed significantly from each other (Kolmogorov–Smirnoff test, Bonferroni–Holm multiple-comparison correction; pACC-CD = 0.128, all other p < 0.01). Bottom: Magnification of the cumulative sums around the 25% window. Open circles represent the time points at which 25% of feature-specific RPEs are encoded in the four areas. One asterisk indicates p < 0.05; three asterisks indicate p < 0.001 (randomization procedure). Hedges’ g effect sizes for the latency differences: dACC-dlPFC = −0.18, dACC-CD = −0.02, dACC-VS = −0.16, ddlPFC-CD = 0.17, ddlPFC-VS = 0.03, dCD-VS = −0.14
Fig. 6
Fig. 6
Prevalence of feature-specific negative and positive RPE encoding. Shown are proportions of neurons that encode a color-, location-, or motion-specific negative RPE signal either combined across areas (a) or split by areas (b). Thick blue lines represent averages across both monkeys. Thin continuous gray lines represent data from monkey H, thin dashed gray lines represent data from monkey K. An asterisk indicates p ≤ 0.05 using a one-sided bootstrap procedure that randomized the feature labels. Dotted lines indicate upper confidence interval. Gray bars indicate chance level proportion at 0.05. c Color-tuning indices for each area computed according to Eq. (2). Gray bar represents upper and lower bootstrap confidence interval. An asterisk indicates p < 0.05 by falling outside of the specified confidence interval. df equivalent conventions to (ac) for feature-specific positive RPE encoding
Fig. 7
Fig. 7
Prevalence of feature-specific surprise RPE encoding. Conventions are equivalent to Fig. 6 for feature-specific unsigned RPEs
Fig. 8
Fig. 8
Cell-type classification of RPE units. ae for ACC/dlPFC units. a Waveforms of all highly isolated single units recorded, identified as putative interneurons (narrow-spiking, red), putative pyramidal cells (broad-spiking, blue). b Histogram of the first component of the PCA using peak-to-trough duration and time to repolarization to separate neurons into putative interneurons and putative pyramidal cells. c Proportion of nonspecific RPE encoding neurons identified as narrow- (red) or broad-spiking (blue), in addition to nonsingle units (white). d Proportion of feature-specific RPE encoding neurons identified as narrow- or broad-spiking. e Ratio of narrow to broad-spiking neurons identified in the population, for nonspecific and feature-specific RPE encoding neurons. Black asterisk indicates p < 0.05 (chi-square test). fj for CD/VS units. f Waveforms of all highly isolated single units recorded, identified as putative interneurons (red) or putative medium spiny neurons (MSNs, blue), or unidentified (black). g Histogram of the first component of the PCA using peak width and initial slope of valley decay (ISVD) to separate neurons into putative interneurons and MSNs. Inset shows the scatterplot of peak width versus ISVD across neurons. h Proportion of nonspecific RPE encoding neurons identified as putative interneurons or MSNs, or unidentified (gray), in addition to nonsingle units (white). i Proportion of feature-specific RPE encoding neurons identified as putative interneurons or MSNs or unidentified. j Ratio of putative interneuron/MSN in the population, for nonspecific and feature-specific RPE encoding neurons
Fig. 9
Fig. 9
Firing rate increases at color onset following low- vs. high-RPE trials. a, c, e Average normalized firing rate changes from pre to postcolor onset in trial n + 1 across neurons encoding color-specific negative RPE (a, n = 114), positive RPE (c, n = 140) and surprise (unsigned RPE) (e, n = 260). Rate changes were computed according to Eq. (13) in Supplementary Methods and normalized to range from −1 to 1. Averages were computed separately for the 25% of trials with the greatest prediction errors and for the 25% of trials with the lowest prediction error, in cyan following preferred color choices and in gray following nonpreferred color choices. Circles indicate means for monkey H, squares indicate means for monkey K. Error bars indicate SEM. b, d, f Mean differences in normalized rate changes following low vs. high RPEs for the preferred RPE color (cyan in a, b) for each area across color-specific negative RPE (b) positive RPE (d), and unsigned RPE (f) encoding neurons. Black asterisks indicate significant differences in rate changes following low vs. high RPEs (paired t test, p < 0.05)

References

    1. Farashahi S, Rowe K, Aslami Z, Lee D, Soltani A. Feature-based learning improves adaptability without compromising precision. Nat. Commun. 2017;8:1768. doi: 10.1038/s41467-017-01874-w. - DOI - PMC - PubMed
    1. Hikosaka, O., Ghazizadeh, A., Griggs, W. & Amita, H. Parallel basal ganglia circuits for decision making. J. Neural Transm. 1–15 (2017). 10.1007/s00702-017-1691-1 - PubMed
    1. Leong YC, Radulescu A, Daniel R, DeWoskin V, Niv Y. Dynamic Interaction between reinforcement learning and attention in multidimensional environments. Neuron. 2017;93:451–463. doi: 10.1016/j.neuron.2016.12.040. - DOI - PMC - PubMed
    1. Niv Y, et al. Reinforcement learning in multidimensional environments relies on attention mechanisms. J. Neurosci. 2015;35:8145–8157. doi: 10.1523/JNEUROSCI.2978-14.2015. - DOI - PMC - PubMed
    1. Sutton, R. S. & Barto, A. G. Reinforcement Learning: An Introduction. Vol. 135. Cambridge: MIT Press (1998).

Publication types