Review
. 2019 Aug;24(8):1112-1134.
doi: 10.1038/s41380-018-0342-8. Epub 2019 Jan 11.

Tau PET imaging in neurodegenerative tauopathies-still a challenge

Affiliations
Review

Tau PET imaging in neurodegenerative tauopathies-still a challenge

Antoine Leuzy et al. Mol Psychiatry. 2019 Aug.

Abstract

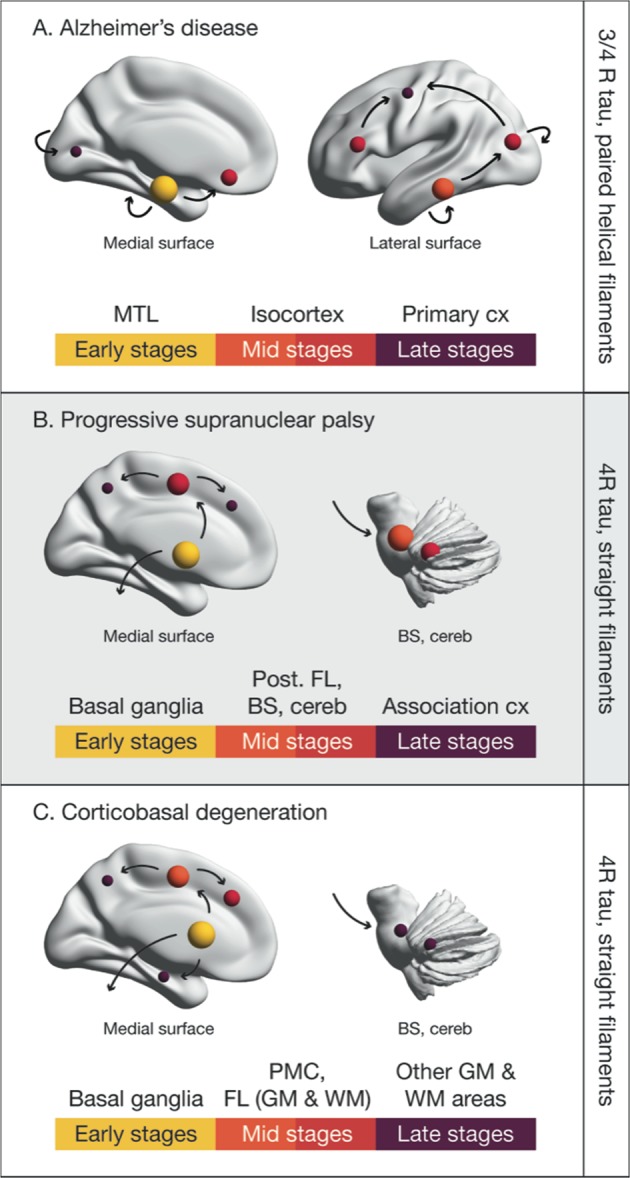
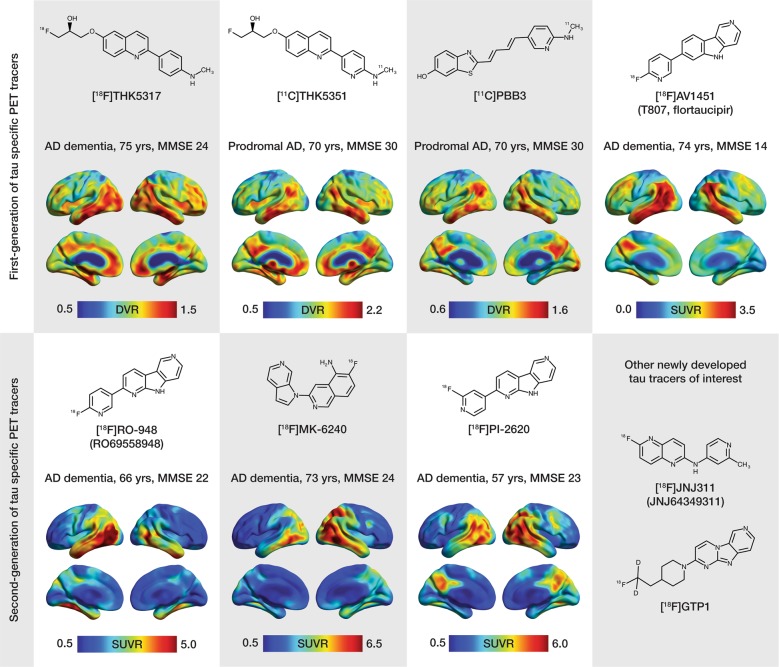
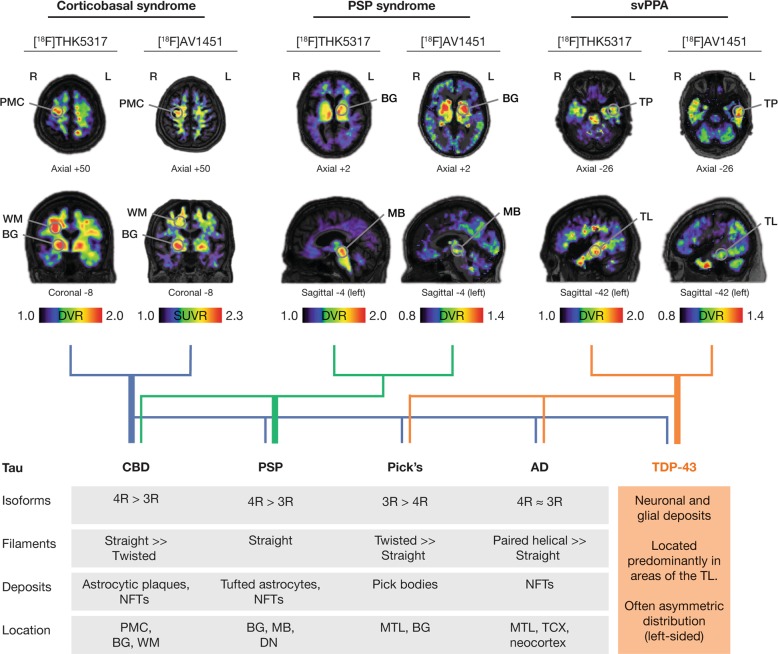
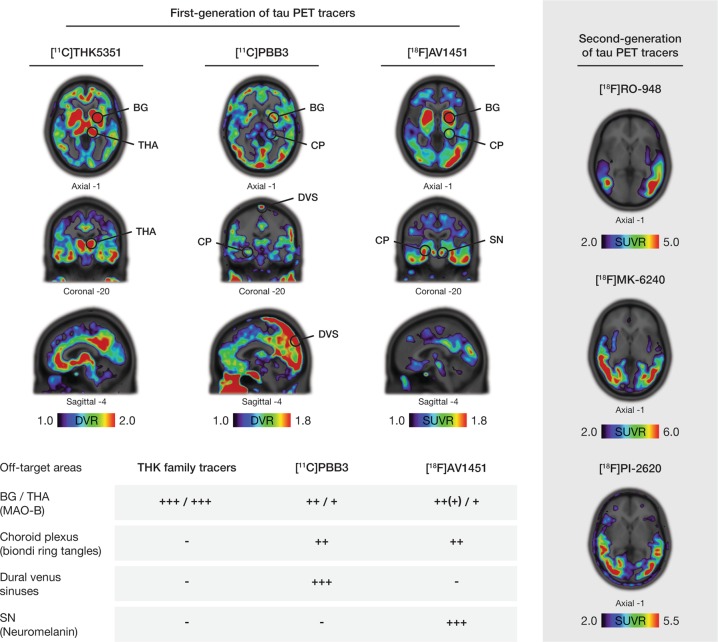
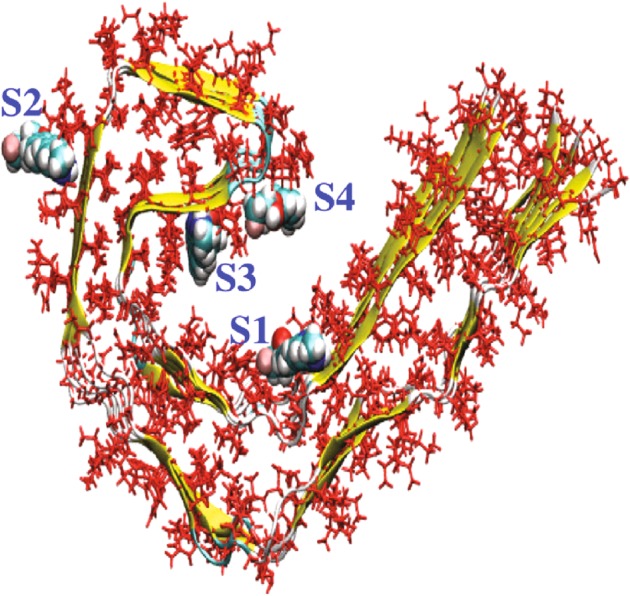
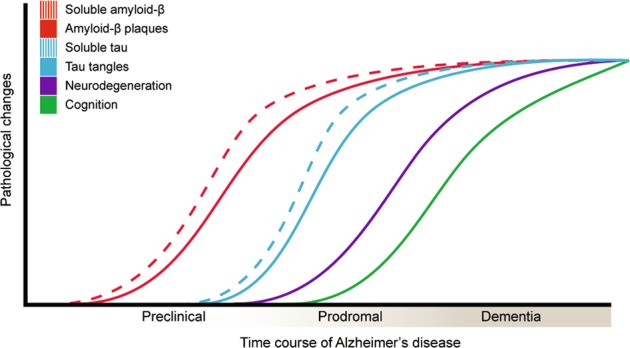
The accumulation of pathological misfolded tau is a feature common to a collective of neurodegenerative disorders known as tauopathies, of which Alzheimer's disease (AD) is the most common. Related tauopathies include progressive supranuclear palsy (PSP), corticobasal syndrome (CBS), Down's syndrome (DS), Parkinson's disease (PD), and dementia with Lewy bodies (DLB). Investigation of the role of tau pathology in the onset and progression of these disorders is now possible due the recent advent of tau-specific ligands for use with positron emission tomography (PET), including first- (e.g., [18F]THK5317, [18F]THK5351, [18F]AV1451, and [11C]PBB3) and second-generation compounds [namely [18F]MK-6240, [18F]RO-948 (previously referred to as [18F]RO69558948), [18F]PI-2620, [18F]GTP1, [18F]PM-PBB3, and [18F]JNJ64349311 ([18F]JNJ311) and its derivative [18F]JNJ-067)]. In this review we describe and discuss findings from in vitro and in vivo studies using both initial and new tau ligands, including their relation to biomarkers for amyloid-β and neurodegeneration, and cognitive findings. Lastly, methodological considerations for the quantification of in vivo ligand binding are addressed, along with potential future applications of tau PET, including therapeutic trials.


Conflict of interest statement

The authors declare that they have no conflict of interest.

Figures

Fig. 1
Fig. 1
Spreading schemes for tau pathology in Alzheimer’s disease (AD), progressive supranuclear palsy (PSP), and corticobasal degeneration (CBD). The color coding and the size of the spheres distinguishes between brain areas affected at early (yellow; large size), middle (shades of red; mid size) and late (purple; small size) stages of tau propagation. The scheme for AD is adapted from Braak and Braak [60]. The scheme for PSP is adapted from Williams et al. [18]. The scheme for CBD was inspired by the neuropathological studies performed by Forman et al. [19], Kouri et al. [20], and Ling et al. [21]. The label at the right side of each panel indicates the predominant tau isoform affected and the type of tau fibrils formed in AD, PSP, or CBD. For a more detailed description of the neuropathological findings, please refer to Fig. 4. BS brainstem, cereb cerebellum, cx cortex, FL frontal lobe, GM gray matter, MTL medial temporal lobe, PMC primary motor cortex, post. FL posterior frontal lobe, WM white matter
Fig. 2
Fig. 2
Chemical structures and representative uptake images in amyloid-β-positive Alzheimer’s disease (AD) patients using selected first- (upper portion of the figure) and second- (lower portion of the figure) generation tau PET tracers. The characteristics in terms of clinical research diagnosis, age and mini mental-state examination (MMSE) scores are presented for each patient above the respective image. For the creation of parametric images for all tracers, areas of the cerebellar cortex were used as reference. The [18F]THK5317, [11C]THK5351 and [11C]PBB3 images derive from studies performed at Karolinska Institutet, Center for Alzheimer Research [35, 153]. The [18F]AV1451 image is courtesy of the Alzheimer’s disease neuroimaging initiative (ADNI). The [18F]RO-948 image is courtesy of Ruben Smith and Oskar Hansson (Lund University, Lund, Sweden). The [18F]MK-6240 and the [18F]PI-2620 images are courtesy of Vincent Doré, Christopher Rowe and Victor Villemagne (University of Melbourne, Victoria, Australia) and Andrew Stephens and Mathias Berndt (Piramal Imaging GmbH, Berlin, Germany), respectively. Different scales were used to better illustrate the regional distribution pattern of binding for each tracer, due to between-patient differences as well as due to the different PET acquisition parameters and quantification methods that were applied for each tracer. Though direct comparison is complicated by these differences, one can observe the preferential binding of the first- and second-generation tracers in AD-relevant areas of the temporal lobes, and the broader dynamic range among second-generation tracers. DVR distribution volume ratio, SUVR standardized uptake value ratio
Fig. 3
Fig. 3
Representative [18F]THK5317 and [18F]AV1451 images of amyloid-β-negative patients with clinical diagnoses of corticobasal syndrome, progressive supranuclear palsy (PSP) syndrome, and a semantic variant of primary progressive aphasia (svPPA) (upper portion of the figure), and a tree diagram (mid portion of the figure) illustrating the poor correlation between the clinical diagnoses of corticobasal syndrome, PSP syndrome, and svPPA with pathological confirmation of the presence of tau [black font; corticobasal degeneration (CBD), PSP, Pick’s disease, Alzheimer’s disease (AD)], and TDP-43 (orange font) pathologies. The areas with high-tracer uptake are indicated with circles. The thickness of the strings (OR lines) in the diagram illustrates the approximate strength of the clinicopathological correlations [156, 237]. The lower portion of the figure shows the neuropathological and biochemical characteristics of tau pathology seen across a number of tauopathies, as well as some typical neuropathological characteristics of TDP-43 pathology. Of note, different patients were scanned for each tau PET tracer, although one can observe apparent similarities in the regional distribution of tracer uptake for [18F]THK5317 and [18F]AV1451 in the patients with the same clinical diagnosis. The patients with a clinical diagnosis of corticobasal and PSP syndromes show high binding of both tracers in relevant areas, in agreement with the expected regional distribution of CBD and PSP pathologies, respectively. Interestingly, high binding with both tracers is observed even in patients with a clinical diagnosis of svPPA, a syndrome which is not primarily associated with the presence of tau, but rather TDP-43 pathology. For the creation of parametric images for all tracers, areas of the cerebellar cortex were used as reference. The [18F]THK5317 images derive from studies performed at Karolinska Institutet, Center for Alzheimer Research [35]. The [18F]AV1451 images of the patient with corticobasal syndrome is courtesy of Chul Hyoung Lyoo (Yonsei University College of Medicine, Seoul, South Korea) [80], while the [18F]AV1451 images of the patients with PSP syndrome and svPPA are courtesy of Simon P. Jones and James Rowe (University of Cambridge, Cambridge, UK) [82, 138]. Different scales were used to better illustrate the regional distribution pattern of binding for each tracer, due to between-patient differences as well as due to the different PET acquisition parameters and quantification that were applied for each tracer or even within the same tracer between different laboratories for [18F]AV1451. BG basal ganglia, DN dentate nucleus, DVR distribution volume ratio, MB midbrain, PMC primary motor cortex, SUVR standardized uptake value ratio, TL temporal lobe, TP temporal pole, TCX temporal cortex, WM white matter
Fig. 4
Fig. 4
Off-target binding of selected first- (left portion of the figure) and second (right portion of the figure) -generation tau PET ligands. Images are taken from amyloid-β-positive Alzheimer’s disease (AD) patients; research clinical diagnosis, age, and mini-mental state examination results are as follows: [18F]THK5351, prodromal AD, 70, 30; (Karolinska Institutet, Center for Alzheimer Research); [35] [11C]PBB3 prodromal AD, 53, 27 (Karolinska Institutet, Center for Alzheimer Research); [153] [18F]AV1451, AD dementia, 79, 22 (image courtesy of ADNI); [18F]RO-948, AD dementia, 66, 22 (image courtesy of Oskar Hansson and the Swedish BioFINDER study); [18F]MK-6240, AD dementia, 73, 24 and [18F]PI-2620, AD dementia, 57, 23 (images courtesy of Christopher Rowe and Victor Villemagne). The main areas of known off-target binding for the second-generation tau tracers are marked with circles. The load of this off-target binding across the different tracers is graded in a semiquantitative manner in a table in the lower portion of the figure. Specific non-tau targets for this binding have been reported as briefly named in parentheses and illustrated in detail in Table 1. The wider dynamic range of the second-generation tau tracers can be seen as well as the lower binding in the MAO-B rich basal ganglia (BG) and thalamus (THA). Different scales were used to better illustrate the regional distribution pattern of binding for each tracer, due to between-patient differences as well as due to the different PET acquisition parameters and quantification that were applied for each tracer. Other reported off-target binding areas for the second-generation tau tracers are not presented in this figure [27, 29]. Areas of the cerebellar cortex were used as reference for creating parametric images for all the tracers. CP choroid plexus, DVS dural venous sinuses, SN substantia nigra, BG basal ganglia, DN dentate nucleus, DVR distribution volume ratio, MB midbrain, NFTs neurofibrillary tangles, PMC primary motor cortex, R repeats of the microtubule-binding domain, SUVR standardized uptake value ratio, TL temporal lobe, TP temporal pole, TCX temporal cortex, WM white matter
Fig. 5
Fig. 5
Representation of a tau protofibril, showing four high-affinity binding sites (core sites: 1, 3, and 4; surface site, 2) for tau PET ligands, as determined via in silico modeling. With the exception of [18F]T808, all the studied tracers ([18F]AV1451, [18F]FDDNP, [11C]PBB3, [18F]THK5105, [18F]THK523, [18F]THK5351, [18F]THK5117, [18F]MK-6240, [18F]RO-948, and [18F]JNJ311) have shown significant binding to these four sites. On the basis of molecular docking scores, however, tracers such as [18F]FDDNP, [18F]THK5351, [18F]RO6955, and [18F]MK-6240 bind preferentially to the core sites, while [11C]PBB3 and [18F]THK523 bind preferentially to site 2. Certain ligands, moreover, such as [18F]THK5317 and [18F]JNJ311, show similar binding affinities to several sites. Adapted with permission from American Chemical Society Publications, Murugan et al. [151]. (ACS Chem Neurosci. 2018. Copyright 2018)
Fig. 6
Fig. 6
Hypothetical time course of pathological changes in Alzheimer’s disease (AD), in which biomarkers for amyloid-β become abnormal [cerebrospinal fluid (CSF) amyloid-β1–42 preceding PET], followed by abnormal tau (CSF p-tau preceding PET), neurodegeneration, and cognitive decline. Adapted with permission from Jack et al. [182] and 2013 [172], Nordberg [238], and McDade and Bateman [235]

References

    1. Buee L, Bussiere T, Buee-Scherrer V, Delacourte A, Hof PR. Tau protein isoforms, phosphorylation and role in neurodegenerative disorders. Brain Res Brain Res Rev. 2000;33:95–130. - PubMed
    1. Maas T, Eidenmuller J, Brandt R. Interaction of tau with the neural membrane cortex is regulated by phosphorylation at sites that are modified in paired helical filaments. J Biol Chem. 2000;275:15733–40. - PubMed
    1. Hernandez F, Avila J. Tauopathies. Cell Mol Life Sci. 2007;64:2219–33. - PMC - PubMed
    1. Arima K. Ultrastructural characteristics of tau filaments in tauopathies: immuno-electron microscopic demonstration of tau filaments in tauopathies. Neuropathology. 2006;26:475–83. - PubMed
    1. Martin L, Latypova X, Terro F. Post-translational modifications of tau protein: implications for Alzheimer’s disease. Neurochem Int. 2011;58:458–71. - PubMed

Publication types