. 2019 Jan 11;9(1):62.
doi: 10.1038/s41598-018-37303-1.

A Nervous System-Specific Model of Creatine Transporter Deficiency Recapitulates the Cognitive Endophenotype of the Disease: a Longitudinal Study

Affiliations

A Nervous System-Specific Model of Creatine Transporter Deficiency Recapitulates the Cognitive Endophenotype of the Disease: a Longitudinal Study

Angelo Molinaro et al. Sci Rep. .

Abstract

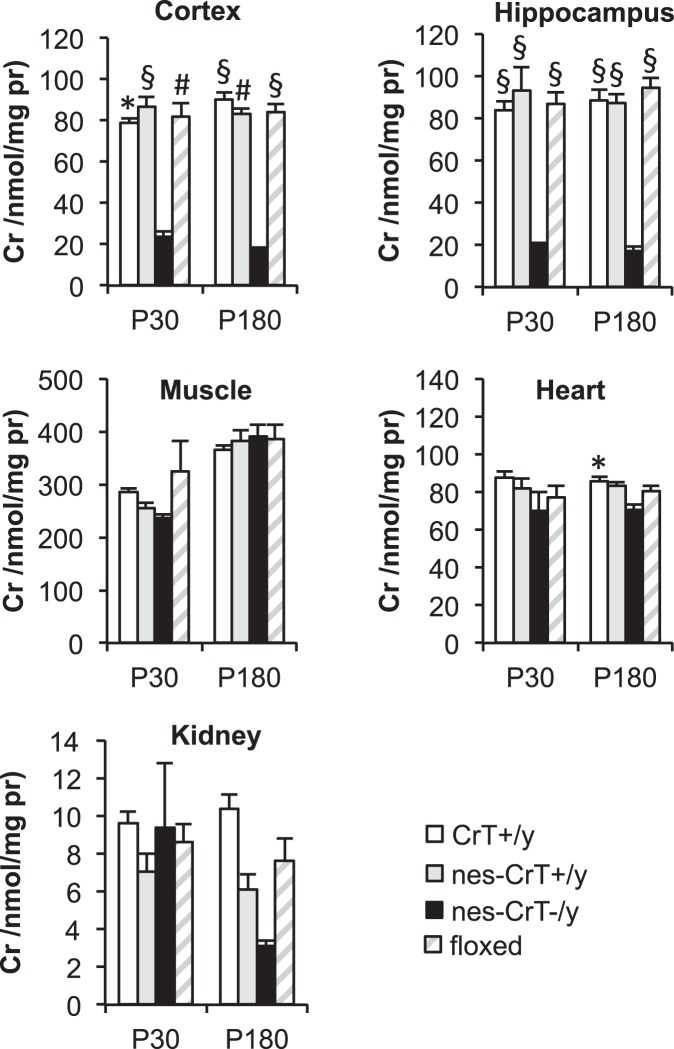
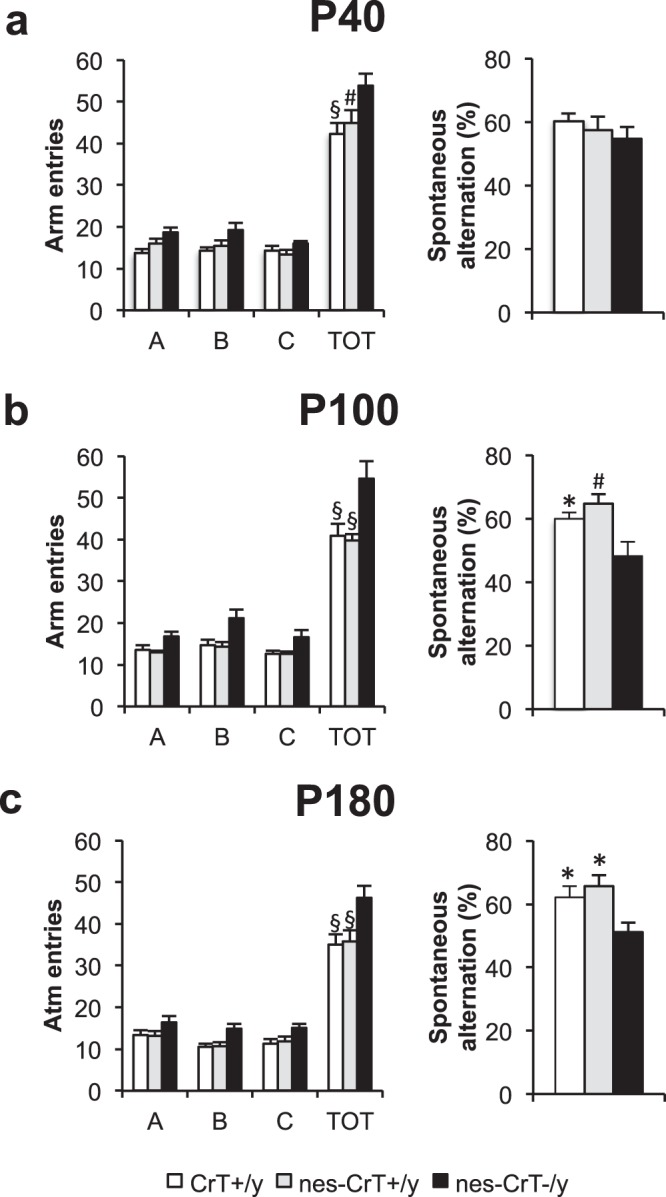
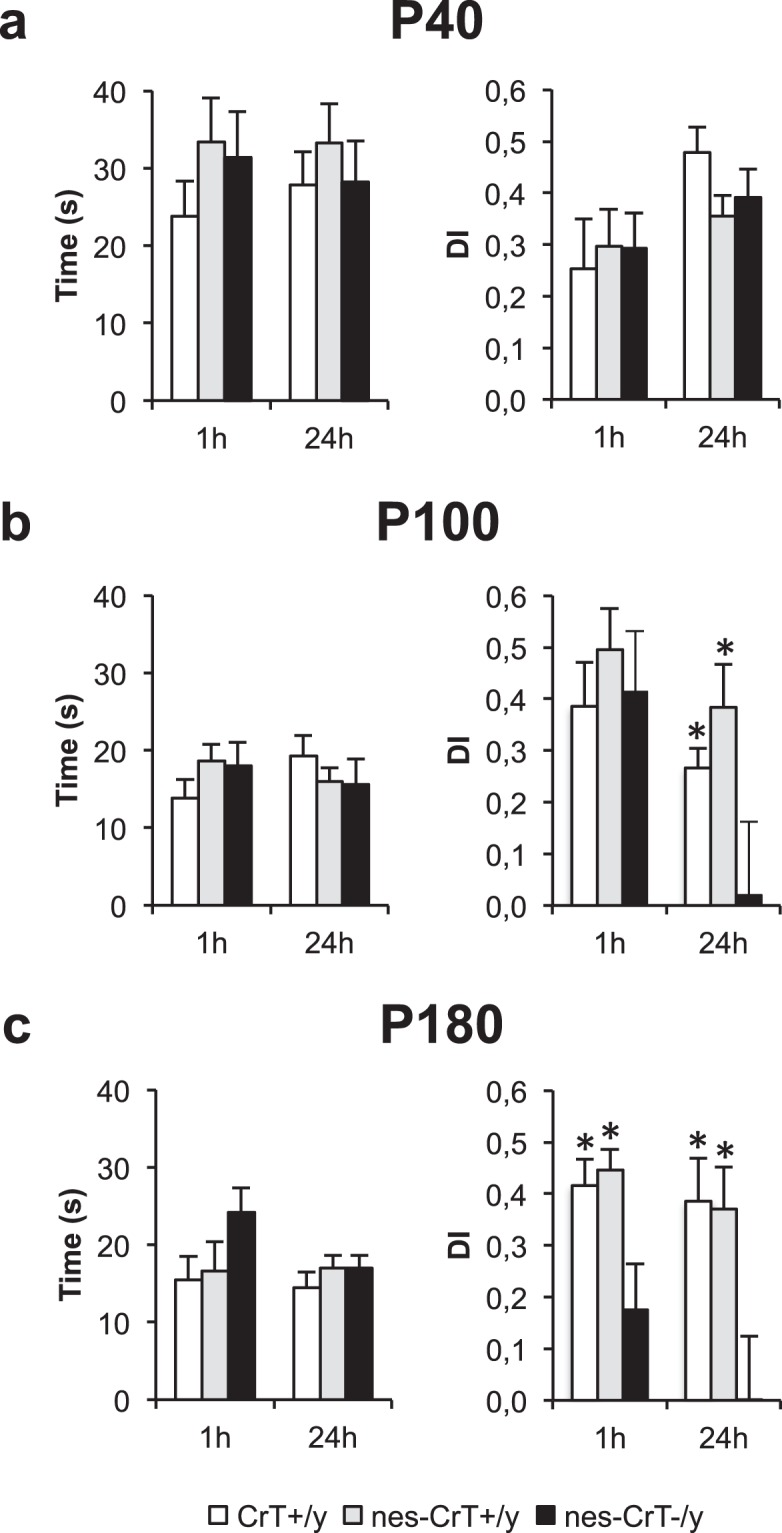
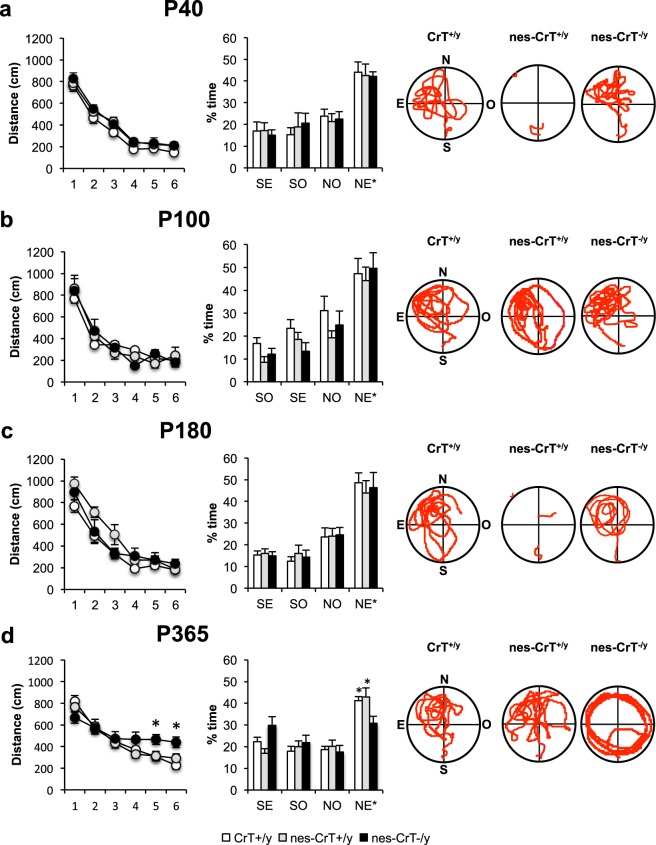
Mutations in creatine (Cr) transporter (CrT) gene lead to cerebral creatine deficiency syndrome-1 (CTD), an orphan neurodevelopmental disorder presenting with brain Cr deficiency, intellectual disability, seizures, movement and autistic-like behavioral disturbances, language and speech impairment. We have recently generated a murine model of CTD obtained by ubiquitous deletion of 5-7 exons in the CrT gene. These mice showed a marked Cr depletion, associated to early and progressive cognitive impairment, and autistic-like defects, thus resembling the key features of human CTD. Given the importance of extraneural dysfunctions in neurodevelopmental disorders, here we analyzed the specific role of neural Cr in the CTD phenotype. We induced the conditional deletion of Slc6a8 gene in neuronal and glial cells by crossing CrT floxed mice with the Nestin::Cre recombinase Tg (Nes-cre) 1Kln mouse. We report that nervous system-specific Cr depletion leads to a progressive cognitive regression starting in the adult age. No autistic-like features, including repetitive and stereotyped movements, routines and rituals, are present in this model. These results indicate that Cr depletion in the nervous system is a pivotal cause of the CTD pathological phenotype, in particular with regard to the cognitive domain, but extraneural actors also play a role.


Conflict of interest statement

The authors declare no competing interests.

Figures

Figure 1
Figure 1
Histograms show Cr levels in CrT+/y, nes-CrT+/y, nes-CrT−/y and CrTfl/y animals in brain and peripheral tissues at P30 and P180 (n = 4 per tissue for all groups). Cr levels have been measured by GC/MS. At both ages tested, a reduction of Cr content was evident in the cerebral cortex (Two Way RM ANOVA on rank transformed data, genotype x tissue interaction, P30: F(12,48) = 3.452, p < 0.001; P180: F(12,48) = 3.609, p < 0.001; post hoc Holm-Sidak method, P30: p < 0.05 vs. CrT+/y, p < 0.001 vs. nes-CrT+/y, p < 0.01 vs. CrTfl/y; P180: p < 0.001 vs. CrT+/y, p < 0.01 vs. nes-CrT+/y, p < 0.001 vs. CrTfl/y) and the hippocampus of nes-CrT−/y mice (p < 0.001 for all comparisons at both ages). Muscle (Two Way RM ANOVA on rank transformed data, post hoc Holm-Sidak method; P30: p = 0.890 vs. CrT+/y, p = 0.965 vs. nes-CrT+/y, p = 0.880 vs. CrTfl/y; P180: p = 0.985 vs. CrT+/y, p = 0.964 vs. nes-CrT+/y, p = 0.994 vs. CrTfl/y), heart (P30: p = 0.257 vs. CrT+/y, p = 0.625 vs. nes-CrT+/y, p = 0.969 vs. CrTfl/y; P180: p = 0.109 vs. nes-CrT+/y, p = 0.305 vs. CrTfl/y) and kidney (P30: p = 0.991 vs. CrT+/y, p = 0.971 vs. nes-CrT+/y, p = 0.937 vs. CrTfl/y; P180: p = 0.214 vs. CrT+/y, p = 0.742 vs. nes-CrT+/y, p = 0.584 vs. CrTfl/y) of mutant animals were preserved from Cr depletion, with the exception of the heart at P180 showing slightly decreased Cr levels with respect to CrT+/y mice (p < 0.05). In addition, a Three Way ANOVA on rank transformed data analysis revealed no difference for the age factor (p = 0.301, F(1,120) = 1.080). Symbols refer to post-hoc Holm Sidak comparisons between nes-CrT−/y mice and the genotype corresponding to the column on which the symbol is located: *p < 0.05, #p < 0.01, §p < 0.001. Error bars, s.e.m.
Figure 2
Figure 2
At all ages tested, an effect of genotype (Two-Way ANOVA, p < 0.001, P40: F(2,100) = 9.791, P100: F(2,100) = 16.886, P180: F(2,84) = 10.595) and an effect of arm level (Two-Way ANOVA, p < 0.001, P40: F(3,100) = 221.487, P100: F(3,100) = 203.358, P180: F(3,84) = 158.430) were detected for the number of arm entries. A post hoc Holm-Sidak method revealed an higher number of total entries (TOT) scored for nes-CrT−/y mice (post hoc Holm-Sidak method, P40: p < 0.001 vs. CrT+/y, p < 0.01 vs. nes-CrT+/y; P100 and P180: p < 0.001 for both comparisons; Fig. 3a–c left side). In contrast, no difference was found in the number of entries in the single arms of the maze (A, B, C; Two-Way ANOVA, post hoc Holm-Sidak method), excluding a specific bias in arm choice. No difference in the Y maze performance was present among the three groups tested at P40 (CrT+/y, n = 13, nes-CrT+/y, n = 9, nes-CrT−/y, n = 6; One Way ANOVA, p = 0.417, F(2,25) = 0.906, panel a right side). In contrast, spontaneous alternation rate was significantly lower in nes-CrT–/y mice compared to that recorded for CrT+/y animals and nes-CrT+/y littermates at P100 (One Way ANOVA, p < 0.01, F(2,25) = 6.599, post hoc Holm-Sidak method, p < 0.05 vs. CrT+/y, p < 0.01 vs. nes-CrT+/y; panel b right side) and P180 (CrT+/y, n = 9, nes-CrT+/y, n = 9, nes-CrT−/y, n = 6; One Way ANOVA, p < 0.05, F(2,21) = 4.766, post hoc Holm-Sidak method, p < 0.05 for both comparisons; panel c right side). Symbols refer to post-hoc Holm Sidak comparisons between nes-CrT−/y mice and the genotype corresponding to the column on which the symbol is located: *p < 0.05, #p < 0.01. Error bars, s.e.m.
Figure 3
Figure 3
Left, diagrams describe total time of object exploration during the testing phase. (a,b,c) No difference was present among the different groups at all ages tested (One-Way ANOVA, P40: p = 0.372, F(2,22) = 1.036 for 1 h and p = 0.686, F(2,18) = 0.384 for 24 h; P100: p = 0.309, F(2,19) = 1.250 for 1 h and p = 0.531, F(2,21) = 0.653 for 24 h; P180: p = 0.194, F(2,19) = 1.792 for 1 h and p = 0.526, F(2,22) = 0.661 for 24 h). Right, histograms display object discrimination indexes (DIs) of CrT+/y, nes-CrT+/y and nes-CrT−/y during the testing phase performed after a delay of 1 and 24 h at different ages. (a) P40. The experimental groups (CrT+/y: n = 10, nes-CrT+/y: n = 8 and nes-CrT−/y: n = 6) can recognize the new object in the test both at 1 h (One Way ANOVA, p = 0.916, F(2,21) = 0.088) and at 24 h (p = 0.183, F(2,18) = 1.868). (b) P100. While the three experimental groups can recall the memory of the familiar object in the test at 1 h (One Way ANOVA, p = 0.671, F(2,19) = 0.408), a significantly lower discrimination index was found in nes-CrT–/y mice (n = 6) compared to CrT+/y (n = 10) and nes-CrT+/y animals at 24 h (n = 9; One Way ANOVA, p < 0.05, F(2,22) = 5.064, post hoc Holm Sidak method p < 0.05 for both comparisons). (c) P180. A significant deficit of both short (One Way ANOVA, p < 0.05, F(2,19) = 5.662; post hoc Holm Sidak method p < 0.05 for both comparisons) and long-term memory (One Way ANOVA, p < 0.05, F(2,22) = 3.990; post hoc Holm Sidak method p < 0.05 for both comparisons) was detected in mutant mice (n = 6) compared to controls (CrT+/y: n = 11, nes-CrT+/y: n = 9). Symbols refer to post-hoc Holm Sidak comparisons between nes-CrT−/y mice and the genotype corresponding to the column on which the symbol is located: *p < 0.05. Error bars, s.e.m.
Figure 4
Figure 4
Left, learning curves for CrT+/y (white), nes-CrT+/y mice (grey) and nes-CrT–/y (black) at P40 (a; CrT+/y: n = 10, nes-CrT+/y: n = 5, nes-CrT−/y: n = 5), P100 (b; CrT+/y: n = 7, nes-CrT+/y: n = 5, nes-CrT−/y: n = 5), P180 (c; CrT+/y: n = 9, nes-CrT+/y: n = 6, nes-CrT−/y: n = 5) and P365 (d; CrT+/y: n = 12, nes-CrT+/y: n = 14, nes-CrT−/y: n = 12). No significant difference was detected along the training phase at P40 (Two way RM ANOVA, interaction genotype x day p = 0.999, F(10,85) = 0.127), P100 (interaction genotype x day p = 0.464, F(10,70) = 0.986) and P180 (Two way RM ANOVA on rank transformed data, interaction genotype x day p = 0.748, F(10,85) = 0.671). In contrast, 1-year old nes-CrT−/y animals were poorer learners with respect to control groups, with a significantly longer distance covered at day 5 and 6 of training (Two way RM ANOVA, interaction genotype x day p < 0.05, F(10, 175) = 2.334; post hoc Holm-Sidak method, p < 0.05 for all comparisons at day 5, p < 0.01 vs. CrT+/y, p < 0.05 vs. nes-CrT+/y at day 6). Right, histograms showing the mean time percentage spent in the four quadrants during the probe trial. No significant difference among the three groups was present at P40 (a; Two way RM ANOVA, interaction genotype x quadrant p = 0.985, F(6,51) = 0.167), P100 (b; interaction genotype x quadrant p = 0.856, F(6,42) = 0.428) and P180 (c; interaction genotype x quadrant p = 0.985, F(6,51) = 0.166). At all ages, CrT+/y, nes-CrT+/y, nes-CrT–/y spent significantly more time in the NE* target quadrant (Two way RM ANOVA, post hoc Holm Sidak method, p < 0.05 for all comparisons). At P365 (d), a Two-Way RM ANOVA detected a significant interaction genotype x quadrant (p < 0.05, F(6,105) = 2.534): post hoc Holm-Sidak multiple comparisons revealed that nes-CrT−/y mice did not show any preference for the target quadrant (p = 0.296 NE* vs. SO, p = 0.850 NE* vs SE, p = 0.060 NE* vs. NO), while CrT+/y and nes-CrT+/y spent significantly more time in the NE* target quadrant (p < 0.01 for all comparisons in CrT+/y, p < 0.001 for all comparisons in nes-CrT+/y). The percentage of time spent in the target quadrant was shorter in nes-CrT−/y mice than in the other two control groups (p < 0.05 for both comparisons). Representative examples of the swimming path during the probe session for a CrT+/y, a nes-CrT+/y and a nes-CrT−/y mouse are also depicted. Symbols refer to post-hoc Holm Sidak comparisons between nes-CrT−/y mice and the genotype corresponding to the column on which the symbol is located: *p < 0.05. Error bars, s.e.m.

References

    1. van de Kamp JM, Mancini GM, Salomons GS. X-linked creatine transporter deficiency: clinical aspects and pathophysiology. J. Inherit. Metab. Dis. 2014;37:715–733. doi: 10.1007/s10545-014-9713-8. - DOI - PubMed
    1. Joncquel-Chevalier Curt M, et al. Creatine biosynthesis and transport in health and disease. Biochimie. 2015;119:146–165. doi: 10.1016/j.biochi.2015.10.022. - DOI - PubMed
    1. Stöckler S, Hanefeld F, Frahm J. Creatine replacement therapy in guanidinoacetate methyltransferase deficiency, a novel inborn error of metabolism. Lancet. 1996;348:789–790. doi: 10.1016/S0140-6736(96)04116-5. - DOI - PubMed
    1. Schulze A, Ebinger F, Rating D, Mayatepek E. Improving treatment of guanidinoacetate methyltransferase deficiency: reduction of guanidinoacetic acid in body fluids by arginine restriction and ornithine supplementation. Mol. Genet. Metab. 2001;74:413–419. doi: 10.1006/mgme.2001.3257. - DOI - PubMed
    1. Battini R, et al. Creatine depletion in a new case with AGAT deficiency: clinical and genetic study in a large pedigree. Mol. Genet. Metab. 2002;77:326–331. doi: 10.1016/S1096-7192(02)00175-0. - DOI - PubMed

Publication types

MeSH terms

Substances

Supplementary concepts