. 2019 Jul;13(4):614-626.
doi: 10.1177/1932296818822496. Epub 2019 Jan 13.

The Relationships Between Time in Range, Hyperglycemia Metrics, and HbA1c

Affiliations

The Relationships Between Time in Range, Hyperglycemia Metrics, and HbA1c

Roy W Beck et al. J Diabetes Sci Technol. 2019 Jul.

Abstract

Background: As the use of continuous glucose monitoring (CGM) increases, there is a need to better understand key metrics of time in range 70-180 mg/dL (TIR70-180) and hyperglycemia and how they relate to hemoglobin A1c (A1C).

Methods: Analyses were conducted utilizing datasets from four randomized trials encompassing 545 adults with type 1 diabetes (T1D) who had central-laboratory measurements of A1C. CGM metrics were calculated and compared with each other and A1C cross-sectionally and longitudinally.

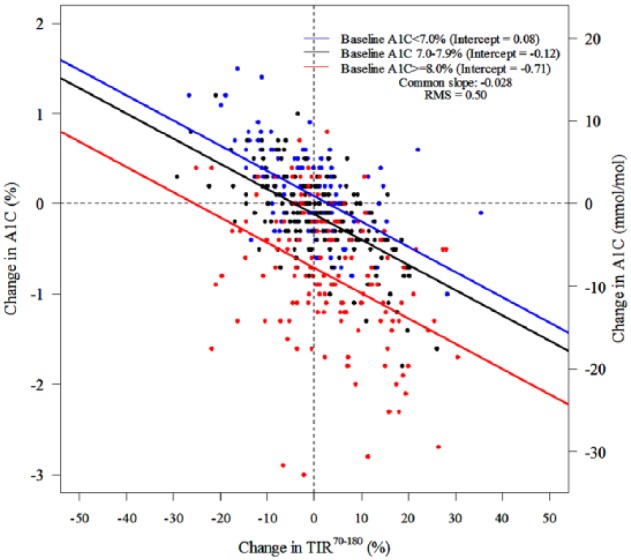
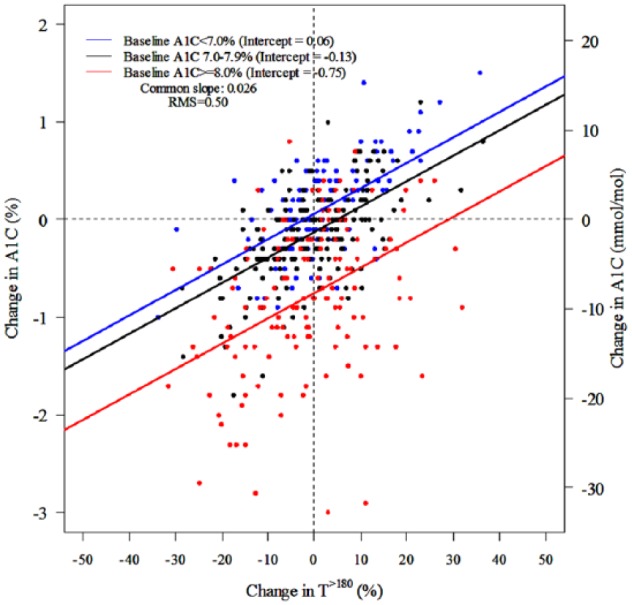
Results: Correlations among CGM metrics (TIR70-180, time >180 mg/dL, time >250 mg/dL, mean glucose, area under the curve above 180 mg/dL, high blood glucose index, and time in range 70-140 mg/dL) were typically 0.90 or greater. Correlations of each metric with A1C were lower (absolute values 0.66-0.71 at baseline and 0.73-0.78 at month 6). For a given TIR70-180 percentage, there was a wide range of possible A1C levels that could be associated with that TIR70-180 level. On average, a TIR70-180 of 70% and 50% corresponded with an A1C of approximately 7% and 8%, respectively. There also was considerable spread of change in A1C for a given change in TIR70-180, and vice versa. An increase in TIR70-180 of 10% (2.4 hours per day) corresponded to a decrease in A1C of 0.6%, on average.

Conclusions: In T1D, CGM measures reflecting hyperglycemia (including TIR and mean glucose) are highly correlated with each other but only moderately correlated with A1C. For a given TIR or change in TIR there is a wide range of possible corresponding A1C values.

Keywords: continuous glucose monitoring; glucose time in range; type 1 diabetes.


Conflict of interest statement

Declaration of Conflicting Interests: The author(s) declared the following potential conflicts of interest with respect to the research, authorship, and/or publication of this article: RWB has no personal disclosures. His nonprofit employer has received research funding from Dexcom, Bigfoot Biomedical, and Tandem Diabetes Care, study supplies from Roche, Ascencia, Dexcom, and Abbot Diabetes Care, and consulting fees from Insulet, Bigfoot Biomedical, and Eli Lilly and Company. RMB has received research support, consulted, or has been on the scientific advisory board for Abbott Diabetes Care, Dexcom, Hygieia, Johnson & Johnson, Lilly, Medtronic, Novo Nordisk, Onduo, Roche, Sanofi, and United Healthcare. RMB’s employer, nonprofit HealthPartners Institute, contracts for his services and no personal income goes to RMB. PC has no disclosures. CK has no disclosures. ALC has received research support from or consulted for Abbott Diabetes Care, Dexcom, Medtronic, Novo Nordisk, and Sanofi. ALC’s employer, the nonprofit HealthPartners Institute, contracts for his services and no personal income goes to ALC. MLJ has received research support from and/or has consulted with Abbott Diabetes Care, Dexcom, Hygieia, Johnson & Johnson, Lilly, Medtronic, Novo Nordisk, and Sanofi. MLJ’s employer, nonprofit HealthPartners Institute, contracts for her services and no personal incomes goes to MLJ. DR has served as a consultant to Eli Lilly and Company.

Figures

Figure 1.
Figure 1.
Scatter plots for selected CGM Metrics with A1C at month 6 (RMS = root mean square error) The Intercept, slope and RMS are not shown for A1C (%) vs T>250 (%) in view of apparent nonlinearity of this relationship.
Figure 2.
Figure 2.
Scatter plots for change in TIR70-180 versus change in A1C (slopes were constrained to be identical for all three subgroups for A1C at baseline; RMS = root mean square error).
Figure 3.
Figure 3.
Scatter plots for change in T>180 versus change in A1C (slopes were constrained to be identical for all three subgroups for A1C at baseline; RMS = root mean square error).
Figure 4.
Figure 4.
Example of ambulatory glucose profile (AGP). The AGP shows glucose patterns over time, which provides considerable information for optimizing diabetes management by identifying specific times of day with hyperglycemia or hypoglycemia.- The inset shows time in ranges for five ranges (very low <54 mg/dL to very high >250 mg/dL).,

Comment in

References

    1. Beck RW, Connor CG, Mullen DM, Wesley DM, Bergenstal RM. The fallacy of average: how using HbA1c alone to assess glycemic control can be misleading. Diabetes Care. 2017;40:994-999. - PMC - PubMed
    1. Hempe JM, Liu S, Myers L, McCarter RJ, Buse JB, Fonseca V. The hemoglobin glycation index identifies subpopulations with harms or benefits from intensive treatment in the ACCORD trial. Diabetes Care. 2015;38:1067-1074. - PMC - PubMed
    1. Malka R, Nathan DM, Higgins JM. Mechanistic modeling of hemoglobin glycation and red blood cell kinetics enables personalized diabetes monitoring. Sci Transl Med. 2016;8:359ra130. - PMC - PubMed
    1. Nathan DM, Kuenen J, Borg R, et al. Translating the A1C assay into estimated average glucose values. Diabetes Care. 2008;31:1473-1478. - PMC - PubMed
    1. Yudkin JS, Forrest RD, Jackson CA, Ryle AJ, Davie S, Gould BJ. Unexplained variability of glycated haemoglobin in non-diabetic subjects not related to glycaemia. Diabetologia. 1990;33:208-215. - PubMed

Publication types