. 2019 Jan 12;11(1):6.
doi: 10.1186/s13195-018-0461-0.

CHIMERA repetitive mild traumatic brain injury induces chronic behavioural and neuropathological phenotypes in wild-type and APP/PS1 mice

Affiliations

CHIMERA repetitive mild traumatic brain injury induces chronic behavioural and neuropathological phenotypes in wild-type and APP/PS1 mice

Wai Hang Cheng et al. Alzheimers Res Ther. .

Abstract

Background: The annual incidence of traumatic brain injury (TBI) in the United States is over 2.5 million, with approximately 3-5 million people living with chronic sequelae. Compared with moderate-severe TBI, the long-term effects of mild TBI (mTBI) are less understood but important to address, particularly for contact sport athletes and military personnel who have high mTBI exposure. The purpose of this study was to determine the behavioural and neuropathological phenotypes induced by the Closed-Head Impact Model of Engineered Rotational Acceleration (CHIMERA) model of mTBI in both wild-type (WT) and APP/PS1 mice up to 8 months post-injury.

Methods: Male WT and APP/PS1 littermates were randomized to sham or repetitive mild TBI (rmTBI; 2 × 0.5 J impacts 24 h apart) groups at 5.7 months of age. Animals were assessed up to 8 months post-injury for acute neurological deficits using the loss of righting reflex (LRR) and Neurological Severity Score (NSS) tasks, and chronic behavioural changes using the passive avoidance (PA), Barnes maze (BM), elevated plus maze (EPM) and rotarod (RR) tasks. Neuropathological assessments included white matter damage; grey matter inflammation; and measures of Aβ levels, deposition, and aducanumab binding activity.

Results: The very mild CHIMERA rmTBI conditions used here produced no significant acute neurological or motor deficits in WT and APP/PS1 mice, but they profoundly inhibited extinction of fear memory specifically in APP/PS1 mice over the 8-month assessment period. Spatial learning and memory were affected by both injury and genotype. Anxiety and risk-taking behaviour were affected by injury but not genotype. CHIMERA rmTBI induced chronic white matter microgliosis, axonal injury and astrogliosis independent of genotype in the optic tract but not the corpus callosum, and it altered microgliosis in APP/PS1 amygdala and hippocampus. Finally, rmTBI did not alter long-term tau, Aβ or amyloid levels, but it increased aducanumab binding activity.

Conclusions: CHIMERA is a useful model to investigate the chronic consequences of rmTBI, including behavioural abnormalities consistent with features of post-traumatic stress disorder and inflammation of both white and grey matter. The presence of human Aβ greatly modified extinction of fear memory after rmTBI.

Keywords: Alzheimer disease mice; Aβ metabolism; CHIMERA; Neuroinflammation; Post-traumatic stress disorder; Spatial memory; Traumatic brain injury.


Conflict of interest statement

Ethics approval and consent to participate

All experiments were approved by the University of British Columbia Committee on Animal Care and are compliant with Canadian Council of Animal Care (A15-0096) guidelines.

Consent for publication

All authors have consented to publication.

Competing interests

The authors declare that they have no competing interests.

Publisher’s Note

Springer Nature remains neutral with regard to jurisdictional claims in published maps and institutional affiliations.

Figures
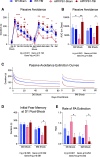
Fig. 1
Fig. 1
Passive avoidance task performance. a On day 6 (D6) post-TBI, mice were placed into the light chamber, and a foot shock was given once they entered into the dark chamber. From D7 to 3 months (3 M) post-TBI, the mice were placed into the light chamber, and the duration of time spent before entering into the dark chamber is reported. No foot shock was given on post-shock days. The experiment was repeated again from 6 M to 8 M post-TBI, where a foot shock was given on the first day of 6 M only. The duration of time spent before the mice entered into the dark chamber is reported. A longer duration indicates stronger fear memory. b The cumulative fear response was reported as the AUC from (a). c The duration in the light chamber on post-shock days was used to fit the Ebbinghaus saving function M = θt to model the extinction of fear memory, where θ is the initial memory and ψ is the rate of extinction. d Initial memory at D1 post-shock was evaluated from (c) by inputting t = 1. e The rate of extinction ψ from (c) is reported. Data are expressed as mean ± SE. Omnibus statistical results are provided below each panel. In (a), asterisks represent significant post hoc differences between APP/PS1-TBI and APP/PS1-Sham (* p < 0.05, ** p < 0.01, *** p < 0.001). Ampersand represents significant post hoc differences between APP/PS1-TBI and WT-TBI (& p < 0.05). In (b), (d) and (e), asterisks represent significant post hoc differences between marked groups (* p < 0.05, ** p < 0.01, *** p < 0.001). n = 8–13 per genotype per injury per time point
Fig. 2
Fig. 2
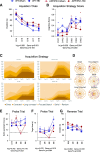
Barnes maze task performance. a From D14 to D18 post-TBI, acquisition learning trials were performed, and the time it took to locate and enter into the escape box was reported. The average performance of three trials per day was expressed as mean ± SE. A shorter duration indicates faster spatial learning. b The exploration paths of D14 and D18 (the first and last acquisition days, respectively) were analysed and classified into six strategies. The best strategy (direct) was given a score of 1 and the worst (random) a score of 0. The performance during the three trials on each day was plotted as separate data points. A higher score indicates a better exploration strategy. c The frequency of employing each strategy was plotted. d An example of each exploration strategy is provided. e Probe trials were performed on D19, 2 M, 6 M, and 8 M post-TBI, during which the escape box was removed. The time spent inside the north quadrant (the previous escape box location) is plotted. The dotted line represents the expected amount of time that would have been spent by random. A longer time duration indicates better spatial memory. f The time spent around the previous escape box location is plotted. The dotted line represents the expected amount of time spent by randomly exploring each possible box location. A longer duration indicates better and more precise spatial memory. g Reverse trials were performed on D20, 2 M, 6 M, and 8 M post-TBI, in which the escape box was placed at the opposite location. A shorter duration indicates better spatial unlearning and relearning. Data are expressed as mean ± S.E. Statistical results are provided below each panel. Blue and red asterisks represent significant post hoc differences between WT-Sham and WT-TBI and between APP/PS1-Sham and APP/PS1-TBI, respectively (* p < 0.05). n = 10–13 per genotype per injury per time point
Fig. 3
Fig. 3
Elevated plus maze task performance. From D7 to 8 M post-TBI, mice were tested in the EPM. The difference between the time spent in the closed arms and the open arms are plotted and expressed as mean ± SE. A greater value indicates more time spent in the closed arms and less time in the open arms, suggesting greater anxiety. A smaller value indicates that the mice spent relatively more time in the open arms and less time in the closed arms, suggesting greater risk-taking behaviour. n = 6–13 per genotype per injury per time point
Fig. 4
Fig. 4
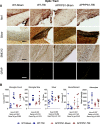
White matter pathology in the optic tract. a At 8 M post-TBI, histopathological analyses were performed on the optic tract, using Iba1 (microglia), NeuroSilver (axonal injury), SMI312 (neurofilament), and GFAP (astrocytes). Representative images for each stain are shown. Scale bar represents 200 μm. b Quantification of (a) was plotted by reporting the density and size of microglia, the stain area of NeuroSilver, the density of neurofilament-positive axonal bulbs, and GFAP immunofluorescence intensity of astrocytes. Data are plotted as mean ± SE with an overlaid scatterplot of individual animals
Fig. 5
Fig. 5
Grey matter pathology at fear and spatial memory-related regions. At 8 M post-TBI, histopathological analyses were performed for (a) prefrontal cortex, (b) amygdala, and (c) hippocampus, using Iba1 and GFAP. Scale bar represents 20 μm for amygdala Iba1 and 200 μm in all other images
Fig. 6
Fig. 6
Quantification of grey matter pathology at fear and spatial memory-related regions. On the basis of images in Fig. 5, the total density of microglia, the stained area of all microglia, the mean intensity of GFAP fluorescence, and the count of total nucleus were plotted for (a) prefrontal cortex, (b) amygdala, and (c) hippocampus. Data are plotted as mean ± SE with an overlaid scatterplot of individual animals
Fig. 7
Fig. 7
Quantification of non-activated microglia at fear and spatial memory-related regions. Because microglia in grey matter regions appear as either a non-activated ramified morphology with a size of less than 145 μm2 or an activated morphology with a size greater than 145 μm2, the 145-μm2 size was used as a surrogate cut-off for non-activated and activated microglia. The density and stain area for each type of microglia are plotted for (a, b) prefrontal cortex, (c, d) amygdala, and (e, f) hippocampus. Data are shown as mean ± SE with an overlaid scatterplot of individual animals. Asterisks indicate significant post hoc difference between APP/PS1-TBI and APP/PS1-Sham (* p < 0.05; ** p < 0.01)
Fig. 8
Fig. 8
Aβ analyses. Brain homogenates from mice harvested at 8 M post-TBI were serially extracted in carbonate and then guanidine HCl (GuHCl) buffer. a The concentration of Aβ40 and Aβ42 in the GuHCl-soluble fraction is plotted. b The concentration of Aβ40 and Aβ42 in the carbonate-soluble fraction is plotted. c Using an Octet RED system with streptavidin biosensors, the levels of aducanumab-binding high-molecular-weight oligomeric and soluble fibril fragment forms of Aβ and the total level of Poly8029-binding Aβ were assayed. Human IgG1 served as an isotype control for aducanumab. Data are plotted as mean ± SE with an overlaid scatterplot of individual animals

Similar articles

Cited by

References

    1. Acosta SA, Tajiri N, Shinozuka K, Ishikawa H, Grimmig B, Diamond DM, Sanberg PR, Bickford PC, Kaneko Y, Borlongan CV. Long-term upregulation of inflammation and suppression of cell proliferation in the brain of adult rats exposed to traumatic brain injury using the controlled cortical impact model. PLoS One. 2013;8(1):e53376. doi: 10.1371/journal.pone.0053376. - DOI - PMC - PubMed
    1. Ali Rodriguez R, Joya C, Hines RM. Common Ribs of Inhibitory Synaptic Dysfunction in the Umbrella of Neurodevelopmental Disorders. Front Mol Neurosci. 2018;11:132. doi: 10.3389/fnmol.2018.00132. - DOI - PMC - PubMed
    1. Bajwa NM, Halavi S, Hamer M, Semple BD, Noble-Haeusslein LJ, Baghchechi M, Hiroto A, Hartman RE, Obenaus A. Mild concussion, but not moderate traumatic brain injury, is associated with long-term depression-like phenotype in mice. PLoS One. 2016;11(1):e0146886. doi: 10.1371/journal.pone.0146886. - DOI - PMC - PubMed
    1. Baratz R, Tweedie D, Rubovitch V, Luo W, Yoon JS, Hoffer BJ, Greig NH, Pick CG. Tumor necrosis factor-α synthesis inhibitor, 3,6′-dithiothalidomide, reverses behavioral impairments induced by minimal traumatic brain injury in mice. J Neurochem. 2011;118(6):1032–1042. doi: 10.1111/j.1471-4159.2011.07377.x. - DOI - PMC - PubMed
    1. Barlow KM. Postconcussion syndrome: a review. J Child Neurol. 2016;31(1):57–67. doi: 10.1177/0883073814543305. - DOI - PubMed

Publication types