Comparative Study
. 2019 Jan 22;8(2):e008968.
doi: 10.1161/JAHA.118.008968.

Elevated Sera sST2 Is Associated With Heart Failure in Men ≤50 Years Old With Myocarditis

Affiliations
Comparative Study

Elevated Sera sST2 Is Associated With Heart Failure in Men ≤50 Years Old With Myocarditis

Michael J Coronado et al. J Am Heart Assoc. .

Abstract

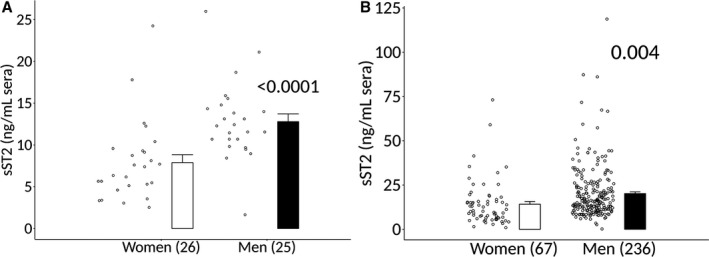
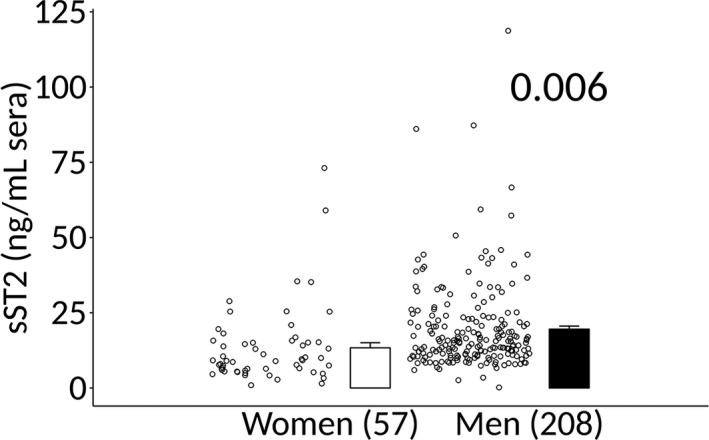
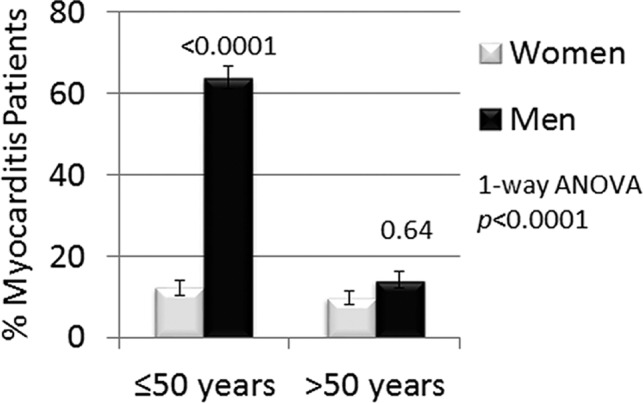
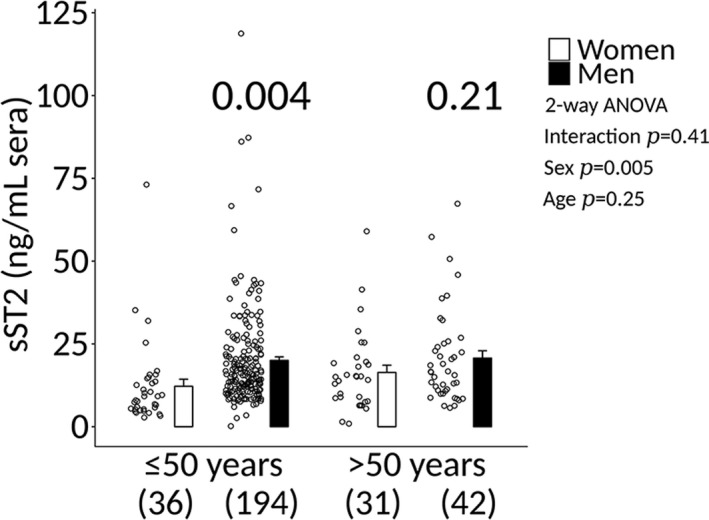
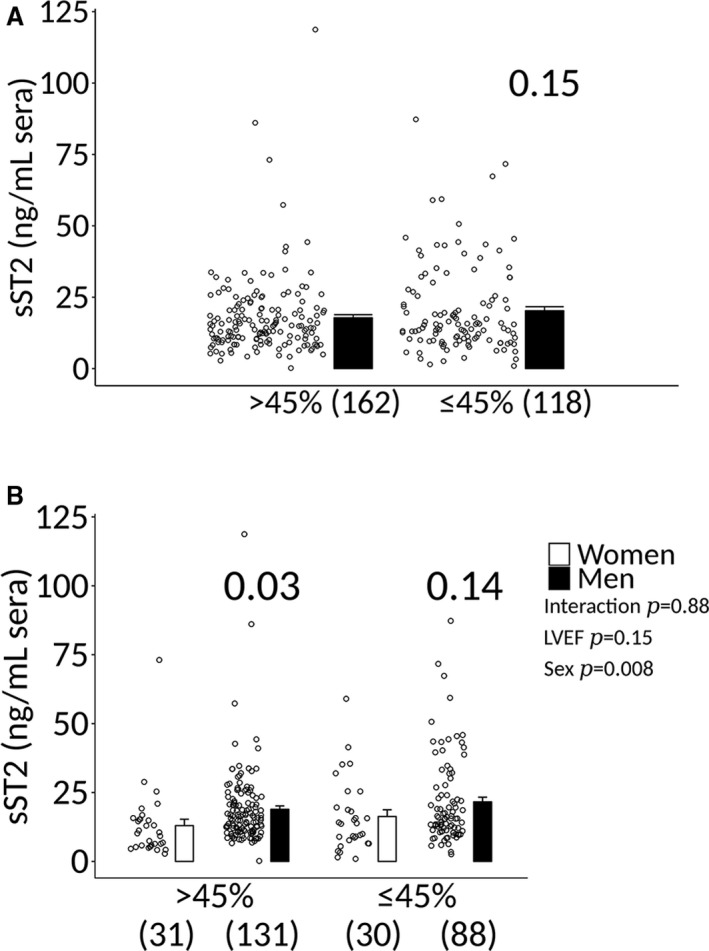
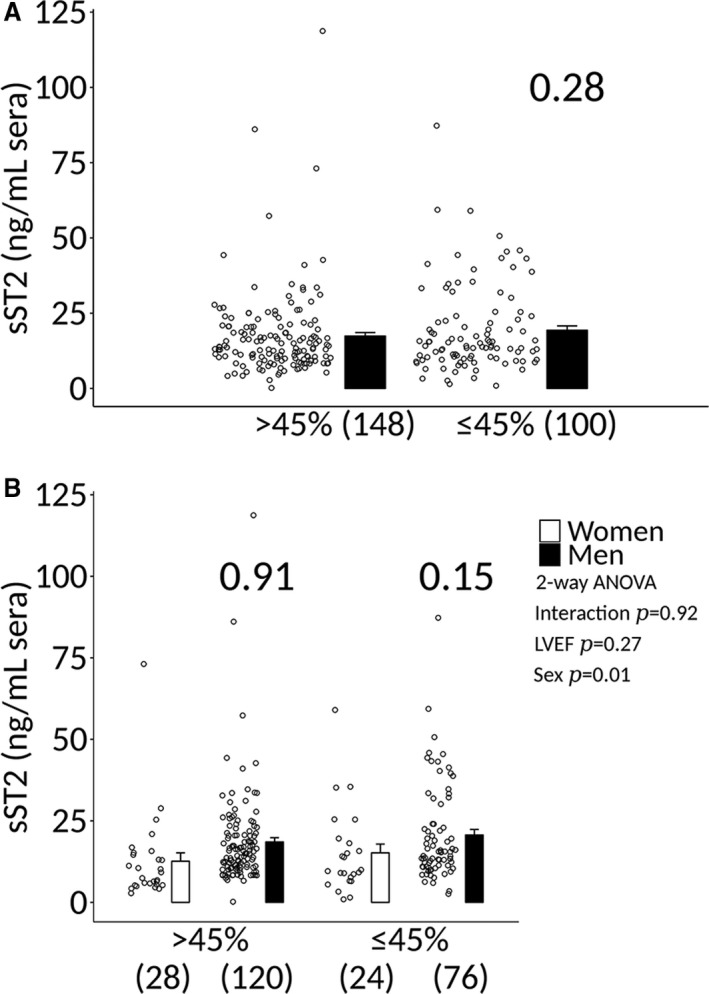
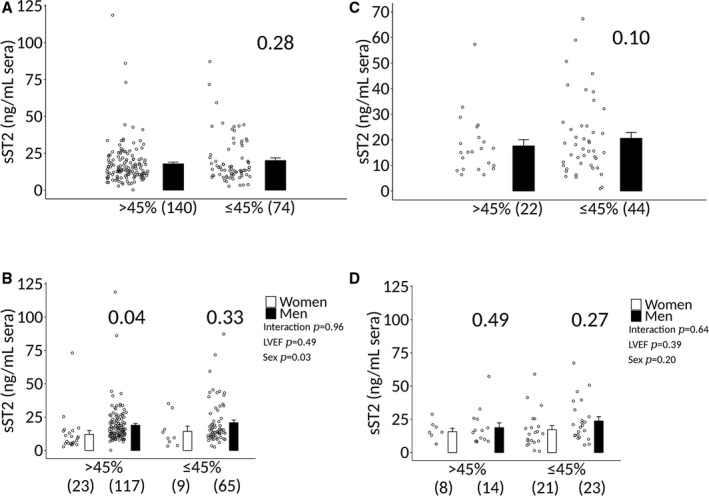
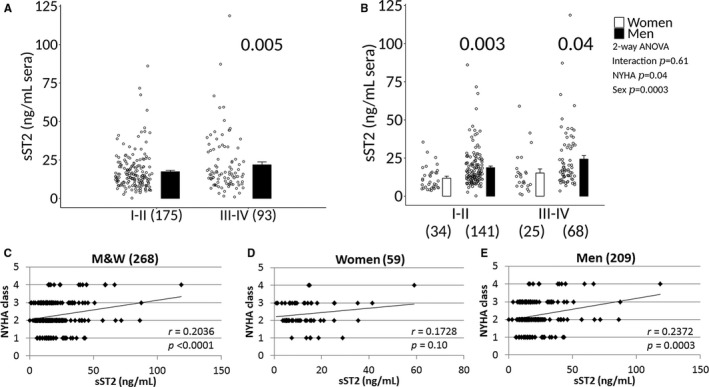
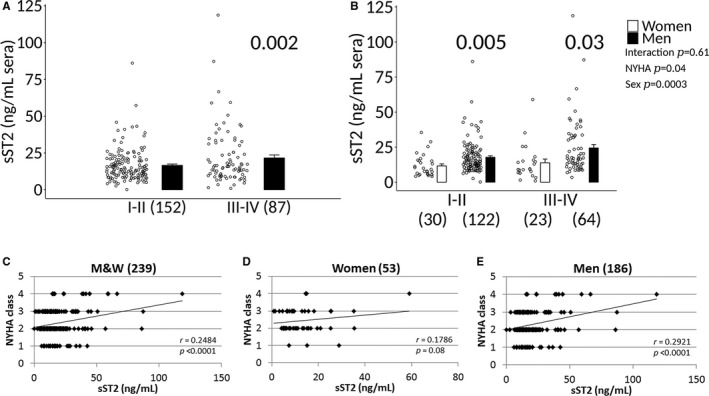
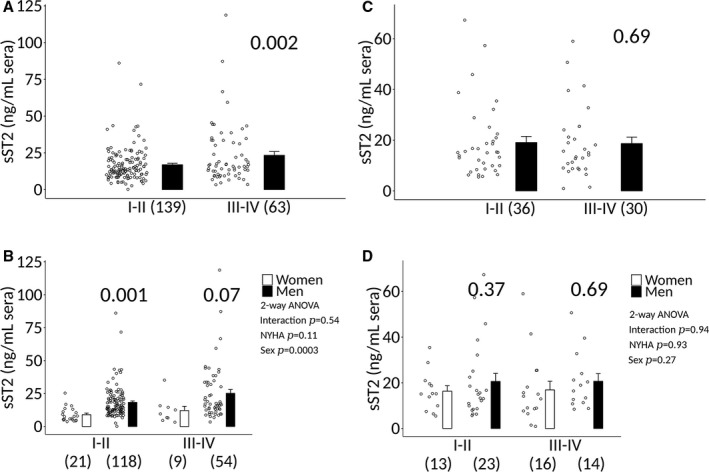
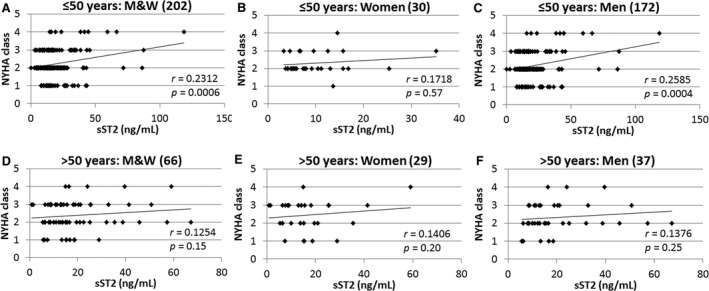
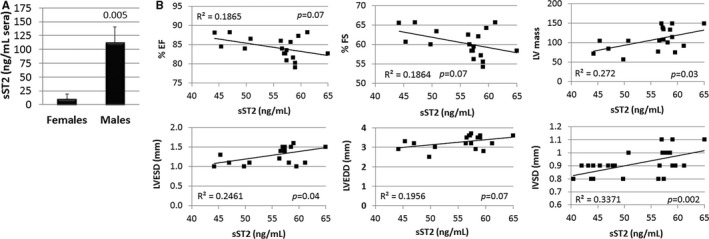
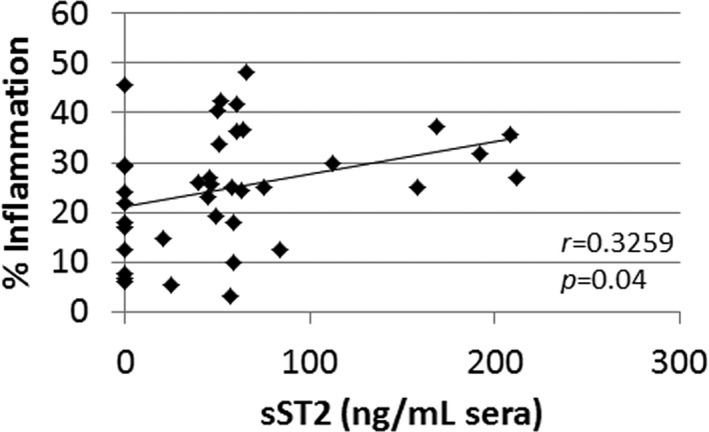
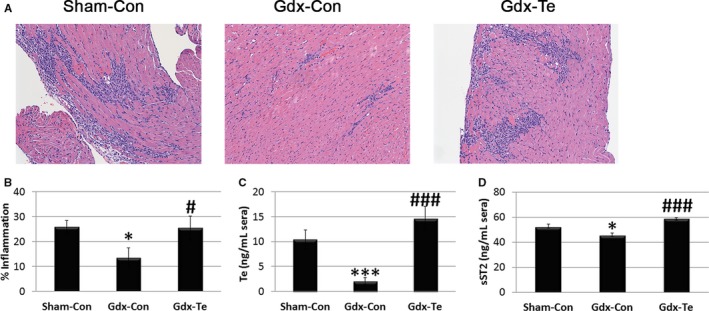
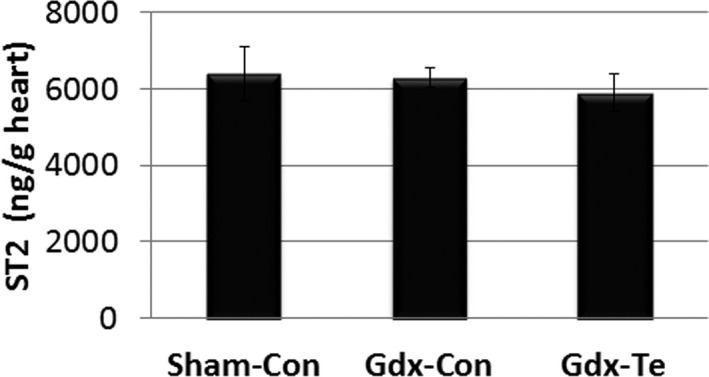
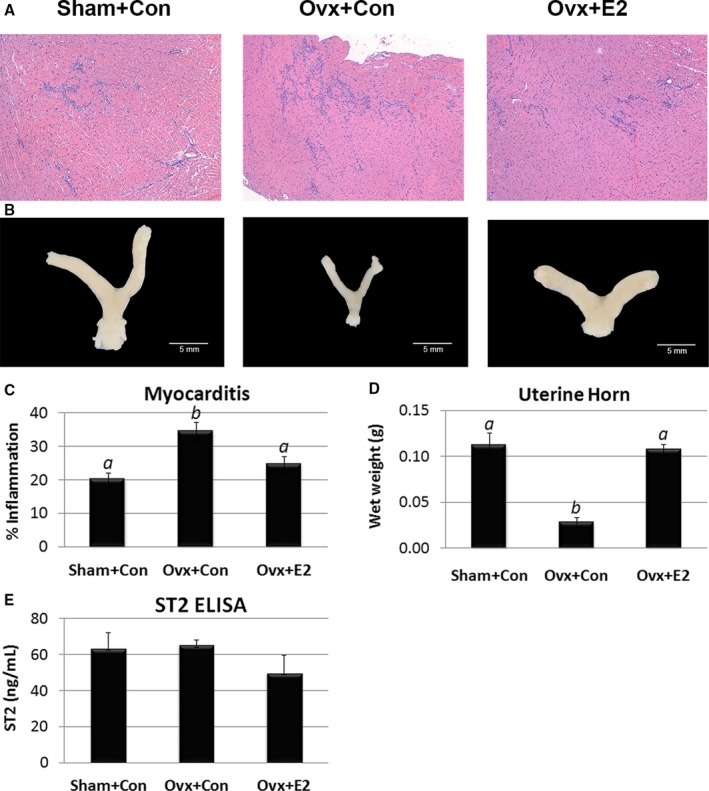
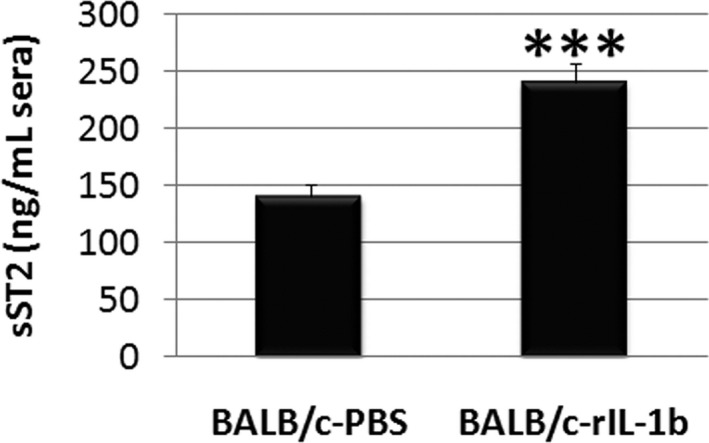
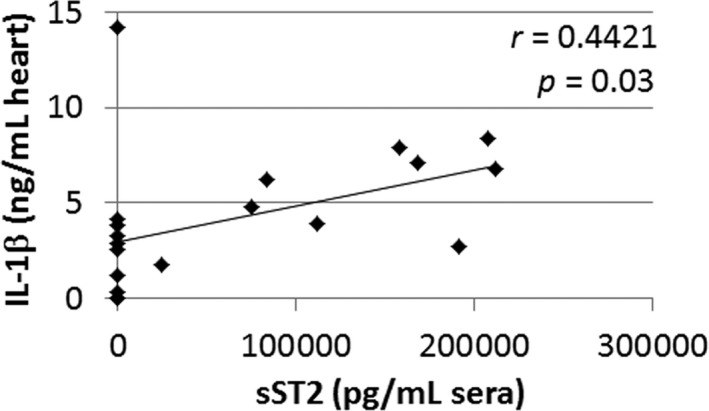
Background Myocarditis is an important cause of acute and chronic heart failure. Men with myocarditis have worse recovery and an increased need for transplantation compared with women, but the reason for the sex difference remains unclear. Elevated sera soluble (s) ST2 predicts mortality from acute and chronic heart failure, but has not been studied in myocarditis patients. Methods and Results Adults with a diagnosis of clinically suspected myocarditis (n=303, 78% male) were identified according to the 2013 European Society of Cardiology position statement. Sera sST2 levels were examined by ELISA in humans and mice and correlated with heart function according to sex and age. Sera sST2 levels were higher in healthy men ( P=8×10⁻⁶) and men with myocarditis ( P=0.004) compared with women. sST2 levels were elevated in patients with myocarditis and New York Heart Association class III - IV heart failure ( P=0.002), predominantly in men ( P=0.0003). Sera sST2 levels were associated with New York Heart Association class in men with myocarditis who were ≤50 years old ( r=0.231, P=0.0006), but not in women ( r=0.172, P=0.57). Sera sST2 levels were also significantly higher in male mice with myocarditis ( P=0.005) where levels were associated with cardiac inflammation. Gonadectomy with hormone replacement showed that testosterone ( P<0.001), but not estradiol ( P=0.32), increased sera sST2 levels in male mice with myocarditis. Conclusions We show in a well-characterized subset of heart failure patients with clinically suspected and biopsy-confirmed myocarditis that elevated sera sST2 is associated with an increased risk of heart failure based on New York Heart Association class in men ≤50 years old.

Keywords: biomarkers; heart failure; myocarditis; sST2; sex differences.


Figures

Figure 1
Figure 1
Sera sST2 elevated in healthy men and men with clinically suspected myocarditis compared with women. Soluble ST2 (sST2) in sera of (A) healthy men and women (n) with no known cardiovascular diseases (1 site). Data are shown as jitter scatter plots and mean±SEM and P values were calculated using a 2‐way Mann–Whitney rank test. B, Men and women with clinically suspected myocarditis with symptom duration <6 mo (multiple sites) were determined by ELISA. Data are shown as jitter scatter plots, and mean±SEM and P values were calculated after adjusting for multiple sites using linear regression analysis.
Figure 2
Figure 2
Sera sST2 elevated in men with biopsy‐confirmed myocarditis. Soluble ST2 (sST2) in sera of men and women with biopsy‐confirmed myocarditis were determined by ELISA. Data are shown as jitter scatter plots, and mean±SEM and P values were calculated after adjusting for multiple sites using linear regression analysis.
Figure 3
Figure 3
Comparison of R&D Systems and Critical Diagnostics sST2 ELISA kits. A, Sera samples from a subset of patients with myocarditis from 1 site were analyzed for soluble ST2 (sST2) using the human R&D Systems (R&D) kit vs the Critical Diagnostics (CD) ELISA kit. Associations were calculated using 2‐tailed Pearson's correlation. B, Average values obtained for the R&D vs the CD kit for the same 21 (n) samples. Data are shown as mean±SEM.
Figure 4
Figure 4
Percentage of men and women by age in the study. Percent of women and men with clinically suspected myocarditis that were ≤50 or >50 years of age. Data are shown as mean±SEM (n) and P values calculated using 1‐way ANOVA with Sidak's multiple comparisons test.
Figure 5
Figure 5
sST2 elevated in men ≤50 years old with clinically suspected myocarditis. Sera soluble ST2 (sST2) levels in clinically suspected patients with myocarditis according to sex and age. Data are shown as jitter scatter plots, and mean±SEM (n) and P values were calculated after adjusting for multiple sites using linear regression analysis. Two‐way ANOVA P values indicate interaction between sex and age (P=0.41), sex and sST2 (P=0.005), and age and sST2 (P=0.25).
Figure 6
Figure 6
Sera sST2 levels in men and women with clinically suspected myocarditis based on LVEF. A, Soluble ST2 (sST2) levels in patients with clinically suspected myocarditis (men and women combined) based on a left ventricular ejection fraction (LVEF) > or ≤45%. Data are shown as jitter scatter plots, and mean±SEM and P value calculated after adjusting for multiple sites using linear regression analysis. B, Sera sST2 levels in patients with myocarditis according to sex and LVEF. Data are shown as jitter scatter plots mean±SEM (n), and P values were calculated after adjusting for multiple sites using linear regression analysis. Two‐way ANOVA P values indicate interaction between LVEF and sex (P=0.88), LVEF and sST2 (P=0.15), and sex and sST2 (P=0.008).
Figure 7
Figure 7
Sera sST2 levels in men and women with biopsy‐proven myocarditis based on LVEF. A, Soluble ST2 (sST2) levels in patients with biopsy‐proven myocarditis (men and women combined) based on a left ventricular ejection fraction (LVEF) > or ≤45%. Data are shown as jitter scatter plots, and mean±SEM and P value calculated after adjusting for multiple sites using linear regression analysis. B, Sera sST2 levels in patients with myocarditis according to sex and LVEF. Data are shown as jitter scatter plots and mean±SEM (n) and P values were calculated after adjusting for multiple sites using linear regression analysis. Two‐way ANOVA P values indicate interaction between LVEF and sex (P=0.92), LVEF and sST2 (P=0.27), and sex and sST2 (P=0.01).
Figure 8
Figure 8
Analysis of sST2 levels according to LVEF, sex, and age in clinically suspected myocarditis. Soluble ST2 (sST2) levels in patients with clinically suspected myocarditis (n) that are (A and B) ≤50 vs (C and D) >50 y old. A and C, Analysis of sST2 levels according to left ventricle ejection fraction (LVEF) > or ≤45% when data from men and women were combined. Data are shown as jitter scatter plots and mean±SEM (n) and P value calculated after adjusting for multiple sites using linear regression analysis. B and D, Analysis of sST2 levels according to sex and LVEF. Data are shown as jitter scatter plots, and mean±SEM and P values calculated after adjusting for multiple sites using linear regression analysis. Two‐way ANOVA P values indicate interaction between (B) ≤50: LVEF and sex (P=0.96), LVEF and sST2 (P=0.49), and sex and sST2 (P=0.03) and (D) >50: LVEF and sex (P=0.64), LVEF and sST2 (P=0.39), and sex and sST2 (P=0.20).
Figure 9
Figure 9
Sera sST2 associated with NYHA class IIIIV heart failure in patients with clinically suspected myocarditis. A, Soluble ST2 (sST2) levels in men and women (M&W) combined with clinically suspected myocarditis based on New York Heart Association (NYHA) class. Data are shown as jitter scatter plots, and mean±SEM (n) and P value calculated after adjusting for multiple sites using linear regression analysis. B, Sera sST2 levels based on NYHA class according to sex. Data are shown as jitter scatter plots and mean±SEM and P values determined after adjusting for multiple sites using linear regression analysis. Two‐way ANOVA P values indicate interaction between NYHA and sex (P=0.61), NYHA and sST2 (P=0.04) and sex and sST2 (P=0.0003). Comparisons between NYHA class I‐IV in (C) M&W combined, (D) women, or (E) men. C through E, P values calculated using 2‐tailed Pearson correlation and adjusted for multiple sites using linear regression analysis.
Figure 10
Figure 10
Sera sST2 associated with NYHA class IIIIV heart failure in men with biopsy‐confirmed myocarditis. A, Soluble ST2 (sST2) levels in men and women (M&W) combined with biopsy‐confirmed myocarditis based on New York Heart Association (NYHA) class. Data are shown as jitter scatter plots, and mean±SEM (n) and P value determined after adjusting for multiple sites using linear regression analysis. B, Sera sST2 levels based on NYHA class according to sex. Data are shown as jitter scatter plots, and mean±SEM and P values calculated after adjusting for multiple sites using linear regression analysis. Two‐way ANOVA P values indicate interaction between NYHA and sex (P=0.61), NYHA and sST2 (P=0.04), and sex and sST2 (P=0.0003). Comparisons between NYHA class I‐IV in (C) M&W combined, (D) women, or (E) men. C through E, P values were calculated using 2‐tailed Pearson correlation and adjusted for multiple sites using linear regression analysis.
Figure 11
Figure 11
Sera sST2 according to NYHA class, sex, and age in patients with clinically suspected myocarditis. Soluble ST2 (sST2) levels in patients with clinically suspected myocarditis (n) that are (A and B) ≤50 y old vs (C and D) >50 y old. A and C, Analysis of sST2 levels according to New York Heart Association (NYHA) class when data from men and women are combined. Data are shown as jitter scatter plots and mean±SEM (n) and P value determined after adjusting for multiple sites using linear regression analysis. B and D, Analysis of sST2 levels according to sex, age, and NYHA class. Data are shown as jitter scatter plots and mean±SEM and P values calculated after adjusting for multiple sites using linear regression analysis. Two‐way ANOVA P values indicate interaction between (B) ≤50: NYHA and sex (P=0.54), NYHA and sST2 (P=0.11), and sex and sST2 (P=0.0003) and (D) >50: NYHA and sex (P=0.94), NYHA and sST2 (P=0.93), and sex and sST2 (P=0.27).
Figure 12
Figure 12
Sera sST2 correlates with heart failure based on NYHA class in men ≤50 y old with myocarditis. Correlations between New York Heart Association (NYHA) class and soluble ST2 (sST2) levels in patients with clinically suspected myocarditis (n) (A through C) ≤50 or (D through F) >50 y old were examined in men and women (M&W) combined (A and D), women (B and E), or men (C and F). P values determined using 2‐tailed Pearson correlation and adjusted for multiple sites using linear regression analysis.
Figure 13
Figure 13
Sera sST2 increased in male mice with myocarditis and correlates with worse heart function and size. A, Soluble ST2 (sST2) levels in the sera of male and female mice with myocarditis determined by ELISA (n=10/group). Data are shown as mean±SEM (n) and P value determined using 2‐way Student t test. B, Correlation between sST2 levels and cardiac functional parameters in male mice with myocarditis (n=18–27). Experiments were repeated 2 to 4 times. P values calculated using a 2‐tailed Pearson correlation. EF indicates ejection fraction; FS, fractional shortening; IVSD, interventricular septal dimension; LV, left ventricular; LVEDD, LV end diastolic dimension; LVESD, LV end systolic dimension.
Figure 14
Figure 14
Sera sST2 levels correlate with myocardial inflammation in male BALB/c mice with CVB3 myocarditis. P value determined using 2‐tailed Pearson's correlation (n=38). CVB3 indicates coxsackievirus B3; sST2, soluble ST2.
Figure 15
Figure 15
Testosterone increases cardiac inflammation and sera sST2 levels in male mice with myocarditis. A, Representative histology of myocarditis at day 10 postinfection (magnification ×64). B, Myocarditis assessed as the % inflammation in histology sections. Sera (C) testosterone (Te) and (D) soluble ST2 (sST2) levels were assessed using ELISA. B through D, Data show the mean±SEM and are representative of 3 separate experiments (n=9/group), *compares gonadectomy (Gdx‐Con) with Sham‐Con and #compares Gdx‐Te with Gdx‐Con; * and #, P<0.05; *** and ###, P<0.001. P values determined using 1‐way ANOVA with Tukey's multiple comparisons test. ANOVA (B) myocarditis P=0.02, (C) testosterone P<0.0001, (D) sST2 P<0.0001.
Figure 16
Figure 16
Testosterone does not significantly alter soluble ST2 (sST2) levels in the heart of male mice with myocarditis. Male BALB/c mice received a sham operation and a control capsule without Te (Sham‐Con), or a gonadectomy (Gdx) and a control capsule (Gdx‐Con), or a Gdx and a Te replacement capsule (Gdx‐Te). Data show mean±SEM and are representative of 3 separate experiments (n=9/group). P values determined using 1‐way ANOVA with Tukey's multiple comparisons test (overall P=0.49, individual comparisons not significant).
Figure 17
Figure 17
Estradiol decreases myocarditis but has no significant effect on sera soluble ST2 (sST2) levels in female mice with myocarditis. Female BALB/c mice received a sham operation and a control capsule without estradiol (E2) (Sham+Con), or an ovariectomy (Ovx) and a control capsule (Ovx+Con), or Ovx and E2 replacement (Ovx+E2). A, Representative histology of myocarditis at day 10 postinfection (magnification ×64). B, Representative photographs of uterine horns. C, Myocarditis assessed as the % inflammation in histology sections. D, Uterine horn weights. E, Sera sST2 levels were assessed using ELISA. C through E, Data show mean±SEM and are representative of 3 separate experiments (n=8–9/group) a is significantly different from b with P<0.05. P values determined using 1‐way ANOVA with Tukey's multiple comparisons test. ANOVA (C) myocarditis P=0.002, (D) uterine horn weight P<0.0001, (E) sST2 heart P=0.32, individual comparisons not significant.
Figure 18
Figure 18
IL‐1β administration increases sera soluble ST2 (sST2) levels during myocarditis in BALB/c mice. Data show mean±SEM of n=10/group, ***P<0.001. P value determined using a 2‐way Student t test.
Figure 19
Figure 19
Cardiac IL‐1β levels correlate with sera soluble ST2 (sST2) levels during myocarditis in BALB/c mice. P value calculated using a 2‐tailed Pearson's correlation (n=20).

References

    1. Bui AL, Horwich TB, Fonarow GC. Epidemiology and risk profile of heart failure. Nat Rev Cardiol. 2011;8:30–41. - PMC - PubMed
    1. Braunwald E. The war against heart failure: the Lancet lecture. Lancet. 2015;385:812–824. - PubMed
    1. Cooper LT Jr. Myocarditis. N Engl J Med. 2009;360:1526–1538. - PMC - PubMed
    1. Cooper LT Jr, Keren A, Sliwa K, Matsumori A, Mensah GA. The global burden of myocarditis: part 1: a systematic literature review for the Global Burden of Diseases, Injuries, and Risk Factors 2010 study. Glob Heart. 2014;9:121–129. - PubMed
    1. Felker GM, Hu W, Hare JM, Hruban RH, Baughman KL, Kasper EK. The spectrum of dilated cardiomyopathy. The Johns Hopkins experience with 1,278 patients. Medicine (Baltimore). 1999;78:270–283. - PubMed

Publication types

MeSH terms

Substances