

pmartR: Quality Control and Statistics for Mass Spectrometry-Based Biological Data
- PMID: 30638385
- PMCID: PMC6750869
- DOI: 10.1021/acs.jproteome.8b00760
pmartR: Quality Control and Statistics for Mass Spectrometry-Based Biological Data
Abstract
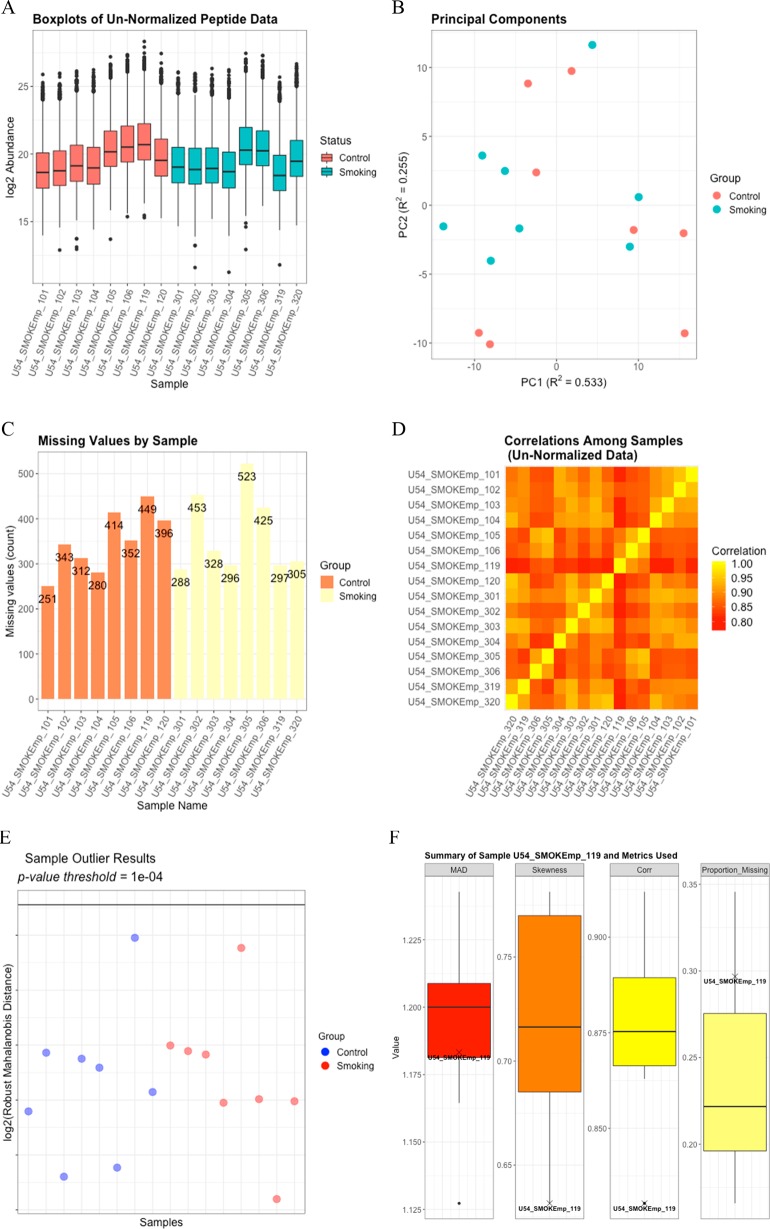
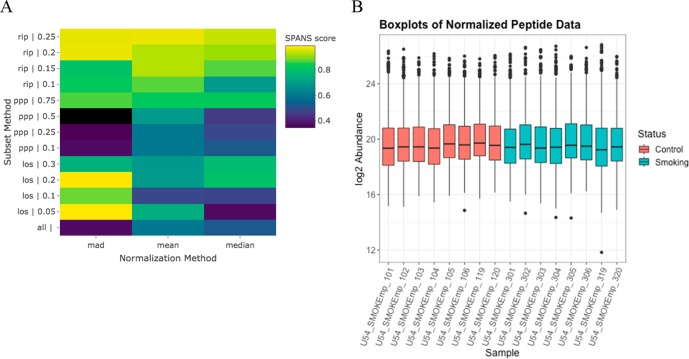
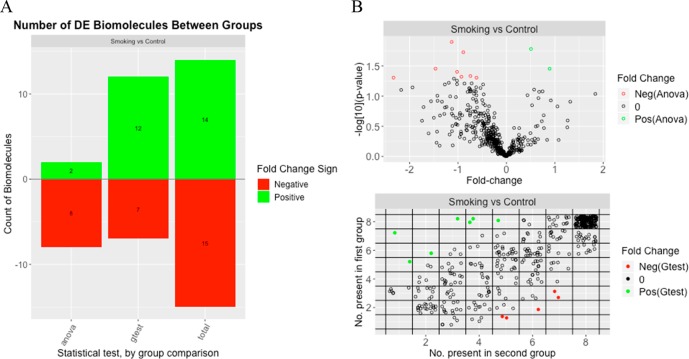
Prior to statistical analysis of mass spectrometry (MS) data, quality control (QC) of the identified biomolecule peak intensities is imperative for reducing process-based sources of variation and extreme biological outliers. Without this step, statistical results can be biased. Additionally, liquid chromatography-MS proteomics data present inherent challenges due to large amounts of missing data that require special consideration during statistical analysis. While a number of R packages exist to address these challenges individually, there is no single R package that addresses all of them. We present pmartR, an open-source R package, for QC (filtering and normalization), exploratory data analysis (EDA), visualization, and statistical analysis robust to missing data. Example analysis using proteomics data from a mouse study comparing smoke exposure to control demonstrates the core functionality of the package and highlights the capabilities for handling missing data. In particular, using a combined quantitative and qualitative statistical test, 19 proteins whose statistical significance would have been missed by a quantitative test alone were identified. The pmartR package provides a single software tool for QC, EDA, and statistical comparisons of MS data that is robust to missing data and includes numerous visualization capabilities.
Keywords: R package; mass spectrometry; normalization; quality control; quantification; statistics; visualization.
Conflict of interest statement
The authors declare no competing financial interest.
Figures
References
-
- Webb-Robertson B. J.; Wiberg H. K.; Matzke M. M.; Brown J. N.; Wang J.; McDermott J. E.; Smith R. D.; Rodland K. D.; Metz T. O.; Pounds J. G.; Waters K. M. Review, evaluation, and discussion of the challenges of missing value imputation for mass spectrometry-based label-free global proteomics. J. Proteome Res. 2015, 14 (5), 1993–2001. 10.1021/pr501138h. - DOI - PMC - PubMed
-
- Huber W.; Carey V. J.; Gentleman R.; Anders S.; Carlson M.; Carvalho B. S.; Bravo H. C.; Davis S.; Gatto L.; Girke T.; Gottardo R.; Hahne F.; Hansen K. D.; Irizarry R. A.; Lawrence M.; Love M. I.; MacDonald J.; Obenchain V.; Oles A. K.; Pages H.; Reyes A.; Shannon P.; Smyth G. K.; Tenenbaum D.; Waldron L.; Morgan M. Orchestrating high-throughput genomic analysis with Bioconductor. Nat. Methods 2015, 12 (2), 115–21. 10.1038/nmeth.3252. - DOI - PMC - PubMed
Publication types
MeSH terms
Substances
Grants and funding
LinkOut - more resources
Full Text Sources
