. 2019 Feb 20;101(4):707-720.e5.
doi: 10.1016/j.neuron.2018.12.019. Epub 2019 Jan 9.

Differential NOVA2-Mediated Splicing in Excitatory and Inhibitory Neurons Regulates Cortical Development and Cerebellar Function

Affiliations

Differential NOVA2-Mediated Splicing in Excitatory and Inhibitory Neurons Regulates Cortical Development and Cerebellar Function

Yuhki Saito et al. Neuron. .

Abstract

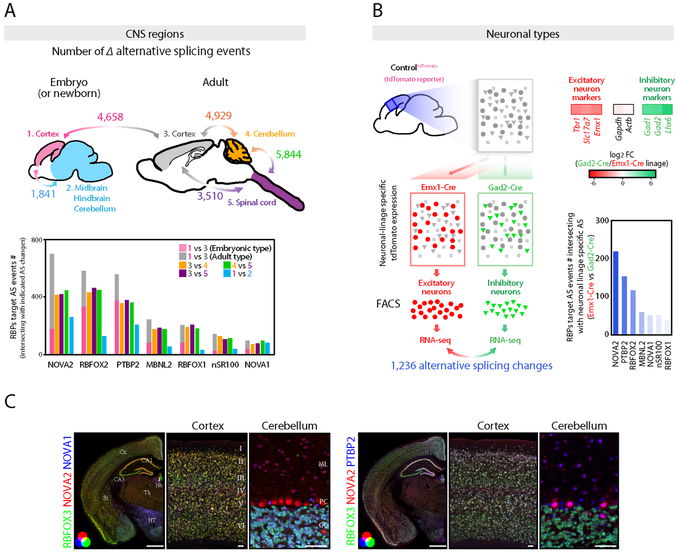
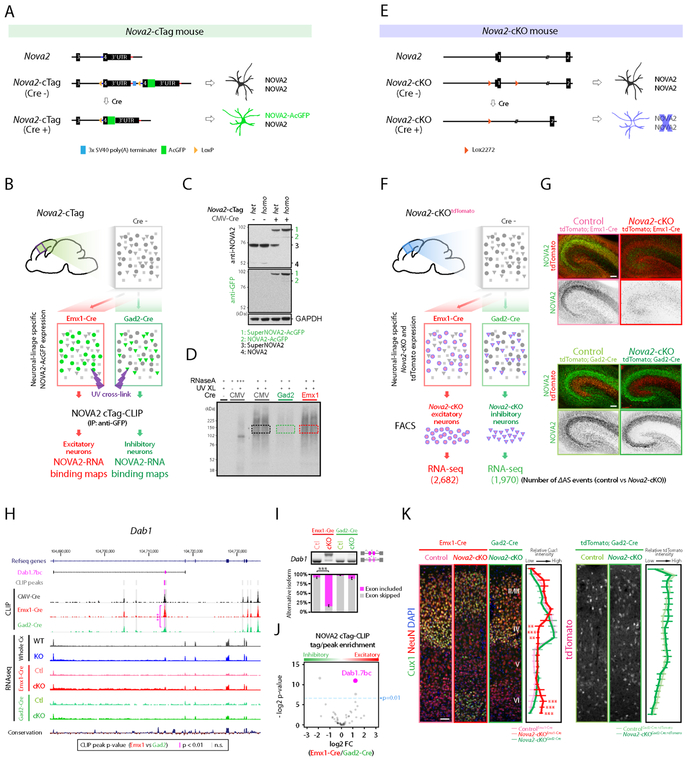
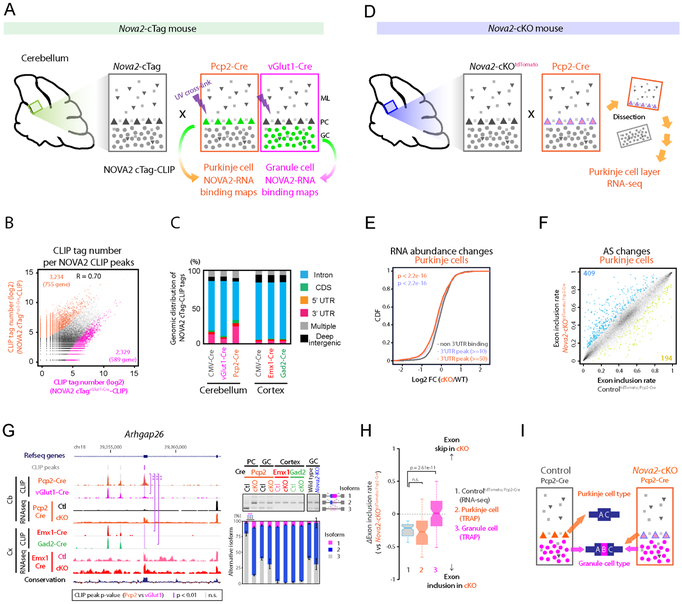
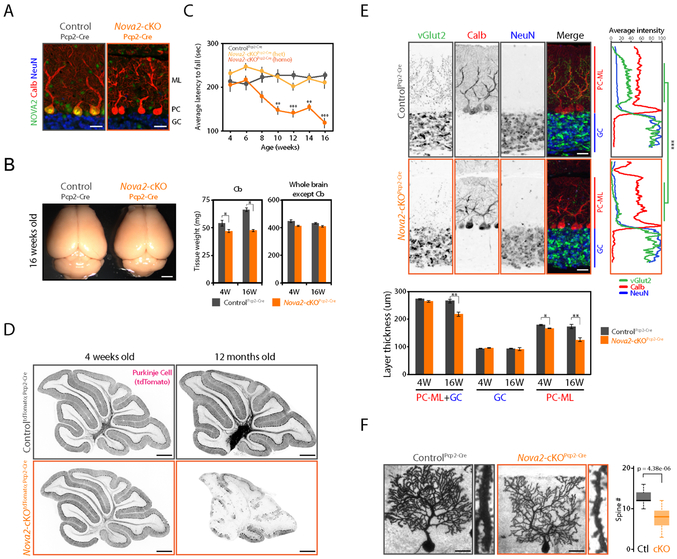
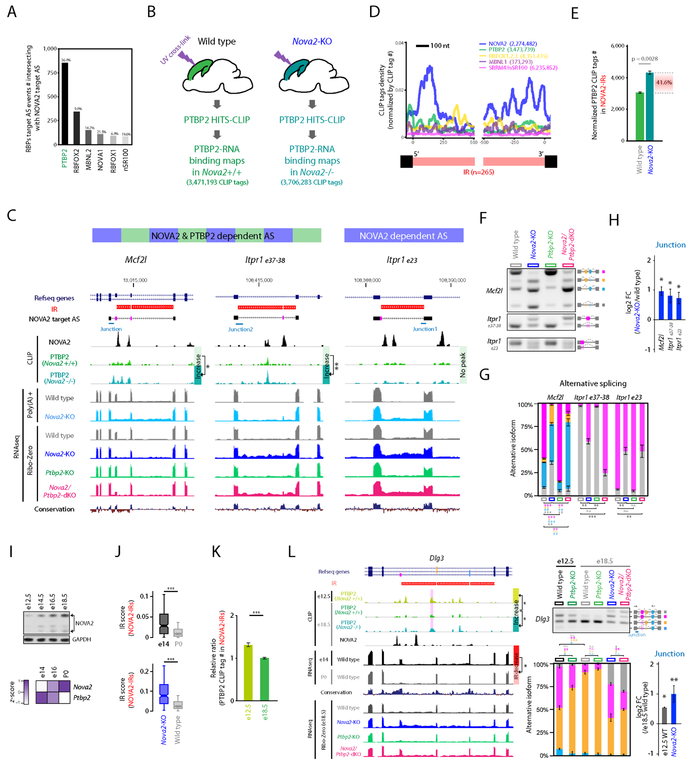
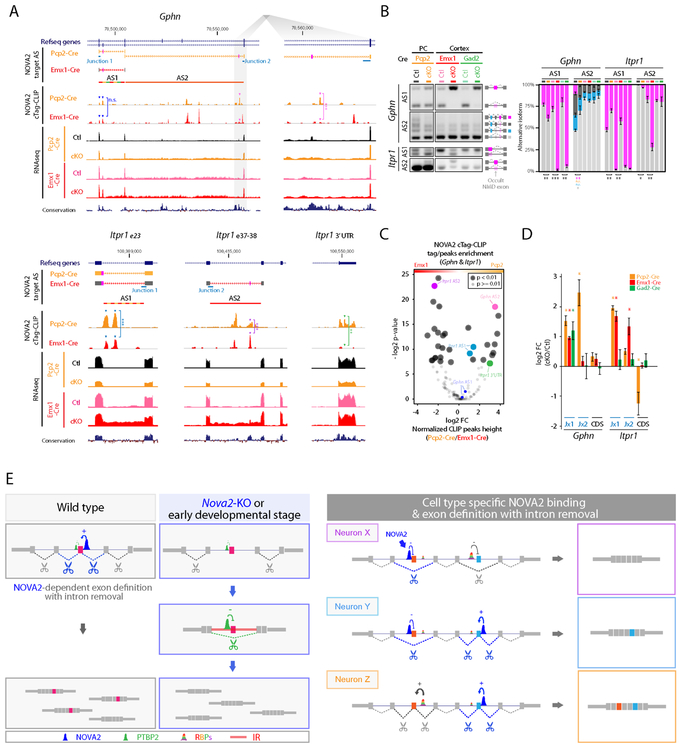
RNA-binding proteins (RBPs) regulate genetic diversity, but the degree to which they do so in individual cell types in vivo is unknown. We developed NOVA2 cTag-crosslinking and immunoprecipitation (CLIP) to generate functional RBP-RNA maps from different neuronal populations in the mouse brain. Combining cell type datasets from Nova2-cTag and Nova2 conditional knockout mice revealed differential NOVA2 regulatory actions on alternative splicing (AS) on the same transcripts expressed in different neurons. This includes functional differences in transcripts expressed in cortical and cerebellar excitatory versus inhibitory neurons, where we find NOVA2 is required for, respectively, development of laminar structure, motor coordination, and synapse formation. We also find that NOVA2-regulated AS is coupled to NOVA2 regulation of intron retention in hundreds of transcripts, which can sequester the trans-acting splicing factor PTBP2. In summary, cTag-CLIP complements single-cell RNA sequencing (RNA-seq) studies by providing a means for understanding RNA regulation of functional cell diversity.

Keywords: CLIP; NOVA2; PTBP2; RNA-binding protein; alternative splicing; cTag-CLIP; conditional knockout mouse; intron retention.


Conflict of interest statement

Declaration of Interests

The authors declare no competing interests.

Figures

Figure 1.
Figure 1.. Diversity of alternative splicing and RNA binding proteins expression within the CNS regions and neuronal types.
(A) AS diversity across the CNS regions and during cortical development. Upper panel shows the schematics illustrating the summary of AS changes determined by RNA-seq data across the mouse CNS regions and during mouse cortical development. The number indicates the significantly changed cassette-type AS event number (FDR<0.05, ∣ΔI∣>=0.1) between two tissues indicated by bidirectional arrows. Lower graph shows the AS event numbers intersecting with the AS events changing in each RBP-KO mouse brain (FDR<0.05, ∣ΔI∣>=0.1). (B) AS diversity between neuronal-types. Schematics illustrating the strategy for AS analysis between two distinct neuronal types prepared from e18.5 cortex of tdTomato reporter mouse which expresses tdTomato in Cre dependent fashion (Left panel). 1,236 AS events were significantly changed between two neuronal types (FDR<0.05, ∣ΔI∣>=0.1). Heatmaps show the excitatory or inhibitory neuron markers enrichment determined by RNA-seq (Upper right). AS event numbers intersecting with AS events changing in each RBP-KO mouse brain (FDR<0.05, ∣ΔI∣>=0.1) (Lower right). (C) RBPs expression diversity within the CNS regions and neuronal types. NOVA2, NOVA1 and RBFOX3 or PTBP2 immunofluorescence staining images in 4 weeks old mouse brain sections. Scale bars: left: 1 mm, middle and right: 50 μm. “See also Figure S1 and Table S1.”
Figure 2.
Figure 2.. Generation of Nova2-cTag and Nova2-cKO mouse models discovering neuronal linage selective NOVA2 AS targets.
(A) Schematics illustrating simplified Nova2-cTag mouse model providing selective AcGFP-tagged NOVA2 expression in specified neuronal-type in vivo. (B) Schematics illustrating the strategy for selective NOVA2 cTag-CLIP in the targeted neuronal type in vivo. (C) Cre-dependent NOVA2-AcGFP protein expression. Indicated mouse brain lysate were subjected to immunoblot analysis with anti-NOVA2 or anti-GFP antibody. SuperNOVA2 is a different NOVA2 isoform translated from the same gene (Saito et al., 2016). (D) Autoradiograph image of neuronal linage specific NOVA2 cTag-CLIP. Colored box regions were subjected to CLIP library cloning steps. (E) Schematics illustrating the Nova2-cKO model providing NOVA2 depletion from selective neuronal type in vivo. (F) Schematics illustrating the strategy for AS analysis in specific neuronal type (FDR<0.05, ∣ΔI∣>=0.1, n=3). (G) NOVA2 depletion from selective neuronal populations. NOVA2 (green) and tdTomato (red) immunofluorescent staining images in the e18.5 hippocampus of indicated 4 mouse lines. Scale bars: 100 μm. (H) UCSC genome browser view of NOVA2-regulated Dab1.7bc AS difference in the different neuronal cell-type. Significantly different CLIP peak between neuron-types was highlighted with magenta shadow. ***; p<0.001. (I) RT-PCR confirmation of Dab1.7bc AS changes detected by RNA-seq (n=3). ***; p<0.001. (J) NOVA2 cTag-CLIP peak enrichment normalized to RNA abundance and functional NOVA2 protein abundance. Each dot indicates an individual NOVA2 CLIP peak on Dab1 transcript; 3 of 53 peaks were significantly different between inhibitory (Gad2-cre) and excitatory (Emx1-Cre) neurons (p<0.01, Fisher’s exact test). (K) Cortical excitatory neuron specific migration defect in Nova2-cKO mice. 3 weeks old indicated mouse lines were subjected to immunostaining. Cux1: layer II-IV marker. Quantification of Cux1 (left) and tdTomato immunointensity (right) (n >= 4, **; p<0.01, ***; p < 0.001). Scale bars: 50 μm. “See also Figure S2 and Table S1.”
Figure 3.
Figure 3.. NOVA2 characterizes Purkinje-type exon skip.
(A) Schematics illustrating the overview for neuronal type specific NOVA2 cTag-CLIP in cerebellum. (B) The comparison of neuronal-type specific NOVA2 cTag-CLIP between Purkinje cells (PCs) and granule cells (GCs). Scatter plot shows the correlation of read counts on CLIP peaks between NOVA2 cTagPcp2-Cre-CLIP to NOVA2 cTagvGlut1-Cre-CLIP. Each black dot represents a comparable CLIP peak between two neuronal-type. Each orange or magenta dot represents a significantly enriched CLIP peak in either NOVA2 cTagPcp2-Cre-CLIP or cTagvGlut1-Cre-CLIP, respectively (FDR<0.05, ∣log2 FC∣>=1). R: correlation coefficient. (C) Genomic distribution of NOVA2 and NOVA2 cTag-CLIP unique tags. (D) Schematics illustrating the strategy for AS analysis in PCs. (E) Transcript abundance changes upon NOVA2 depletion from PCs determined by RNA-seq. The empirical cumulative distribution function of NOVA2 targets binned by NOVA2 cTagPcp2-Cre-CLIP peak tags. (F) AS changes depending on NOVA2 depletion from PCs. Scatter plot shows the exon inclusion rate of the 4 weeks old ControltdTomato; Pcp2-Cre and Nova2-cKOtdTomato; Pcp2-Cre determined by RNA-seq. Each black dot represents a comparative AS event. Each blue or limegreen dot indicates the significantly changed AS event which skipped in Nova2-cKOtdTomato; Pcp2-Cre (409 AS events) or included in Nova2-cKOtdTomato; Pcp2-Cre (194 AS events), respectively (n=3, FDR<0.05, (∣ΔI∣>=0.1). (G) Discovery of a PC-selective NOVA2 mediated AS event. UCSC genome browser view of around Arhgap26 AS exon 21 (NM_175164) (left). A significantly different NOVA2 CLIP peak among neuron-types was highlighted with purple shadow; peaks that were unchanged across all cell types are underscored with grey dotted shadow. RT-PCR confirmation of AS change detected by RNA-seq (right panels) (n=3). **; p<0.01, ***; p<0.001. (H & I) GCs-type exon inclusion in PCs of Nova2-cKO. ΔI of 1; ControltdTomato; Pcp2-Cre PCs layer (RNA-seq), 2; wild-type PCs (TRAP) or 3; wild-type GCs (TRAP; Mellén et al., 2012) versus Nova2-cKOtdTomato; Pcp2-Cre PCs layer (RNA-seq) (H). Schematics illustrating the AS patterns switch from inhibitory PCs-type to excitatory GCs-type in Nova2-cKOtdTomato; Pcp2-Cre PCs (I). “See also Figure S3 and Table S1.”
Figure 4.
Figure 4.. Purkinje cell specific Nova2 deficiency leads progressive motor discoordination and cerebellar atrophy.
(A) Selective NOVA2 depletion from PCs. NOVA2 (green), calbindin D28 (calb, red: PCs marker), and NeuN (blue: GCs marker) immunofluorescent staining images in the 4 weeks old cerebellum of ControlPcp2-Cre and Nova2-cKOPcp2-Cre. Scale bars: 25 μm. (B) Progressive cerebellar atrophy in the PCs specific Nova2-cKO mouse. Brain images of 16 weeks old ControlPcp2-Cre and Nova2-cKOPcp2-Cre mouse (left). Tissue weight of cerebellum and the other brain regions in 4 weeks old (4W) or 16 weeks old (16W) ControlPcp2-Cre and Nova2-cKOPcp2-Cre mouse (right) (n=3, *; p<0.05). Scale bars: 2 mm. (C) Progressive motor coordination defect in the PCs specific Nova2-cKO mouse. Rotarod test result at indicated age (weeks) (n>=5, **; p<0.01, ***; p<0.001). (D) PCs-degradation in the 12 months old PCs specific Nova2-cKO mouse. tdTomato immunostaining images with anti-mRFP antibody. Scale bars: 500 μm. (E) The climbing fiber innervation defect and reduced PCs molecular layer thickness upon PCs specific Nova2 deficiency. vGlut2 (green, climbing fiber terminal marker), calbindin D28 (red, PCs marker), and NeuN (blue, GCs marker) immunofluorescent staining images in the 16 weeks old ControlPcp2-Cre and Nova2-cKOPcp2-Cre mouse (upper left). Quantification analysis of vGlut2, calbindin D28, and NeuN fluorescent (n=3, ***; p<0.001) (upper right). Quantification analysis of GC and PC-ML layer thickness in 4W or 16W ControlPcp2-Cre and Nova2-cKOPcp2-Cre mouse (lower panel) (n=3, *; p<0.05, **; p<0.01). PC-ML: Purkinje cell and molecular layer. GC: granule cell layer. Scale bars: 25 μm. (F) Reduced PCs spine number upon the NOVA2 depletion. Golgi staining images of 16 weeks old ControlPcp2-Cre and Nova2-cKOPcp2-Cre mouse (left). Quantification of spine numbers per 10 nm dendrite length (neurons number >=14 from three biological replicates) (right). Scale bars: 25 μm. “See also Figure S4 and Movie S1.”
Figure 5.
Figure 5.. NOVA2 prevents IR which serves as a cis-acting scaffold element for AS factor PTBP2.
(A) Intersection of NOVA2 and PTBP2 target AS events. The number of RBPs target AS events intersecting with NOVA2 target AS events. (B) Schematics illustrating the overview for PTBP2 CLIP in the presence or absence of NOVA2 in vivo. (C) UCSC genome browser views of examples for PTBP2 CLIP peak changes coupling with IR and AS changes. Magenta shadow represents a NOVA2 and/or PTBP2 target AS exon. PTBP2 CLIP height scale were fixed in same scale between wild type and Nova2-KO. (D) NOVA2 CLIP tags enriched in both 5’ and 3’end of retained introns. (E) IR recruits trans-acting AS regulator PTBP2. PTBP2 CLIP tag number counted on NOVA2-regulated IR (NOVA2-IRs) which were normalized to total PTBP2 CLIP tag number of each replicate (n=3). (F & G) AS difference in Nova2/Ptbp2-dKO which have IR and increased PTBP2 CLIP peak. (H) IR retains exon-intron junction. qPCR quantification of RNA retaining exon-intron junction (n=3, ; p<0.05). (I) NOVA2 expression increases during cortical development at the protein (upper panels: Western blot) and RNA (lower panel: RNAseq) levels; (J and K) those changes in NOVA2 levels in (I) are inversely related to a decrease of NOVA2-regulated IR (NOVA2-IRs) (J) and PTBP2 binding (K) to those NOVA2-IRs (normalized to both total CLIP tag number and abundance of transcript ***: p<0.001). (L) Cortical developmental stage specific PTBP2 target AS coupling to the degree of NOVA2 regulated IR. UCSC genome browser view of Dlg3 transcript (left: significantly different CLIP peak was highlighted with magenta shadow). Quantification of AS (RT-PCR) and exon-junction (qPCR) of Dlg3 transcript (right). N=3, *; p < 0.05, **; p < 0.01, ***: p < 0.001. “See also Figure S5 and Table S1.”
Figure 6.
Figure 6.. NOVA2 prevents neuronal cell-type specific IR and diversify AS regulation.
(A) Neuronal subtype selective and NOVA2-dependent AS changes coupling with IR and NOVA2 cTag-CLIP peak enrichment. UCSC genome browser views of examples (Gphn and Itpr1). **; p<0.01, ***; p<0.001. (B) Quantification of AS difference by RT-PCR (n=3, *; p<0.05, **; p<0.01, ***; p<0.001). (C) NOVA2 cTag-CLIP peak enrichment normalized to RNA abundance and functional NOVA2 protein abundance. Each dot indicates an individual NOVA2 CLIP peak on either the Gphn or Itpr1 transcript (as for Figure 3I; p<0.01, Fisher’s exact test). (D) Cell type selective IR retains exon-intron junction. Quantification of transcripts or it retaining exon-intron junction by qPCR (n=3, *; p<0.05). Orange; Purkinje cells, red; cortical excitatory neurons, green; cortical inhibitory neurons. (E) Model Schematics for neuronal subtype specific AS and its regulatory mechanism. NOVA2 regulates exon definition and IR, which serves as a platform for trans-acting AS regulators (left). NOVA2 cTag-CLIP revealed different NOVA2 binding positions on the same transcripts in different neuronal cell-types in which NOVA2 regulates cell-type specific AS and promotes cell-type specific intron removal (right). This cell-type specific IR removal can alter other RBPs binding to intron and exon definition. “See also Figure S6.”

References

    1. Amara SG, Jonas V, Rosenfeld MG, Ong ES, and Evans RM (1982). Alternative RNA processing in calcitonin gene expression generates mRNAs encoding different polypeptide products. Nature 298, 240–244 - PubMed
    1. Braun JC, Stanciu M, Boutz LP, Patterson CJ, Calligaris D, Higuchi F, Neupane R, Fenoglio S, Cahill PD, Wakimoto H, Agar YRN, Yaffe BM, Sharp AP, Hemann TM, Lees AJ (2017) Coordinated Splicing of Regulatory Detained Introns within Oncogenic Transcripts Creates an Exploitable Vulnerability in Malignant Glioma. Cancer Cell, 32, 411–426 - PMC - PubMed
    1. Braunschweig U, Barbosa-Morais NL, Pan Q, Nachman EN, Alipanahi B, Gonatopoulos-Pournatzis T, Frey B, Irimia M, and Blencowe BJ (2014). Widespread intron retention in mammals functionally tunes transcriptomes. Genome Res. 24, 1774–1786 - PMC - PubMed
    1. Bray NL, Pimentel H, Melsted P, and Pachter L (2016). Near-optimal probabilistic RNA-seq quantification. Nat. Biotechnol 34, 525–527 - PubMed
    1. Buckanovich RJ, and Darnell RB (1997). The neuronal RNA binding protein Nova-1 recognizes specific RNA targets in vitro and in vivo. Mol. Cell. Biol 17, 3194–3201 - PMC - PubMed

Publication types

MeSH terms