

Child and Adolescent Sugar-Sweetened Beverage Intakes Are Longitudinally Associated with Higher Body Mass Index z Scores in a Birth Cohort Followed 17 Years
- PMID: 30638821
- PMCID: PMC6389369
- DOI: 10.1016/j.jand.2018.11.003
Child and Adolescent Sugar-Sweetened Beverage Intakes Are Longitudinally Associated with Higher Body Mass Index z Scores in a Birth Cohort Followed 17 Years
Abstract
Background: Sugar-sweetened beverages (SSB) are considered a risk factor for obesity.
Objective: The objective of the current study was to investigate associations between the predictors of beverage and energy intakes and mean adequacy ratios (MARs), and the outcome of body mass index (BMI) z scores, in a birth cohort using longitudinal models.
Design: This was a longitudinal analysis of secondary data.
Participants/setting: Participants in the Iowa Fluoride and Iowa Bone Development Studies with two beverage intake questionnaires completed between ages 2 and 4.7 years or 5 and 8.5 years or one questionnaire between ages 9 and 10.5, 11 and 12.5, 13 and 14.5, or 15 and 17 years (n=720); two food and beverage diaries completed between ages 2 and 4.7 years or 5 and 8.5 years or completion of the Block's Kids' Food Frequency Questionnaires at age 11, 13, 15, or 17 years (n=623); and anthropometric measures at the corresponding age 5-, 9-, 11-, 13-, 15-, or 17-year examination(s).
Predictors: Mean daily 100% juice, milk, SSB, water/sugar-free beverage, and energy intakes and MARs averaged over ages 2 to 4.7, 5 to 8.5, 9 to 10.5, 11 to 12.5, 13 to 14.5, or 15 to 17 years were predictors.
Outcome: BMI z score was the outcome.
Statistical analyses: Linear mixed models were fit for each beverage, energy, and MAR variable, with the beverage, energy, or MAR variable as the predictor and BMI z score as the outcome. Beverage models were adjusted for energy and MAR and baseline socioeconomic status.
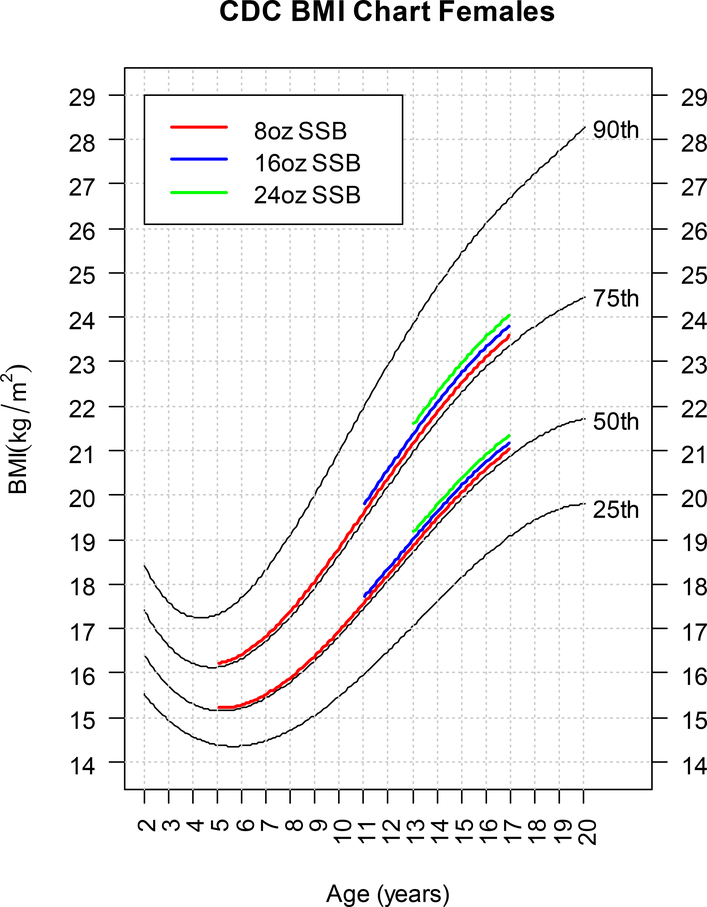
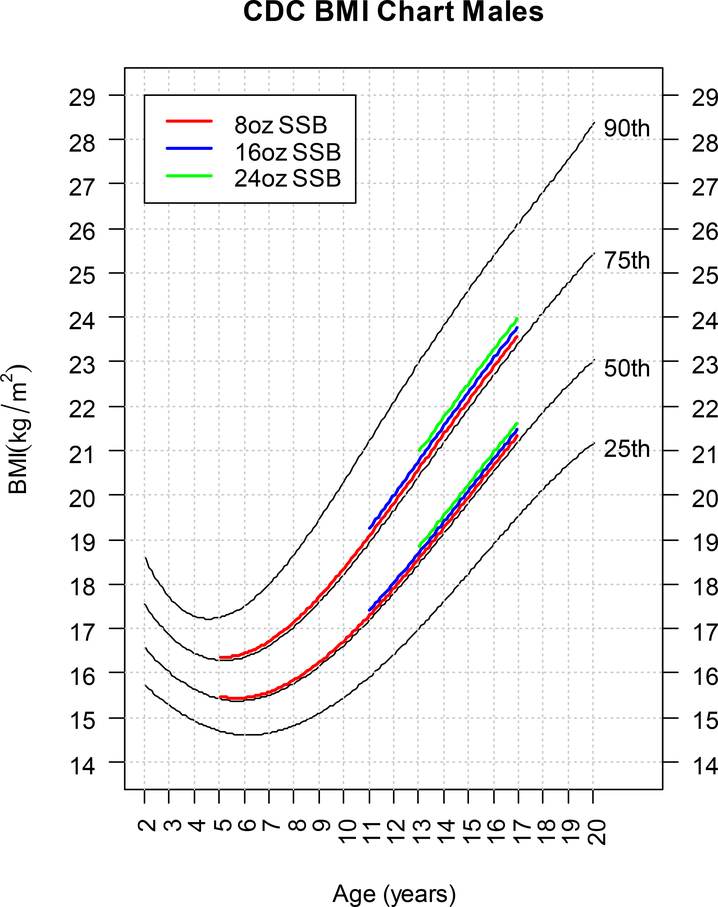
Results: SSB intake adjusted for energy intake, MAR, and baseline socioeconomic status was associated with BMI z score; each additional 8 oz SSB consumed/day throughout childhood and adolescence increased the BMI z score an average 0.050 units (95% CI 0.022 to 0.079; P=0.001). Adjusted water/sugar-free beverage intake (0.026 units; 95% CI 0.006 to 0.046; P=0.013) was modestly associated with BMI z score, while 100% juice (-0.001 units; 95% CI -0.059 to 0.057; P=0.97) and milk (0.022 units; 95% CI -0.007 to 0.052; P=0.13) intakes were not associated with BMI z scores.
Conclusions: Higher SSB intakes were associated with increased BMI z scores throughout childhood and adolescence in Iowa Fluoride Study participants. Public health initiatives targeting SSB consumption during childhood and adolescence remain relevant.
Trial registration: ClinicalTrials.gov NCT03547128.
Keywords: BMI z score; Beverage; Energy; Sugar-sweetened beverages.
Copyright © 2019 Academy of Nutrition and Dietetics. Published by Elsevier Inc. All rights reserved.
Conflict of interest statement
Figures
Similar articles
-
Beverage Intakes and Toothbrushing During Childhood Are Associated With Caries at Age 17 Years.J Acad Nutr Diet. 2021 Feb;121(2):253-260. doi: 10.1016/j.jand.2020.08.087. Epub 2020 Oct 24. J Acad Nutr Diet. 2021. PMID: 33109505 Free PMC article.
-
Beverage Consumption Patterns at Age 13 to 17 Years Are Associated with Weight, Height, and Body Mass Index at Age 17 Years.J Acad Nutr Diet. 2017 May;117(5):698-706. doi: 10.1016/j.jand.2017.01.010. Epub 2017 Mar 2. J Acad Nutr Diet. 2017. PMID: 28259744 Free PMC article.
-
Beverage intake among preschool children and its effect on weight status.Pediatrics. 2006 Oct;118(4):e1010-8. doi: 10.1542/peds.2005-2348. Pediatrics. 2006. PMID: 17015497
-
Substituting sugar-sweetened beverages with water or milk is inversely associated with body fatness development from childhood to adolescence.Nutrition. 2015 Jan;31(1):38-44. doi: 10.1016/j.nut.2014.04.017. Epub 2014 May 9. Nutrition. 2015. PMID: 25441586 Review.
-
Unhealthy Food and Beverage Consumption in Children and Risk of Overweight and Obesity: A Systematic Review and Meta-Analysis.Adv Nutr. 2022 Oct 2;13(5):1669-1696. doi: 10.1093/advances/nmac032. Adv Nutr. 2022. PMID: 35362512 Free PMC article.
Cited by
-
Beverage behaviors and correlates among Head Start preschooler-parent dyads.Matern Child Health J. 2022 Nov;26(11):2271-2282. doi: 10.1007/s10995-022-03493-4. Epub 2022 Sep 20. Matern Child Health J. 2022. PMID: 36125670
-
Health-Related Behaviors and Perceived Health Status According to Water and Sugar-Sweetened Beverage Intake in Korean Adolescents.Nutrients. 2024 Sep 9;16(17):3038. doi: 10.3390/nu16173038. Nutrients. 2024. PMID: 39275353 Free PMC article.
-
Association of Sugar-Sweetened Beverage Consumption and Moderate-to-Vigorous Physical Activity with Childhood and Adolescent Overweight/Obesity: Findings from a Surveillance Project in Jiangsu Province of China.Nutrients. 2023 Sep 27;15(19):4164. doi: 10.3390/nu15194164. Nutrients. 2023. PMID: 37836448 Free PMC article.
-
Food insecurity and consumption of cariogenic foods in mothers and their two-year-old children in Appalachia.J Public Health Dent. 2023 Jun;83(2):127-135. doi: 10.1111/jphd.12559. Epub 2023 Jan 25. J Public Health Dent. 2023. PMID: 36695472 Free PMC article.
-
Impact of Soft Drink Intake on Bone Development and Risk of Fractures in a Danish Cohort of Schoolchildren.Children (Basel). 2024 Dec 30;12(1):43. doi: 10.3390/children12010043. Children (Basel). 2024. PMID: 39857874 Free PMC article.
References
-
- Buscot MJ, Thomson RJ, Juonala M, Sabin MA, Burgner DP, Lehtimäki T, et al., BMI trajectories associated with resolution of elevated youth BMI and incident adult obesity. Pediatrics. 2018; 141(1):e20172003. - PubMed
-
- Centers for Disease Control and Prevention. Get the facts: sugar-sweetened beverages and consumption. Available at: https://www.cdc.gov/nutrition/data-statistics/sugar-sweetened-beverages-... Accessed 7/26/18.
Publication types
MeSH terms
Associated data
Grants and funding
LinkOut - more resources
Full Text Sources
Medical
Miscellaneous
