

Peptidase inhibitor 15 as a novel blood diagnostic marker for cholangiocarcinoma
- PMID: 30638862
- PMCID: PMC6414306
- DOI: 10.1016/j.ebiom.2018.12.063
Peptidase inhibitor 15 as a novel blood diagnostic marker for cholangiocarcinoma
Abstract
Background: We aimed to screen a specific secretory protein that could serve as blood diagnostic marker for cholangiocarcinoma (CCA).
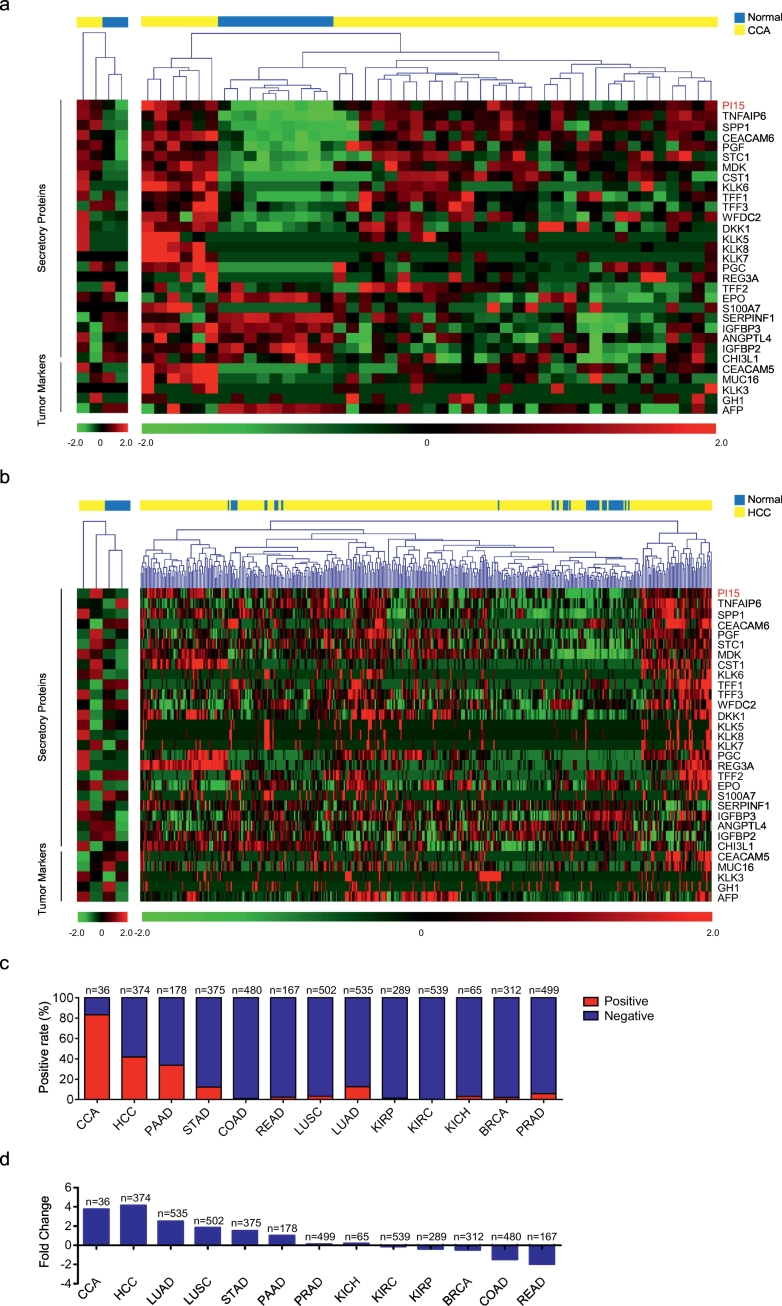
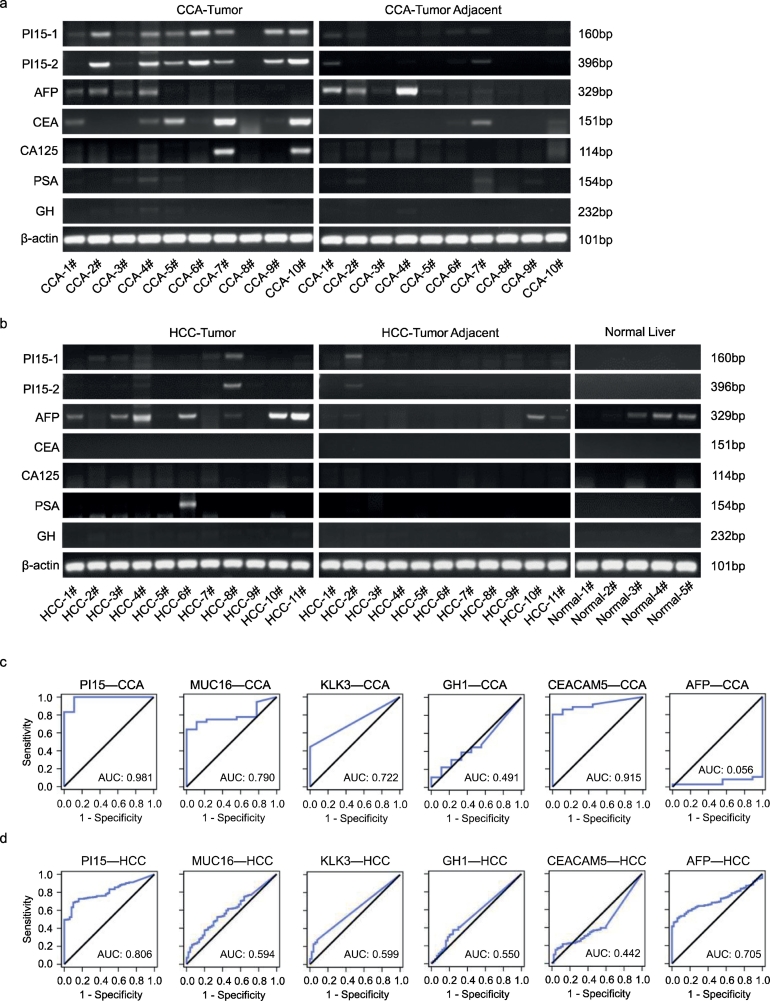
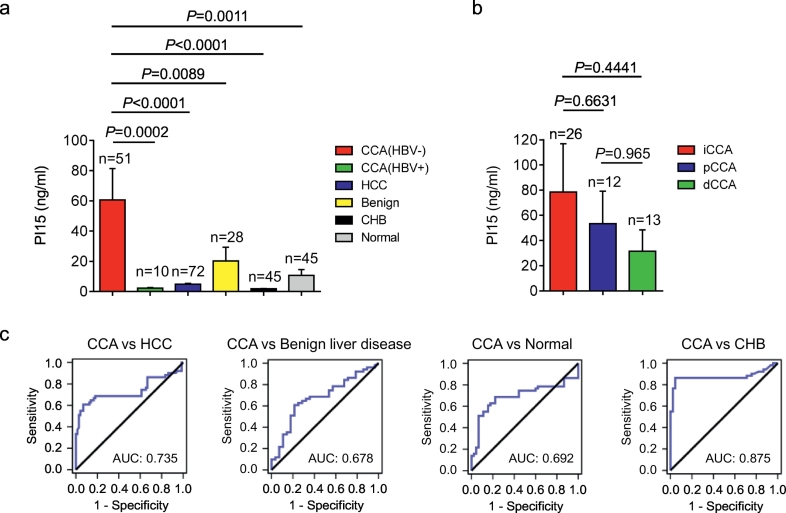
Methods: Starting with the analysis of gene expression profiles in tumor tissues and matched normal tissues from cases with CCA and hepatocellular carcinoma (HCC), we identified peptidase inhibitor 15 (PI15) was a potential diagnostic marker for CCA. We demonstrated PI15 expression levels in CCA, HCC, and normal liver tissues. Furthermore, quantitative enzyme-linked immunosorbent assay (ELISA) assessed plasma PI15 levels in CCA (n = 61), HCC (n = 72), benign liver disease (n = 28), chronic hepatitis B (CHB) patients (n = 45), and healthy individuals (n = 45). The diagnostic value of PI15 was estimated by the area under the receiver operating characteristic (ROC) curve (AUC).
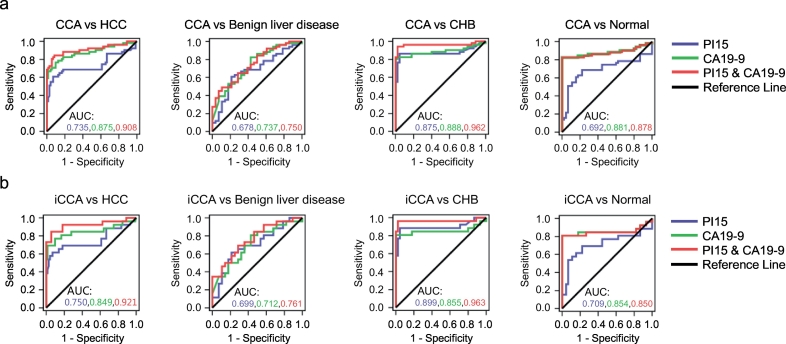
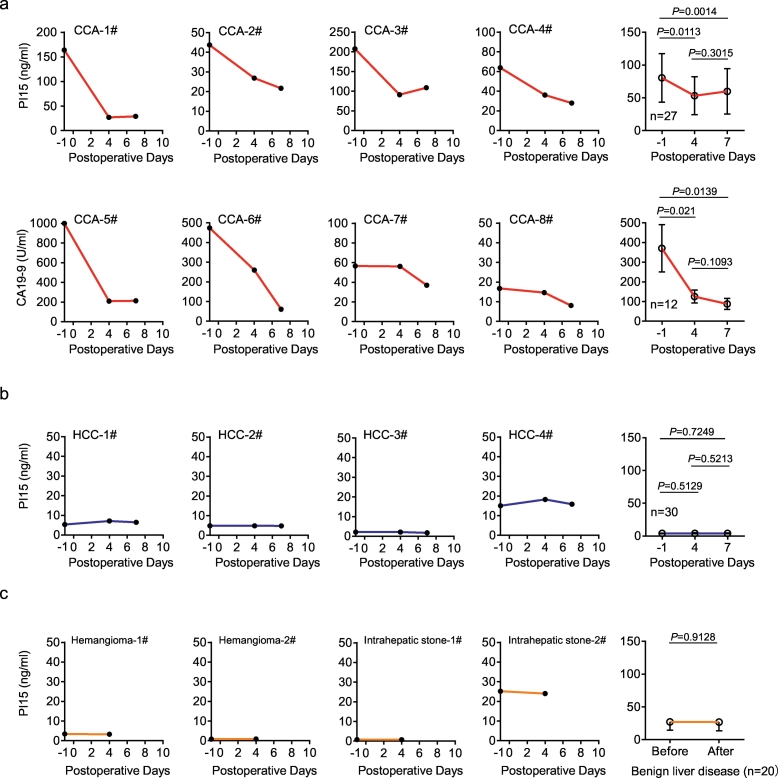
Findings: The positive rate of PI15 expression was 70% in CCA and only 9.1% in HCC; PI15 was not detected in normal liver tissue. High levels of plasma PI15 were evident in CCA patients, whereas only low levels were observed in cases involving HCC, benign liver disease, CHB patients, and healthy individuals. Plasma PI15 levels in CCA patients were obviously reduced (p = .0014) after surgery. The AUC of plasma PI15 for discriminating between CCA and HCC was 0.735. Furthermore, with a specificity of 94.44%, the combination of CA19-9 (>98.5 U/ml) and PI15 (>13 ng/ml) yielded a sensitivity of 80.39% for CCA and HCC.
Interpretation: PI15 exhibits promise as a novel marker for predicting the diagnosis and follow-up of CCA patients. FUND: Natural Science Research Foundation of Anhui Province and Natural Science Foundation of China.
Keywords: Biomarker; Blood diagnosis; Cholangiocarcinoma; PI15.
Copyright © 2018. Published by Elsevier B.V.
Figures
Similar articles
-
Serum ITIH5 as a novel diagnostic biomarker in cholangiocarcinoma.Cancer Sci. 2024 May;115(5):1665-1679. doi: 10.1111/cas.16143. Epub 2024 Mar 12. Cancer Sci. 2024. PMID: 38475675 Free PMC article.
-
Meta-analysis of gene expression profiles identifies differential biomarkers for hepatocellular carcinoma and cholangiocarcinoma.Tumour Biol. 2016 Sep;37(9):12755-12766. doi: 10.1007/s13277-016-5186-8. Epub 2016 Jul 22. Tumour Biol. 2016. PMID: 27448818
-
Meta-analysis of the diagnostic value of Wisteria floribunda agglutinin-sialylated mucin1 and the prognostic role of mucin1 in human cholangiocarcinoma.BMJ Open. 2019 Jan 29;9(1):e021693. doi: 10.1136/bmjopen-2018-021693. BMJ Open. 2019. PMID: 30700476 Free PMC article.
-
Circulating Biomarkers for Cholangiocarcinoma.Dig Dis. 2018;36(4):281-288. doi: 10.1159/000488342. Epub 2018 May 15. Dig Dis. 2018. PMID: 29807369 Review.
-
Biomarkers for the Diagnosis of Cholangiocarcinoma: A Systematic Review.Am J Trop Med Hyg. 2018 Jun;98(6):1788-1797. doi: 10.4269/ajtmh.17-0879. Epub 2018 Apr 5. Am J Trop Med Hyg. 2018. PMID: 29637880 Free PMC article.
Cited by
-
Effective Prediction of Prostate Cancer Recurrence through the IQGAP1 Network.Cancers (Basel). 2021 Jan 23;13(3):430. doi: 10.3390/cancers13030430. Cancers (Basel). 2021. PMID: 33498739 Free PMC article.
-
Diagnostic and Prognostic Significance of Keap1 mRNA Expression for Lung Cancer Based on Microarray and Clinical Information from Oncomine Database.Curr Med Sci. 2021 Jun;41(3):597-609. doi: 10.1007/s11596-021-2378-2. Epub 2021 Jun 25. Curr Med Sci. 2021. PMID: 34169426
-
Prediction of Adrenocortical Carcinoma Relapse and Prognosis with a Set of Novel Multigene Panels.Cancers (Basel). 2022 Jun 5;14(11):2805. doi: 10.3390/cancers14112805. Cancers (Basel). 2022. PMID: 35681785 Free PMC article.
-
Investigation of the miRNA and mRNA Coexpression Network and Their Prognostic Value in Hepatocellular Carcinoma.Biomed Res Int. 2020 Nov 12;2020:8726567. doi: 10.1155/2020/8726567. eCollection 2020. Biomed Res Int. 2020. PMID: 33274225 Free PMC article.
-
Gastric Cancer Pre-Stage Detection and Early Diagnosis of Gastritis Using Serum Protein Signatures.Molecules. 2022 Apr 30;27(9):2857. doi: 10.3390/molecules27092857. Molecules. 2022. PMID: 35566209 Free PMC article.
References
-
- Sia D., Villanueva A., Friedman S.L., Llovet J.M. Liver cancer cell of origin, molecular class, and effects on patient prognosis. Gastroenterology. 2017;152(4):745–761. - PubMed
-
- Bridgewater J., Galle P.R., Khan S.A. Guidelines for the diagnosis and management of intrahepatic cholangiocarcinoma. J Hepatol. 2014;60(6):1268–1289. - PubMed
-
- Moeini A., Sia D., Bardeesy N., Mazzaferro V., Llovet J.M. Molecular pathogenesis and targeted therapies for intrahepatic cholangiocarcinoma. Cancer Res. 2016;22(2):291–300. Clinical cancer Res. - PubMed
-
- Charatcharoenwitthaya P., Enders F.B., Halling K.C., Lindor K.D. Utility of serum tumor markers, imaging, and biliary cytology for detecting cholangiocarcinoma in primary sclerosing cholangitis. Hepatology. 2008;48(4):1106–1117. - PubMed
MeSH terms
Substances
LinkOut - more resources
Full Text Sources
Medical
Molecular Biology Databases
