. 2019 Feb:40:488-503.
doi: 10.1016/j.ebiom.2018.12.056. Epub 2019 Jan 9.

LRH1-driven transcription factor circuitry for hepatocyte identity: Super-enhancer cistromic analysis

Affiliations

LRH1-driven transcription factor circuitry for hepatocyte identity: Super-enhancer cistromic analysis

Min Sung Joo et al. EBioMedicine. 2019 Feb.

Abstract

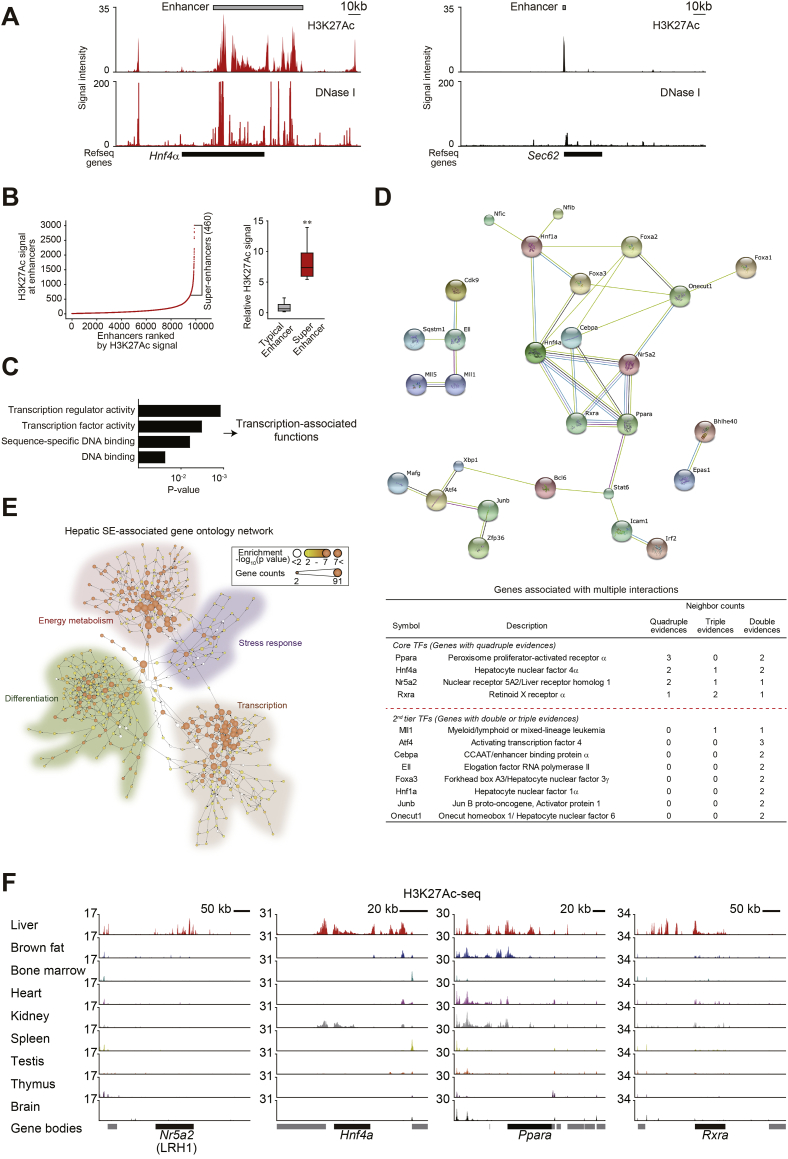
Background: The injured liver loses normal function, with concomitant decrease of key identity genes. Super-enhancers contribute to mammalian cell identity. Here, we identified core transcription factors (TFs) that are active in hepatocytes, using genome-wide analysis and hierarchical ordering of super-enhancer distribution.

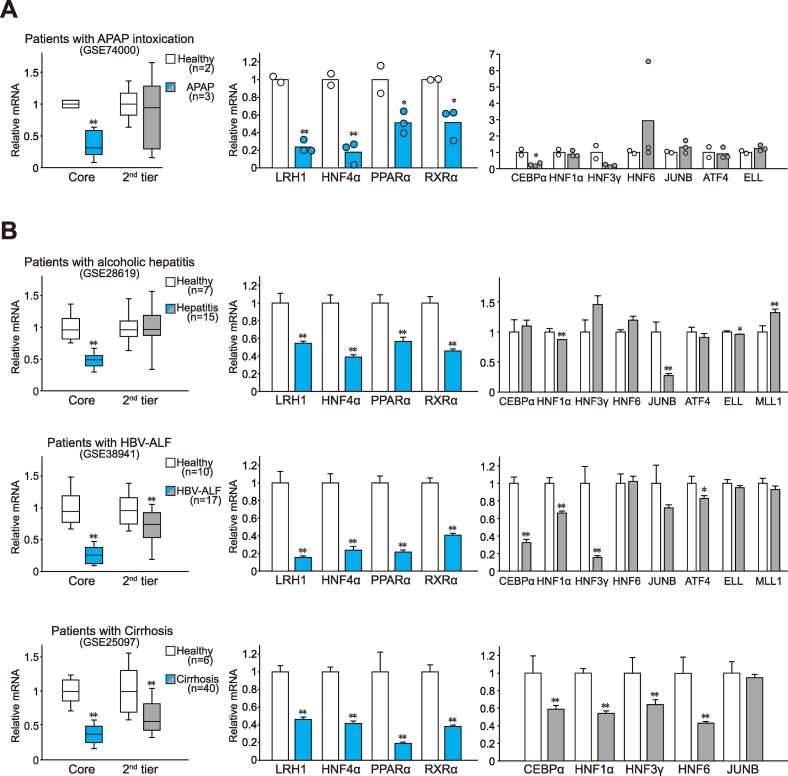
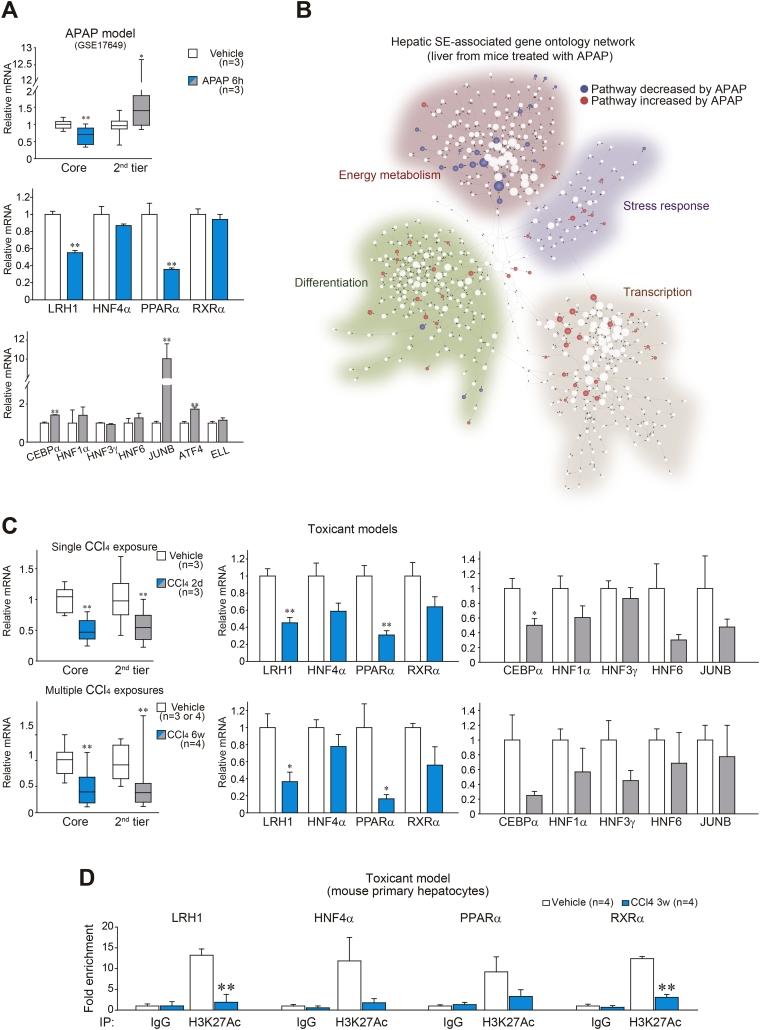
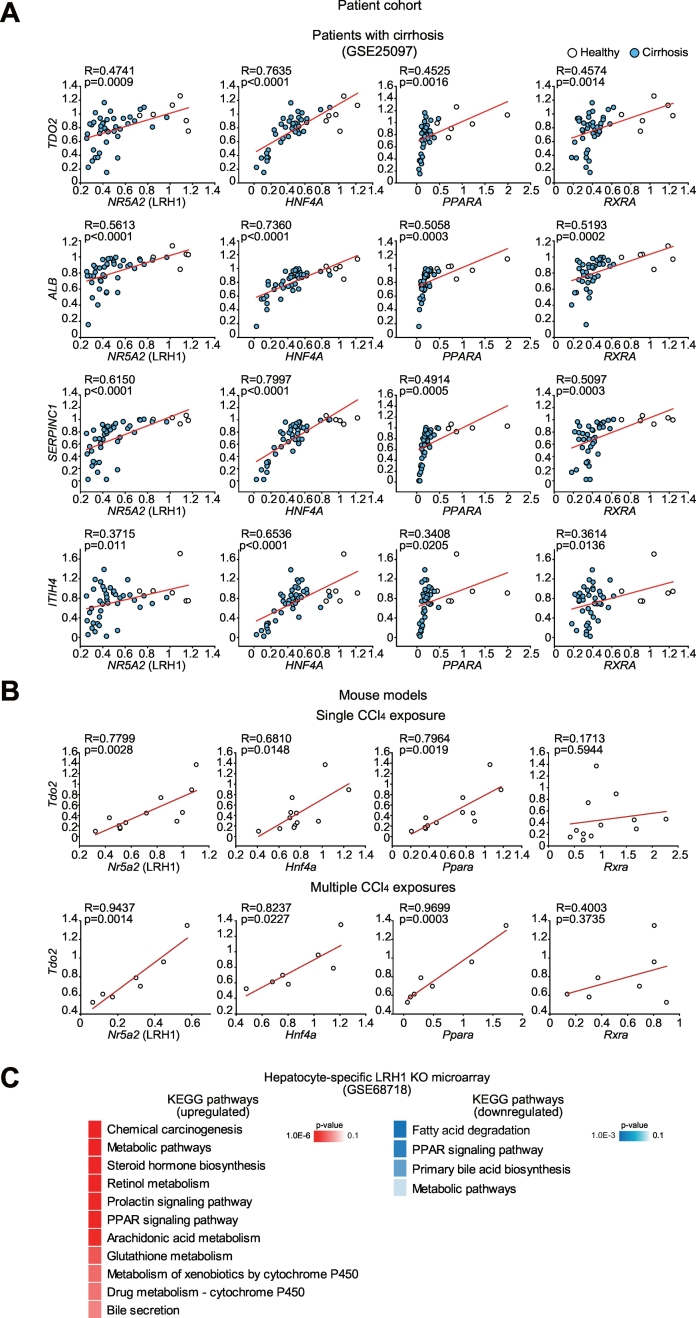
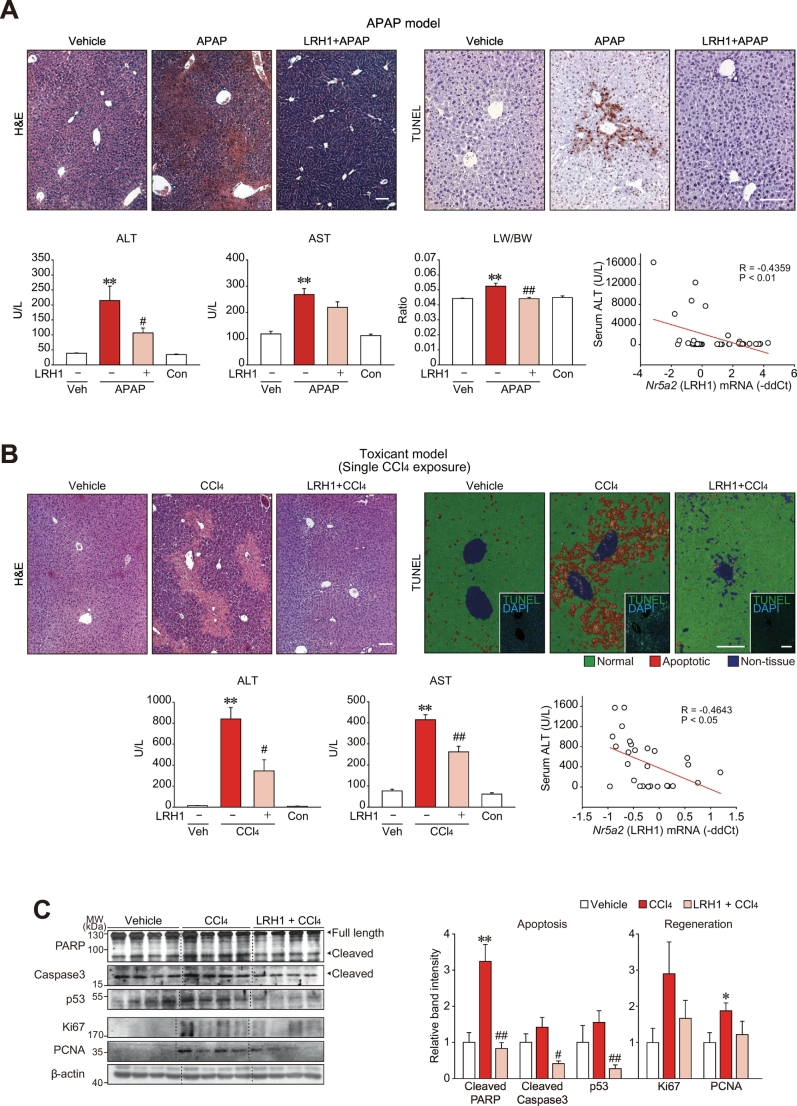
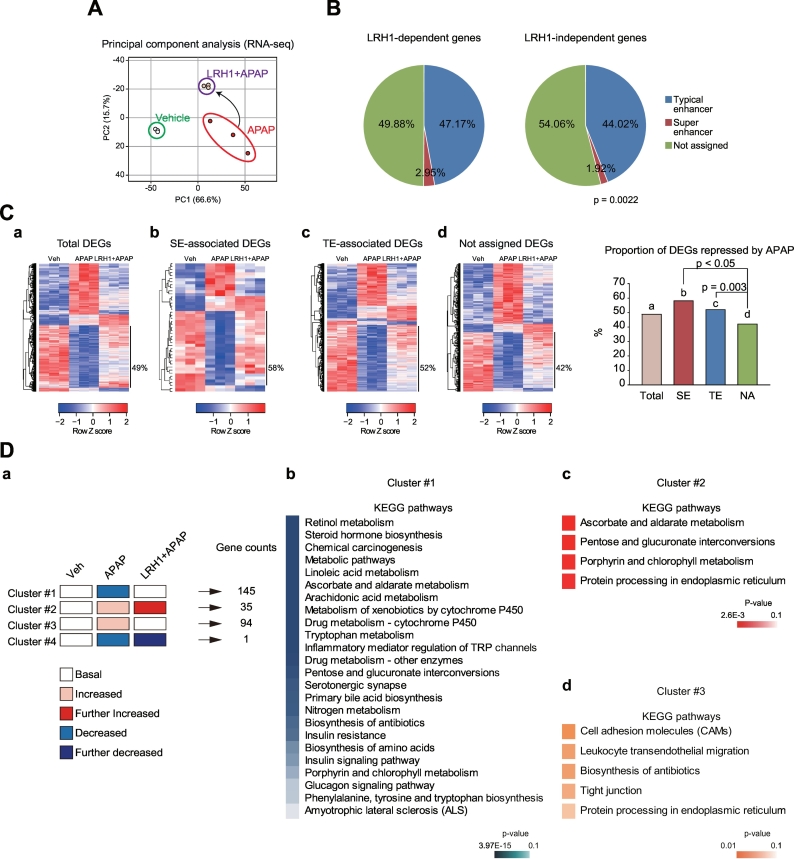
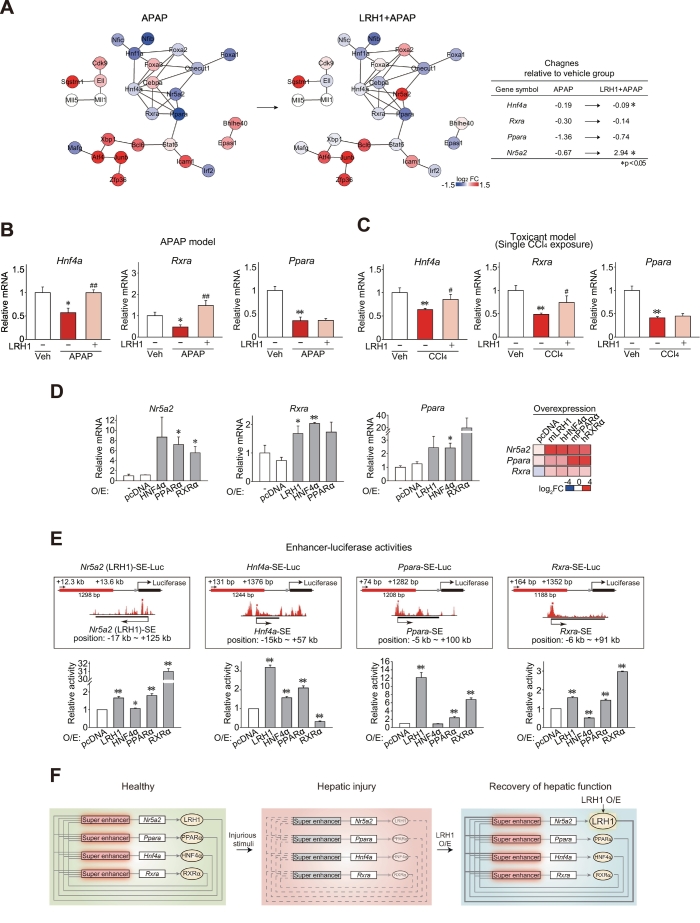
Methods: Expression of core TFs was assessed in a cohort of patients with hepatitis or cirrhosis and animal models. Quantitative PCR, chromatin immunoprecipitation assays, and hydrodynamic gene delivery methods were used to assess gene regulation and hepatocyte viability. RNA-sequencing data were generated to investigate the role of LRH1 in hepatocyte protection from injury.

Results: Network analysis of super-enhancer-associated gene interactions and expression arrays for cohorts of patients with hepatitis and cirrhosis enabled us to identify a super-enhancer-associated network, and LRH1, HNF4α, PPARα, and RXRα as core TFs. In mouse models, expression of core TFs was robustly inhibited by single and multiple challenge(s) with liver toxicant. RNA-seq analysis revealed changes in expression in the super-enhancer-associated genes sensitively biased toward repression by intoxication. LRH1 gene delivery prevented the loss of hepatic super-enhancer-associated signaling circuitry in toxicant-challenged mice, and protected the liver from injury, indicating the role of LRH1 in hepatocyte identity and viability. In hepatocytes, overexpression of each core TF promoted induction of other TFs.

Conclusion: Overall, this study identified LRH1-driven pathway as a circuitry responsible for hepatocyte identity by using cistromic analysis, improving our understanding of liver pathophysiology and identifying novel therapeutic targets.

Keywords: Acetaminophen; Acute liver injury; LRH1; Liver disease; Super-enhancer.


Figures

Fig. 1
Fig. 1
The core TFs identified in the liver. (A) H3K27Ac ChIP-seq and DNase-seq profiles at the Hnf4a (left) and the Sec62 (right) loci in mouse liver. Gray bars indicate enhancer regions. (B) Distribution of H3K27Ac ChIP-seq signal intensities across 9891 enhancers in the liver. H3K27Ac occupancy was not evenly distributed across the enhancer regions, with a subset of 460 enhancers containing exceptionally high amounts of H3K27Ac (i.e., super-enhancers) (left). A box plot of H3K27Ac ChIP-seq densities at constituent enhancers within 9431 typical enhancers or 460 super-enhancers (right). (C) Gene ontology (GO) functional categories regarding molecular functions for super-enhancer-associated genes. Genes encoding for the factors controlling transcription were enriched. (D) A protein-protein interaction network of super-enhancer-associated transcription factors (TFs) according to STRING database. LRH1 (also known as Nr5a2), HNF4α, PPARα, and RXRα make a core network. The TFs were divided into two groups (multiple interactions with quadruple evidences and multiple interactions with double or triple evidences) according to the number of evidences in the above network. The red dotted line designates the cutoff dividing core and second-tier TFs. (E) A network displaying interactions between GO categories. Each node indicates GO term. The thickness of node colour represents the degree of statistical significance for enrichment. Node sizes show the number of gene counts assigned to each GO term. The network was generated by analysis of Cytoscape plugin BiNGO. (F) H3K27Ac ChIP-seq data at the loci of Nr5a2 (LRH1), Hnf4a, Ppara, and Rxra. (For interpretation of the references to colour in this figure legend, the reader is referred to the web version of this article.)
Fig. 2
Fig. 2
Loss of core TFs in the liver of patients with hepatitis or cirrhosis from various etiologies. (A–B) Averages of the core or the second tier of TF transcript levels in the liver of patients with acetaminophen (APAP) intoxication (A), alcoholic hepatitis, hepatitis B virus-induced acute liver failure (HBV-ALF), or cirrhosis (B). Data were extracted from GSE74000 (quantile normalization), GSE28619 [Gene Chip Robust Multiarray Averaging (GC-RMA) normalization], GSE38941 (RMA normalization), and GSE25097 (RMA normalization). Gene expression changes were calculated relative to the respective healthy liver group included in each dataset. Data information: For left of A and B, data were shown as box and whisker plot (significantly different as compared with healthy donors: *P < .05; **P < .01). Box, IQR; whiskers, 5–95 percentiles; and horizontal line within box, median. For middle and right of A and B, data represent the means ± SEM (significantly different as compared with healthy donors: *P < .05; **P < .01). Group sizes (n) are denoted in each figure.
Fig. 3
Fig. 3
Loss of core TFs in mouse liver disease models. (A) TF transcript levels in the liver of mice treated with APAP. Data were extracted from GSE17649 (Affymetrix global scaling normalization). Gene expression changes in liver were calculated relative to vehicle-treated group. (B) Hepatic super-enhancer-associated GO network displaying RNA-seq expression data from the liver of mice treated with APAP. Decreased or increased pathways were depicted as a blue or red node, respectively. RNA-seq data were generated using the mouse liver tissues obtained six h after APAP treatment. RNA-seq data are deposited in the GEO under accession number GSE104302. (C) TF transcript levels in the injured liver of mice. The mice were sacrificed two days after a single injection of CCl4, or multiple injections of CCl4 for six weeks. (D) ChIP assays. Crosslinked protein–DNA complexes were immunoprecipitated using anti-H3K27Ac antibody or preimmune-IgG (negative control) in primary hepatocytes isolated from mice treated with vehicle or CCl4 for three weeks. qPCR assays were done to quantify DNAs in the immunoprecipitates using specific primers for each super-enhancer region. Data information: For upper panel of A and left of C, data were shown as box and whisker plot (significantly different as compared with vehicle-treated control, *P < .05; **P < .01). Box, IQR; whiskers, 5–95 percentiles; and horizontal line within box, median. For lower panels of A and middle and right of C, data represent the means ± SEM (significantly different as compared with vehicle-treated controls, *P < .05; **P < .01). Group sizes (n) are denoted in each figure. For D, data represent the means ± SEM (n = 4 each, significantly different as compared to vehicle control, **P < .01). (For interpretation of the references to colour in this figure legend, the reader is referred to the web version of this article.)
Fig. 4
Fig. 4
Correlation between identified core TF and each gene transcript levels. (A) Correlation analyses in a large cohort of cirrhosis patients (GSE25097) (N = 46). Pearson's r correlation coefficients with corresponding P-values for co-variation between each core TF mRNA levels (x axis) and hepatocyte identity gene transcripts (y axis) show robust correlations. (B) Pearson correlation analyses in mice treated as in Fig. 3C. For single and multiple CCl4 treatment models, group sizes (N) are 12 and 7, respectively. (C) Results of KEGG pathway analysis of the up- or down-regulated genes after hepatocyte-specific deletion of LRH1 (GSE68718). Enriched signaling pathways of each gene cluster were analyzed using DAVID.
Fig. 5
Fig. 5
LRH1 protection of the liver from toxicant-induced injury. (A) LRH1 protection of the liver from APAP-induced injury. H&E staining (upper left). At four days after a hydrodynamic injection of the plasmid encoding LRH1 or mock vector (pcDNA3.1), mice were fasted overnight and subjected to a single dose of APAP (300 mg/kg), and the liver tissues were obtained six h afterward. TUNEL staining (upper right). The scale bars represent 100 μm. Serum ALT and AST activities (lower left). Liver weight per body weight ratio (middle). Correlation between serum ALT activities and LRH1 transcript levels in the liver (lower right). (B) LRH1 protection of the liver from CCl4-induced injury. H&E staining (upper left). Mice were subjected to a single dose of CCl4 (0.6 mL/kg) four days after a hydrodynamic injection of the plasmid encoding LRH1 or mock vector (pcDNA3.1), and the liver tissues were obtained two days afterward. TUNEL staining (upper right). TUNEL-stained tissues were separated to non-tissue, normal and apoptotic areas by blue, green and red colors, respectively. Insets showed true-colour images. The scale bars represent 100 μm. Serum ALT and AST activities (lower left). Correlation between serum ALT activities and LRH1 (Nr5a2) mRNA levels in the liver (lower right). (C) Immunoblottings for apoptosis or liver regeneration markers (left). Values were obtained using scanning densitometry (right). Data information: For A, data represent the means ± SEM (Mock+Veh, n = 7; Mock+APAP, n = 8; LRH1 + APAP, n = 13; and non-injected control (Con), n = 5, significantly different as compared to vehicle control, **P < .01; or APAP-treated control, #P < .05; ##P < .01). For B, data represent the means ± SEM (Mock+Veh, n = 6; Mock+CCl4, n = 14; LRH1 + CCl4, n = 4; and non-injected control (Con), n = 4, significantly different as compared to vehicle control, **P < .01; or CCl4-treated control: #P < .05; ##P < .01). For C, data represent the means ± SEM (n = 4 each, significantly different as compared to vehicle control, *P < .05; **P < .01; or CCl4-treated control: #P < .05; ##P < .01). (For interpretation of the references to colour in this figure legend, the reader is referred to the web version of this article.)
Fig. 6
Fig. 6
LRH1-dependent recovery of hepatocyte identity genes. (A) Principal component analysis of RNA-seq data. RNA-seq data was generated using liver of mice treated with APAP alone or APAP+LRH1 overexpression vector as in Fig. 5A. RNA-seq data are deposited in the GEO under accession number GSE104302. (B) Pie graphs showing the enhancer composition. Genes having P-values lower than 0.05 between APAP and LRH1 + APAP groups were defined as LRH1-dependent genes. (C) Heatmaps and hierarchical correlation analyses of differentially expressed genes (DEGs). DEGs were selected as the genes with independent t-test (P-values < .05 with a fold-change of >1.5). The DEGs were hierarchically clustered and presented as heatmaps according to the row Z score. Super-enhancer- or typical enhancer (SE or TE)-associated DEGs represent significantly altered genes in the APAP group as compared to the vehicle group among the SE-associated or TE-associated genes. Not assigned DEGs are DEGs which are assigned neither to SE nor TE. Heatmaps of total DEGs (a), SE-associated DEGs (b), TE-associated DEGs (c), and not assigned DEGs (d) are presented in left. The proportions of the gene clusters depicted in the heatmaps (left) were shown as a graph (right). (D) Results of KEGG pathway analysis of the clustered DEGs. A schematic description of the gene clusters (a). Enriched signaling pathways of each gene cluster were analyzed using DAVID (b-d).
Fig. 7
Fig. 7
LRH1 as a driver gene for the core TF circuitry. (A) Hepatic super-enhancer-associated TF network with gene expression changes in mice treated with APAP alone or APAP+LRH1 overexpression vector. The node colors reflect log2 gene expression ratio in mice treated with APAP alone (left) or APAP+LRH1 overexpression (right) as compared to vehicle treatment (red, upregulation; blue, downregulation). Log2 fold changes of the core TFs are presented as an inset table. (B) The core TF mRNA levels from the APAP model. (C) The core TF mRNA levels from the CCl4 model. (D) The effect of each core TF overexpression on other core TFs. qRT-PCR assays were done on AML12 cells transfected with pcDNA3.1, LRH1, HNF4α, PPARα or RXRα for 48 h. The first lane of each graph is transfection reagent-treated control. Heatmap presents averages of core TF mRNA levels. O/E, overexpression. (E) Super-enhancer (SE)-luciferase reporter assays. Luciferase assays were done on AML12 cells co-transfected with each SE-luciferase reporter, and pcDNA3.1, LRH1, HNF4α, PPARα or RXRα overexpression vector for 24 h. Relative luciferase activities represent arbitrary units of luminescence normalized to the pcDNA3.1 group. The schematic illustrations showing each SE-luciferase construct are presented in the upper panel. The ChIP-seq signal peaks in the scheme are also shown in Fig. 1F. Red bars indicate the peaks excised for cloning of each SE-luciferase reporter construct. O/E, overexpression. (F) A proposed scheme showing auto-regulatory loops for the core TFs. In healthy liver, the core TFs form an interconnected feedback loop for gene expression. Upon injury, the signal circuitry loses its integrity with decrease of hepatocyte identity. LRH1 serves a driver for reconstitution of the signal circuitry. Data information: For B, data represent the means ± SEM (Mock+Veh, n = 7; Mock+APAP, n = 8; and LRH1 + APAP, n = 13, significantly different as compared to vehicle control, **P < .01; or APAP-treated control, #P < .05; ##P < .01). For C, data represent the means ± SEM (Mock+Veh, n = 6; Mock+CCl4, n = 14; and LRH1 + CCl4, n = 4; significantly different as compared to vehicle control, *P < .05; **P < .01; or CCl4-treated control: #P < .05; ##P < .01). For D and E, data represent the means ± SEM (n = 3 each, significantly different as compared to pcDNA3.1 group, *P < .05; **P < .01). (For interpretation of the references to colour in this figure legend, the reader is referred to the web version of this article.)

Similar articles

Cited by

References

    1. Hnisz D., Abraham B.J., Lee T.I., Lau A., Saint-André V., Sigova A.A. Super-enhancers in the control of cell identity and disease. Cell. 2013;155:934–947. - PMC - PubMed
    1. Whyte W.A., Orlando D.A., Hnisz D., Abraham B.J., Lin C.Y., Kagey M.H. Master transcription factors and mediator establish super-enhancers at key cell identity genes. Cell. 2013;153:307–319. - PMC - PubMed
    1. Yan L., Guo H., Hu B., Li R., Yong J., Zhao Y. Epigenomic landscape of human fetal brain, heart, and liver. J Biol Chem. 2016;291:4386–4398. - PMC - PubMed
    1. Fan Z., Zhao M., Joshi P.D., Li P., Zhang Y., Guo W. A class of circadian long non-coding RNAs mark enhancers modulating long-range circadian gene regulation. Nucleic Acids Res. 2017;45:5720–5738. - PMC - PubMed
    1. Matthews B.J., Waxman D.J. Computational prediction of CTCF/cohesin-based intra-TAD loops that insulate chromatin contacts and gene expression in mouse liver. Elife. 2018;7 - PMC - PubMed

MeSH terms