. 2019 Feb 5;116(3):383-394.
doi: 10.1016/j.bpj.2018.12.013. Epub 2018 Dec 25.

Automatic Detection and Classification of Ca2+ Release Events in Line- and Frame-Scan Images

Affiliations

Automatic Detection and Classification of Ca2+ Release Events in Line- and Frame-Scan Images

Ardo Illaste et al. Biophys J. .

Abstract

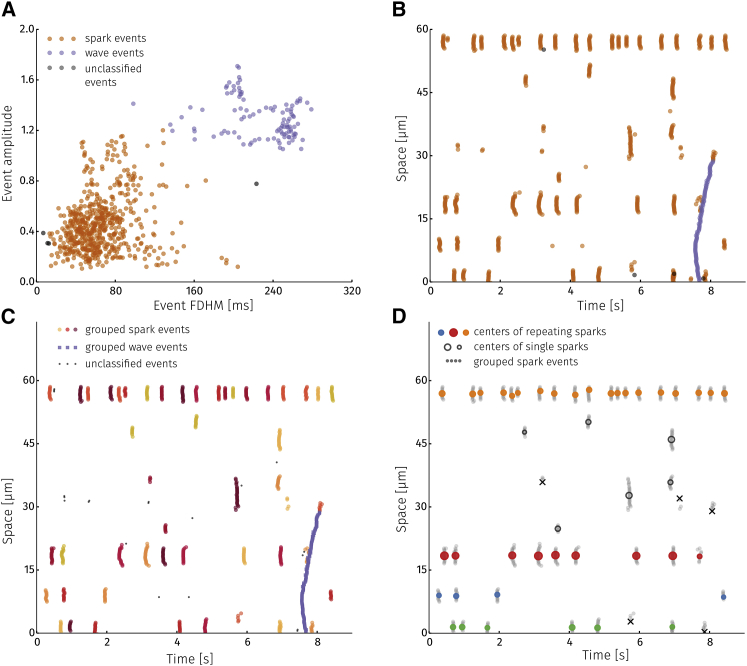
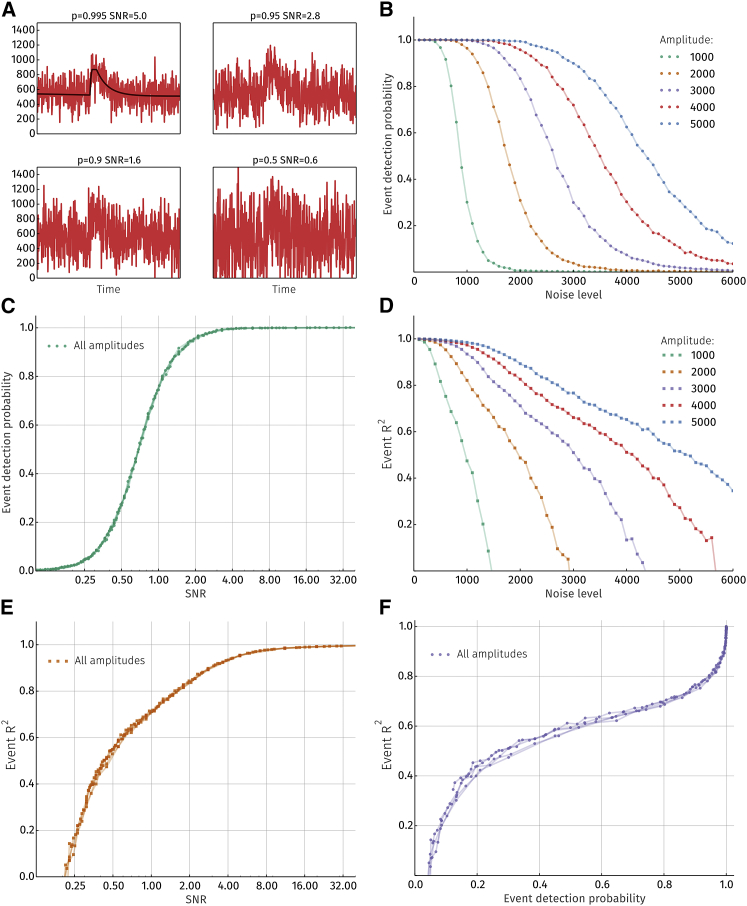
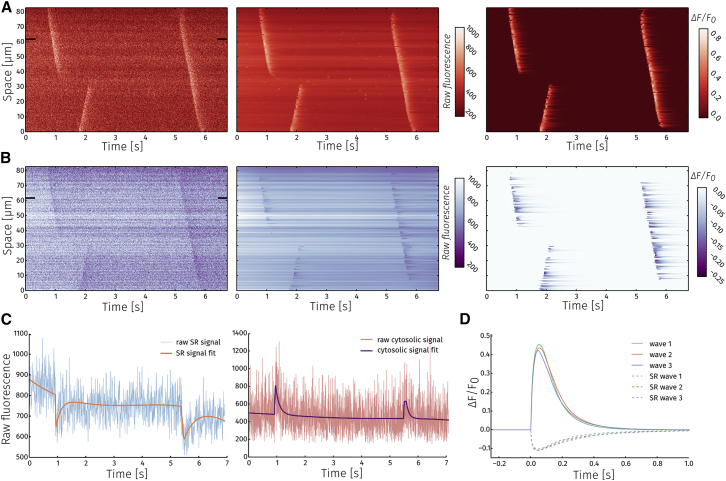
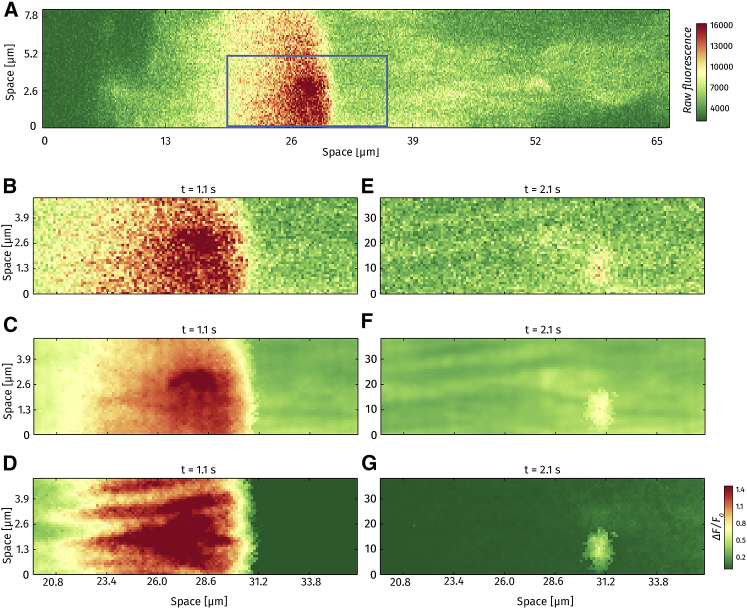
Analysis of Ca2+ signals obtained in various cell types (i.e., cardiomyocytes) is always a tradeoff between acquisition speed and signal/noise ratio of the fluorescence signal. This becomes especially apparent during fast two- or three-dimensional confocal imaging when local intracellular fluorescence signals originating from Ca2+ release from intracellular Ca2+ stores (e.g., sarcoplasmic reticulum) need to be examined. Mathematical methods have been developed to remedy a high noise level by fitting each pixel with a transient function to "denoise" the image. So far, current available analytical approaches have been impaired by a number of constraints (e.g., inability to fit local, concurrent, and consecutive events) and the limited ability to customize implementation. Here, we suggest a, to our knowledge, novel approach for detailed analysis of subcellular micro-Ca2+ events based on pixel-by-pixel denoising of confocal frame- and line-scan images. The algorithm enables spatiotemporally overlapping events (e.g., a Ca2+ spark occurring during the decaying phase of a Ca2+ wave) to be extracted so that various types of Ca2+ events can be detected at a pixel time level of precision. The method allows a nonconstant baseline to be estimated for each pixel, foregoing the need to subtract fluorescence background or apply self-ratio methods before image analysis. Furthermore, by using a clustering algorithm, identified single-pixel events are grouped into "physiologically relevant" Ca2+ signaling events spanning multiple pixels (sparks, waves, puffs, transients, etc.), from which spatiotemporal event parameters (e.g., full duration at half maximal amplitude, full width at half maximal amplitude, amplitude, wave speed, rise, and decay times) can be easily extracted. The method was implemented with cross-platform open source software, providing a comprehensive and easy-to-use graphical user interface enabling rapid line-scan images and rapid frame-scan image sequences (up to 150 frames/s) to be analyzed and repetitive Ca2+ events (Ca2+ sparks and Ca2+ puffs) originating from clusters of Ca2+ release channels located in the sarcoplasmic reticulum membrane (ryanodine receptors and inositol 1,4,5-trisphosphate receptors) of isolated cardiomyocytes to be examined with a high level of precision.


Figures

Figure 1
Figure 1
Diagram. A diagram depicting the procedure used to estimate event parameters and overall baseline in detected regions is shown.
Figure 2
Figure 2
Detecting regions with potential events. (A) An example of a raw fluorescence signal from a single pixel for which event regions are detected. (B) Continuous wavelet transform is performed on the raw signal with varying wavelet widths. Colored lines indicate ridge lines along maxima at changing window length values. Squares denote the first maxima on each ridge line. (C) Signal-to-noise ratio (SNR) of the continuous wavelet transform along each ridge line. (D) Detected event regions (regions 1–3; raw fluorescence signal from (A)) are marked in blue, orange, and green. Only the region 2 shows an overlap with a region having a lower peak SNR, i.e. with region 3.
Figure 3
Figure 3
Fitting function. (A) The fitting function for transients given by Eq. 1. (B) The result of fitting raw fluorescence data with the combined fitting function. (C) The raw signal is the sum of the fit, noise (W), and residual (R). (D) The fit is a superposition of the baseline and pixel events.
Figure 4
Figure 4
Fitting a line-scan image. (A) The raw fluorescence signal. (B) Each horizontal line along the temporal axis was fitted with the fitting algorithm. The fitted signal in the denoised image is a sum of fitted events (C) and baseline (D). ΔF/F0 image (E) is obtained by dividing the event image (C) with the baseline (D). Because the fitted baseline is a function of time, the ΔF/F0 image is automatically corrected for temporal changes in background fluorescence (e.g., bleaching). (F) The residual signal obtained when subtracting the fitted image from raw data. (G) A histogram of the residual values.
Figure 5
Figure 5
Classifying detected events. (A) A density-based clustering algorithm is used to classify pixel events into categories based on their shape. Colors represent event categories. Black signifies events that could not be categorized. (B) Categories obtained from clustering by shape plotted according to event location. (C) In the second step of classification, each shape category is clustered further based on location. Groups of pixel events are obtained that make up a Ca2+ release event (in this case, sparks and a wave). (D) All detected sparks visualized according to their center (location of colored circle) and amplitude (color of the circle). Events marked with a black x were not symmetric and not classified as sparks. Circle color shows sparks originating from the same 2 μm segment. Empty circles are sparks without nearby sparks.
Figure 6
Figure 6
Sensitivity and accuracy of the algorithm. (A) Four versions of the same original signal (shown in black on the top left panel) with different levels of added noise. The title for each plot indicates detection probability and the SNR for each respective signal. (B) Detection probabilities as a function of noise level for signals with various amplitudes. (C) Detection probabilities as a function of SNR are no longer dependent on signal amplitude. (D) R2 value for detected events as a function of noise level for signals with various amplitudes. (E) R2 value as a function of SNR. (F) A combination of (C) and (E) to show the relationship between detection probability and fit accuracy is given.
Figure 7
Figure 7
Dual channel line-scan analysis. (A) and (B) show, from left to right, the raw signal, fitted signal, and ΔF/F0 for cytosolic and SR measurements, respectively. (C) Raw data with the fit for a time trace from a single pixel (indicated by black rectangles on (A) and (B)) for SR (left) and cytosolic (right) signals are shown. (D) Average wave profiles for the three detected waves in the SR and the cytosol.
Figure 8
Figure 8
Frame-scan analysis. (A) A snapshot of a 512 × 64 pixel frame scan at t = 1.1 s after initiation of recording. Rectangle shows the in-focus region analyzed in subsequent panels. (BD) Raw image, pixel-by-pixel fitted image, and ΔF/F0, respectively, for a Ca2+ wave. (EG) Raw image, pixel-by-pixel fitted image, and ΔF/F0, respectively, for a Ca2+ spark.
Figure 9
Figure 9
Detailed frame-scan analysis. (A) Baseline fluorescence (dye distribution) in the zoomed-in region from Fig. 8. (B) A map showing wave peak time. (C) A map showing wave FDHM. (D) Time difference between actual time of wave maximum and expected time. Arrows indicate the gradient of wave peak time. (E) Wave “slowness,” i.e., highest resistance to wave traversal.

Similar articles

Cited by

References

    1. Niggli E. Localized intracellular calcium signaling in muscle: calcium sparks and calcium quarks. Annu. Rev. Physiol. 1999;61:311–335. - PubMed
    1. Niggli E., Shirokova N. A guide to sparkology: the taxonomy of elementary cellular Ca2+ signaling events. Cell Calcium. 2007;42:379–387. - PubMed
    1. Cheng H., Song L.S., Stern M.D. Amplitude distribution of calcium sparks in confocal images: theory and studies with an automatic detection method. Biophys. J. 1999;76:606–617. - PMC - PubMed
    1. Uttenweiler D., Kirsch W.G., Fink R.H. Model-based analysis of elementary Ca2+ release events in skinned mammalian skeletal muscle fibres. Eur. Biophys. J. 2002;31:331–340. - PubMed
    1. Picht E., Zima A.V., Bers D.M. SparkMaster: automated calcium spark analysis with ImageJ. Am. J. Physiol. Cell Physiol. 2007;293:C1073–C1081. - PubMed

Publication types