. 2019 Jan 21;29(2):340-349.e7.
doi: 10.1016/j.cub.2018.12.008. Epub 2019 Jan 10.

The Genomic Footprints of the Fall and Recovery of the Crested Ibis

Affiliations

The Genomic Footprints of the Fall and Recovery of the Crested Ibis

Shaohong Feng et al. Curr Biol. .

Abstract

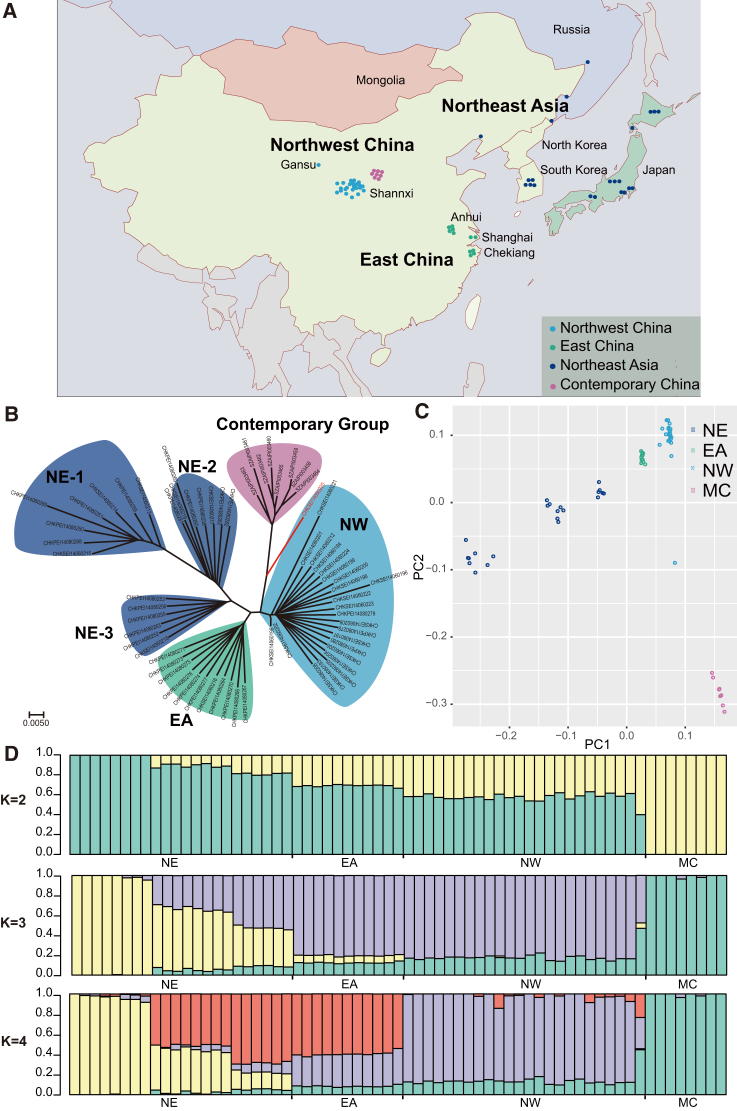
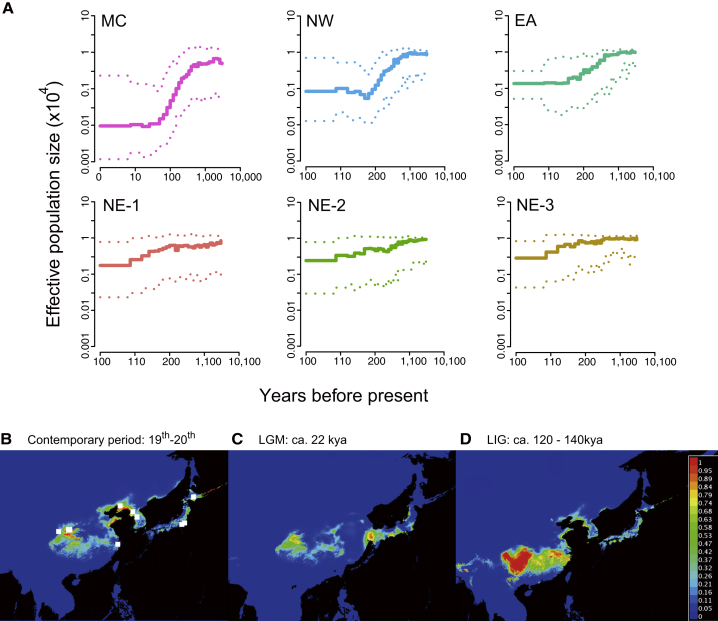
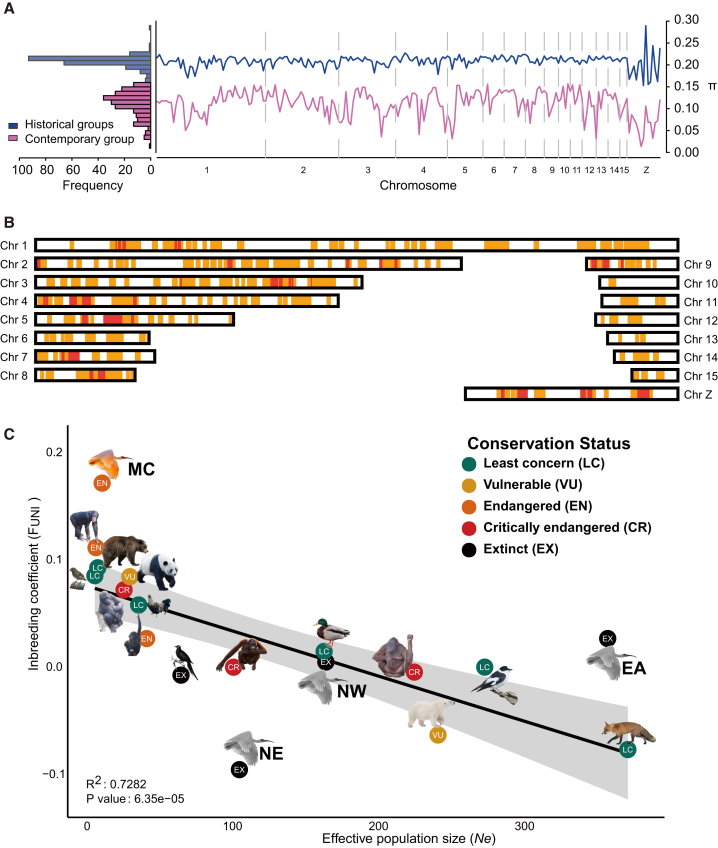
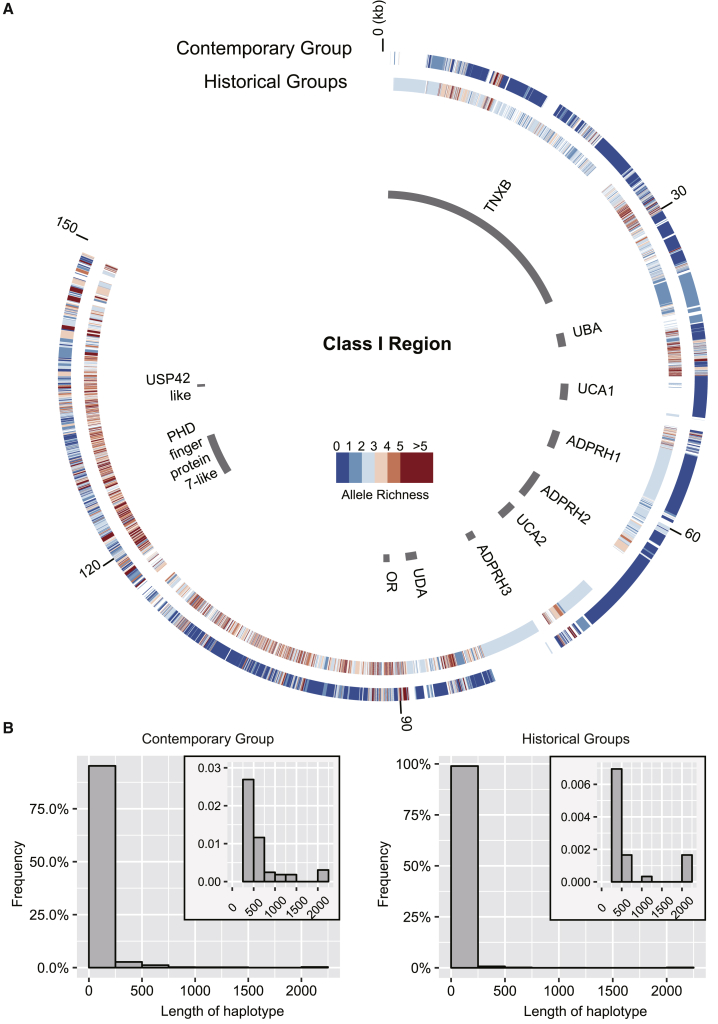
Human-induced environmental change and habitat fragmentation pose major threats to biodiversity and require active conservation efforts to mitigate their consequences. Genetic rescue through translocation and the introduction of variation into imperiled populations has been argued as a powerful means to preserve, or even increase, the genetic diversity and evolutionary potential of endangered species [1-4]. However, factors such as outbreeding depression [5, 6] and a reduction in available genetic diversity render the success of such approaches uncertain. An improved evaluation of the consequence of genetic restoration requires knowledge of temporal changes to genetic diversity before and after the advent of management programs. To provide such information, a growing number of studies have included small numbers of genomic loci extracted from historic and even ancient specimens [7, 8]. We extend this approach to its natural conclusion, by characterizing the complete genomic sequences of modern and historic population samples of the crested ibis (Nipponia nippon), an endangered bird that is perhaps the most successful example of how conservation effort has brought a species back from the brink of extinction. Though its once tiny population has today recovered to >2,000 individuals [9], this process was accompanied by almost half of ancestral loss of genetic variation and high deleterious mutation load. We furthermore show how genetic drift coupled to inbreeding following the population bottleneck has largely purged the ancient polymorphisms from the current population. In conclusion, we demonstrate the unique promise of exploiting genomic information held within museum samples for conservation and ecological research.

Keywords: ancient genomics; conservation genomics; demography; endangered species; extinction; genetic recovery; inbreeding; mutation load; ornithology; population genomics.


Figures

Figure 1
Figure 1
Sampling Map and Population Structure of the Crested Ibis (A) Map of sampling locations. (B) NJ phylogeny of all 65 individuals (57 historic and 8 contemporary) correlates with geographic distribution in (A), except for the one (marked in red) collected from the NW, which is closely related to the contemporary group. Three NE subgroups (NE-1, NE-2, and NE-3), EA, NW, and contemporary groups (MC) are labeled by different background colors. (C) Principal component analysis for all 65 individuals. The observed result is consistent with that of the NJ phylogeny. (D) Population structure of all 65 individuals (K = 2, 3, and 4). The population origin of each individual is indicated on x axis. Each individual is represented by a bar that is segmented into colors based on the ancestry proportions given the assumption of K populations. See also Data S1 and S2.
Figure 2
Figure 2
Inference of Recent Population Size Tendency and Prediction of Breeding Ranges for the Crested Ibis at the Contemporary, the Last Glacial Maximum, and the Last Interglacial Periods (A) The recent effective population size (Ne) for each group is inferred using PopSizeABC. A 90% confidence interval is indicated by dotted lines. (B–D) Reconstruction of ecological niche models for the contemporary (19th and 20th centuries, B), last glacial maximum (LGM, approximately 22 kya, C) and the last interglacial (LIG, approximately 120–140 kya, D) periods. Pictures show the point-wise mean of 10 replicates using 19 environmental layers. The colors indicate the predicted probability that conditions are suitable, with red indicating high and blue indicating low probabilities. The white square points in (B) indicate the geographic coordinates of the crested ibis samples. See also Figure S1 and Table S1.
Figure 3
Figure 3
Loss of Genetic Diversity and Elevated Inbreeding in the Crested Ibis (A) Left: A histogram describing mean π for 5 Mb windows across the crested ibis genome in the historical and contemporary groups. Right: Genomic distribution of individual pairwise estimates of mean π in 5 Mb windows across the crested ibis genome in historical and contemporary groups. Chromosome boundaries are indicated as vertical dashed lines. (B) The chromosomal distribution of IBD regions in the contemporary population. IBD regions are marked in orange, with additional red highlighting if supported by more than half samples. (C) Linear model of inbreeding coefficient (FUNI) and effective population size (Ne) based on 14 animal species using the published population datasets. R-squared value and the p value of F test indicated a significant positive correlation between FUNI and Ne, while the contemporary population (labeled as MC) is a significant outlier. The historical crested ibis populations are indicated in gray. See also Figure S2 and Table S2.
Figure 4
Figure 4
Haplotype Structure and Length Distribution of the Class I Region in Historical and Contemporary Groups (A) Haplotype blocks are detected based on the SNP datasets for historical and contemporary groups, respectively. Colored circles show the haplotype structure (each box indicates the start and end SNPs of one haplotype) and the diversity along the class I region (color indicates the allelic richness). The allelic richness of historical groups is estimated in the random way (see STAR Methods). Gaps in the colored circles are the intervals between two neighboring haplotype blocks. Genomic structures of the class I region are drawn as gray bars, with different sizes showing different gene loci of varied sizes. (B) Length distribution of haplotype blocks. Haplotype blocks with lengths larger than 2,000 bp are grouped into the last bar. The plotting area for the bin of 250–2,000 bp is enlarged in the top right corner. See also Figure S3.

References

    1. Weeks A.R., Sgro C.M., Young A.G., Frankham R., Mitchell N.J., Miller K.A., Byrne M., Coates D.J., Eldridge M.D., Sunnucks P. Assessing the benefits and risks of translocations in changing environments: a genetic perspective. Evol. Appl. 2011;4:709–725. - PMC - PubMed
    1. Armstrong D.P., John L.C. Effects of familiarity on the outcome of translocations, II. A test using New Zealand Robins. Biol. Conserv. 1995;71:281–288.
    1. Whiteley A.R., Fitzpatrick S.W., Funk W.C., Tallmon D.A. Genetic rescue to the rescue. Trends Ecol. Evol. 2015;30:42–49. - PubMed
    1. Weeks A.R., Heinze D., Perrin L., Stoklosa J., Hoffmann A.A., van Rooyen A., Kelly T., Mansergh I. Genetic rescue increases fitness and aids rapid recovery of an endangered marsupial population. Nat. Commun. 2017;8:1071. - PMC - PubMed
    1. Olden J.D., Leroy Poff N., Douglas M.R., Douglas M.E., Fausch K.D. Ecological and evolutionary consequences of biotic homogenization. Trends Ecol. Evol. 2004;19:18–24. - PubMed

Publication types

LinkOut - more resources