. 2019 Feb 12;12(2):213-229.
doi: 10.1016/j.stemcr.2018.12.011. Epub 2019 Jan 10.

Patient-Specific iPSC-Derived Astrocytes Contribute to Non-Cell-Autonomous Neurodegeneration in Parkinson's Disease

Affiliations

Patient-Specific iPSC-Derived Astrocytes Contribute to Non-Cell-Autonomous Neurodegeneration in Parkinson's Disease

Angelique di Domenico et al. Stem Cell Reports. .

Abstract

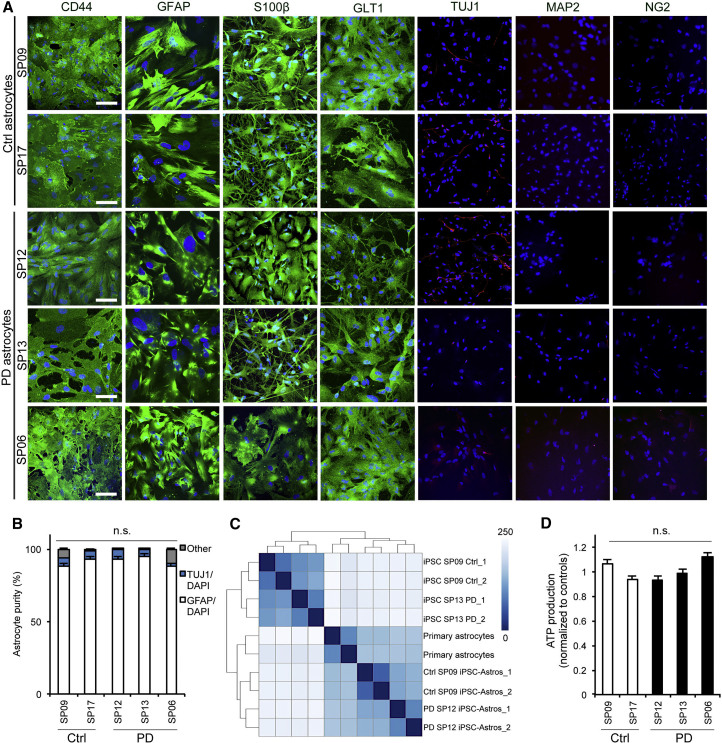
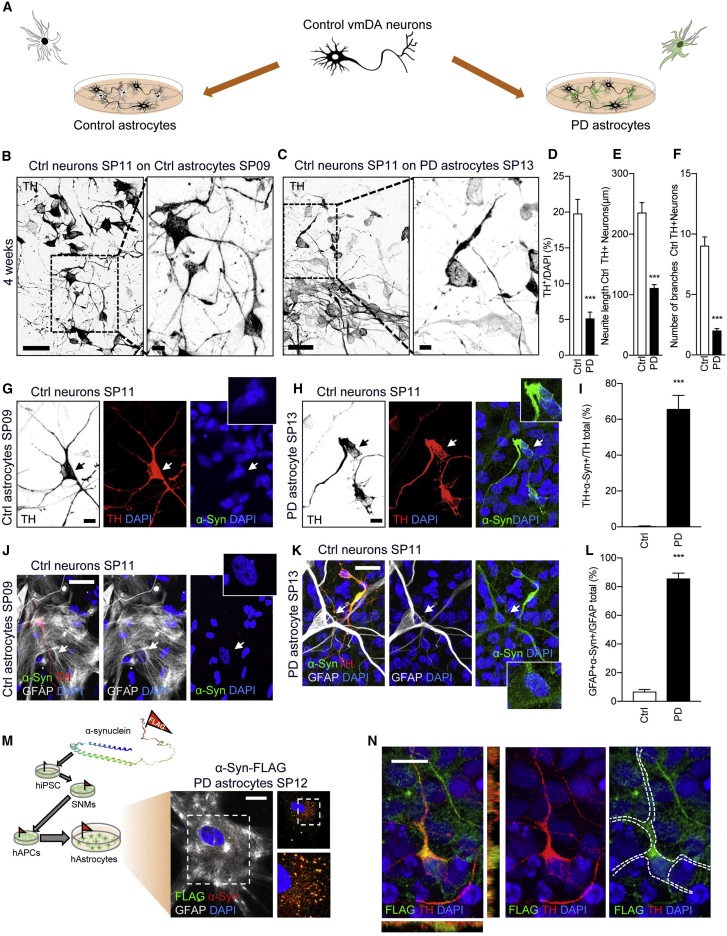
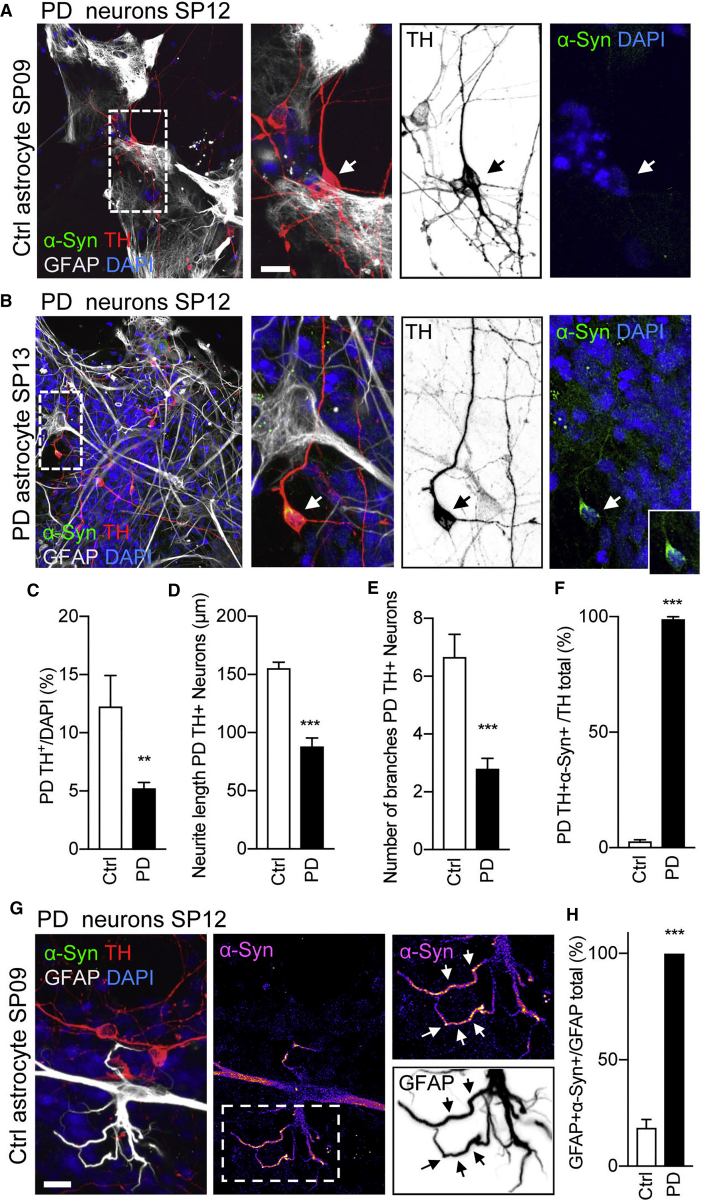
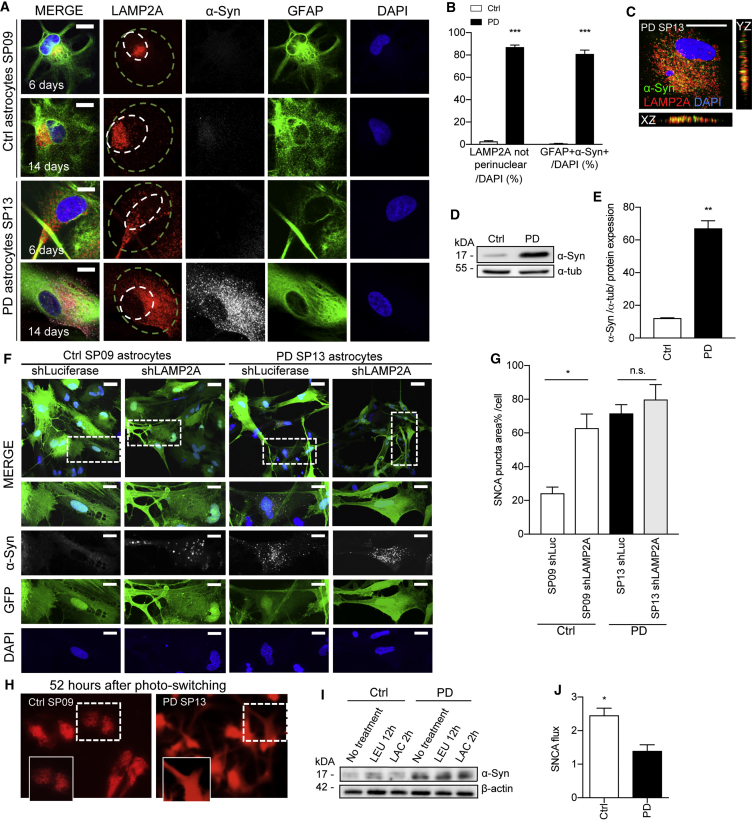
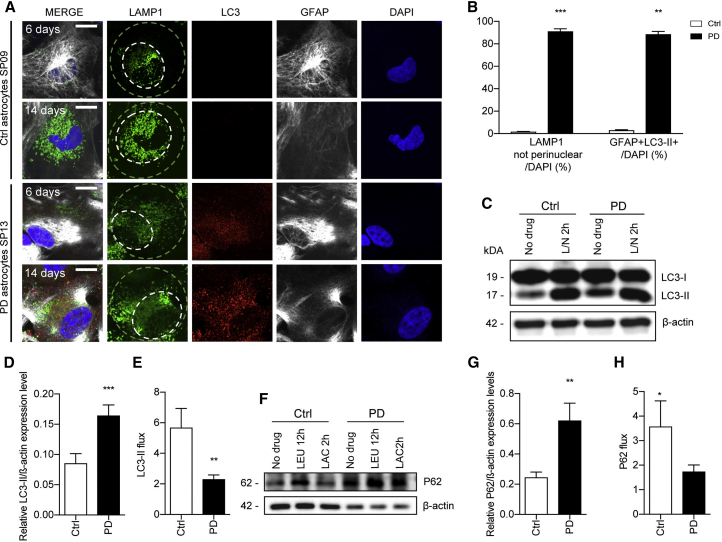
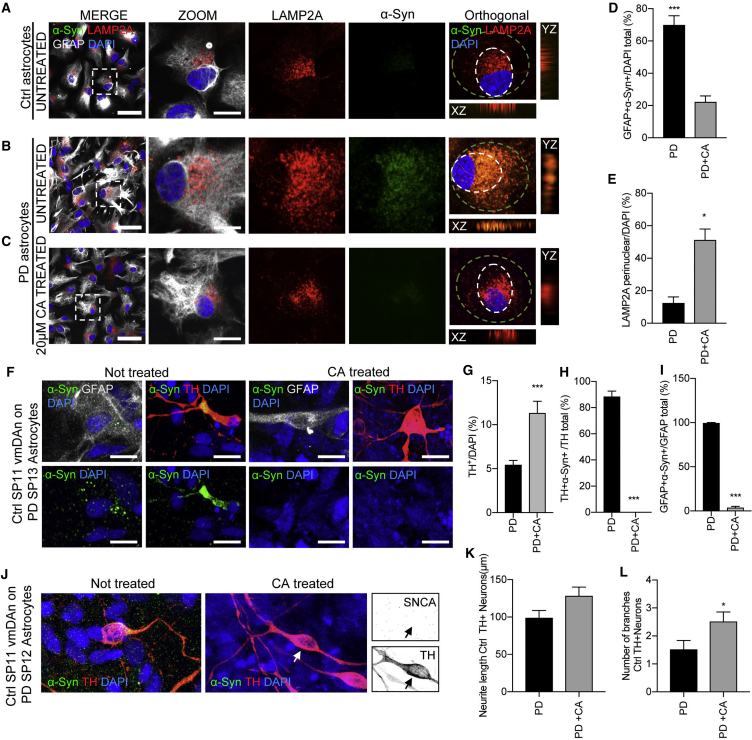
Parkinson's disease (PD) is associated with the degeneration of ventral midbrain dopaminergic neurons (vmDAns) and the accumulation of toxic α-synuclein. A non-cell-autonomous contribution, in particular of astrocytes, during PD pathogenesis has been suggested by observational studies, but remains to be experimentally tested. Here, we generated induced pluripotent stem cell-derived astrocytes and neurons from familial mutant LRRK2 G2019S PD patients and healthy individuals. Upon co-culture on top of PD astrocytes, control vmDAns displayed morphological signs of neurodegeneration and abnormal, astrocyte-derived α-synuclein accumulation. Conversely, control astrocytes partially prevented the appearance of disease-related phenotypes in PD vmDAns. We additionally identified dysfunctional chaperone-mediated autophagy (CMA), impaired macroautophagy, and progressive α-synuclein accumulation in PD astrocytes. Finally, chemical enhancement of CMA protected PD astrocytes and vmDAns via the clearance of α-synuclein accumulation. Our findings unveil a crucial non-cell-autonomous contribution of astrocytes during PD pathogenesis, and open the path to exploring novel therapeutic strategies aimed at blocking the pathogenic cross talk between neurons and glial cells.

Keywords: CRISPR/Cas9; LRRK2; Parkinson's disease; astrocytes; autophagy; disease modeling; iPSC; neurodegeneration; non-cell-autonomous; α-synuclein.


Figures

None
Graphical abstract
Figure 1
Figure 1
iPSC-Derived Patient-Specific Astrocyte Generation and Characterization (A) Representative ICC images of astrocytes from two Ctrl iPSC lines (Ctrl SP09 and Ctrl SP17) and three PD iPSC lines (PD SP12, PD SP13, and PD SP06) staining positive for CD44 (astrocytic precursor marker), GFAP (general astrocytes), S100β (mature astrocytes), and GLT1 (excitatory amino acid transporter 2), and negative for TUJ1 (immature neurons), MAP2 (mature neurons), and NG2 (oligodendrocytes) expression. Number of independent astrocyte lines generated from iPSC per patient = 3. Number of independent experiments per astrocyte line generated = 3. Scale bar, 100 μm. (B) Astrocyte cultures are composed of approximately 95% astrocytes, 4% neurons, and 1% other (n = 3). (C) Heatmap showing sample similarities taking the rlog transformed data and Euclidean distances between samples. iPSC-derived astrocyte (Ctrl SP09 and PD SP12) samples cluster closer to the human primary astrocytes than the corresponding iPSC group (n = 2). (D) Functional ATP production luminescence (counts normalized to controls) in both Ctrl (SP09 and SP17) and PD (SP13, SP12, and SP06) astrocytes (n = 3). Data are expressed as mean ± SEM, unpaired two-tailed Student's t test.
Figure 2
Figure 2
vmDAn Generation, Characterization, and Co-culture Setup (A and B) Representative immunofluorescence images of Ctrl SP11 vmDAn after (A) 35 or (B) 50 days of neuronal differentiation. iPSC-derived neural cultures express markers specific for neurons (MAP2), DAns (TH), and midbrain-type DAns (FOXA2 and GIRK2). Scale bar, 20 μm. (C) Percentage of differentiated cells that stained positive for TH and double positive for TH and FOXA2 and TH and GIRK2 after 50 days of differentiation (n = 4). (D) Calcium wave flux recording over 30 min with calcium tracer Fluo-8 AM of vmDAns at day 50 (n = 3). (E) Diagram of co-culture system. (F) Representative ICC images of 4-week co-culture staining positive for Ctrl SP11 vmDAns (TH), Ctrl SP17 astrocytes (S100β), excitatory amino acid transporter 2 (GLT1), and nuclear DAPI. Scale bar, 20 μm. (G) Representative ICC images of presynaptic markers α-syn and synapsin-1 of a Ctrl SP11 vmDAn (TH) on the top of Ctrl SP11 astrocytes after 4 weeks in co-culture. Scale bar, 10 μm. (H) Representative ICC images of Ctrl SP11 vmDAns (TH) and mature neurons (MAP2) on the top of Ctrl SP09 astrocytes (GFAP) during a 4-week co-culture period. Scale bar, 20 μm. Boxed area on the left in (F), (G), and (H) is shown on the right.
Figure 3
Figure 3
Ctrl Neurons Show Signs of Neurodegeneration and Accumulate α-syn when Co-cultured with PD Astrocytes (A) Scheme representing co-culture system of Ctrl neurons on the top of Ctrl or PD astrocytes for 4 weeks. (B and C) Representative ICC images of tyrosine hydroxylase (TH, black) from co-cultures of Ctrl SP11 neurons with (B) Ctrl SP09 astrocytes and (C) PD SP13 astrocytes for 4 weeks. Images on the right show a magnification of the area boxed in the left images; scale bars, (left) 20 μm and (right) 0.2 μm. (D) Percentage of TH+/DAPI of Ctrl SP11 and Ctrl SP11#4 neurons when co-cultured with Ctrl SP09, Ctrl SP17, or PD SP12, PD SP13, and PD SP06 astrocytes for 4 weeks (n = 3 per combination). (E and F) (E) Neurite length quantification and (F) number of branches of Ctrl SP11 TH-positive neurons and Ctrl SP11#4 TH-positive neurons when co-cultured on Ctrl SP09, Ctrl SP17, and Ctrl SP11 astrocytes or PD SP12, PD SP13, and PD SP06 astrocytes for 4 weeks (n = 3); 30 neurons counted per experiment. (G and H) Representative ICC images of Ctrl SP11 vmDAns co-cultured with (G) Ctrl SP09 and (H) PD SP13 astrocytes after 4 weeks and stained for TH (vmDAn), α-syn, and DAPI. Arrows indicate the selected cell for which an insert is shown at higher magnification. Scale bar, 0.2 μm. (I) Quantitative analysis of the percentage of vmDAns stained positive for α-syn when Ctrl SP11 and Ctrl SP11#4 neurons were co-cultured with Ctrl SP09, Ctrl SP17, or PD SP12, PD SP13, and PD SP06 astrocytes for 4 weeks (n = 3). (J and K) Representative ICC images of (J) Ctrl SP09 or (K) PD SP13 astrocytes co-cultured with Ctrl SP11 vmDAns for 4 weeks, stained for TH (vmDAn), GFAP (astrocytes), α-syn, and DAPI. Arrows indicate the selected cell for which an insert is shown at higher magnification. Scale bar, 20 μm. (L) Quantitative analysis of the percentage of astrocytes stained positive for α-syn when Ctrl SP11 and Ctrl SP11#4 neurons were co-cultured with Ctrl SP09, Ctrl SP17, or PD SP12, PD SP13, and PD SP06 astrocytes for 4 weeks (n = 3). (M) Scheme representing the generation of CRISPR/Cas9 edited α-syn-FLAG astrocyte line. Representative image of α-syn-FLAG PD SP12 astrocyte (GFAP) showing perfect α-syn (red) and FLAG (green) co-localization. Scale bar, 20 μm. (N) Representative ICC image depicting astrocyte-derived FLAG (green) inside of a TH-positive Ctrl SP11 neuron (red) during a 4-week co-culture period with PD SP12 α-syn-FLAG astrocytes (n = 3). Dashed line shows the outline of the cell. Scale bar, 10 μm. Data are expressed as mean ± SEM, unpaired two-tailed Student's t test, ∗∗∗p < 0.001.
Figure 4
Figure 4
PD Neurons Restore Arborized Morphology and Accumulate Less α-syn when Co-cultured with Ctrl Astrocytes (A and B) Representative ICC images of PD SP12 vmDAns during 4-week co-cultures with (A) Ctrl SP09 or (B) PD SP13 astrocytes stained for TH (vmDAns), α-syn, GFAP (astrocytes), and DAPI. Images on the right show a magnification of the area boxed in the left images. Arrows indicate the selected cell for which an insert is shown at higher magnification with α-syn accumulation. Scale bar, 20 μm. (C) Quantitative analysis of the percentage of PD SP12 vmDAns remaining after 4-week co-culture with Ctrl SP09, PD SP13, and PD SP12 astrocytes (n = 3). (D and E) (D) Neurite length quantification and (E) number of branches of PD SP12 TH-positive neurons when co-cultured on PD SP12 or PD SP13 astrocytes for 4 weeks compared with the wild-type condition Ctrl SP11 neurons on Ctrl SP09, Ctrl SP17, and Ctrl SP11 astrocytes for 4 weeks (n = 3); 40 neurons counted per experiment. (F) Quantitative analysis of the percentage of PD SP12 vmDAns that stained positive for α-syn when co-cultured on the top of Ctrl SP09, Ctrl SP17, Ctrl SP11, PD SP13, and PD SP12 astrocytes for 4 weeks (n = 3). (G) Immunofluorescence analysis of PD SP12 neurons on the top of Ctrl SP09 astrocytes stained for TH, GFAP, α-syn, and DAPI. Images on the right show a magnification of the area boxed in the left image. Arrows in the inset shows α-syn accumulation inside Ctrl SP09 astrocyte processes. Inset scale bar, 20 μm. (H) Quantitative analysis of the percentage of astrocytes that stained positive for α-syn after being cultured with PD SP12 neurons for 4 weeks. Ctrl astrocytes were derived from SP09, SP11, and SP17 iPSCs, while PD astrocytes were derived from SP12 and SP13 iPSCs (n = 3). Data are expressed as mean ± SEM, unpaired two-tailed Student's t test, ∗∗p < 0.01, ∗∗∗p < 0.001).
Figure 5
Figure 5
Altered CMA and α-syn Accumulation in LRRK2-PD Astrocytes (A) Representative ICC images of CMA receptor (LAMP2A), astrocyte marker GFAP, α-syn, and nuclear marker DAPI in Ctrl SP09 and PD SP13 astrocytes at 6 and 14 days. Scale bar, 20 μm. Smaller white circles represent perinuclear area, whereas larger green circle represents non-perinuclear area. (B) Percentage of astrocytes with LAMP2A-positive puncta positioning outside of perinuclear area and percentage of astrocytes that stained positive for α-syn. Astrocyte lines used in the experiment were Ctrl SP09, Ctrl SP17, PD SP12, and SP13 (n = 3). (C) Representative ICC image of positive co-localization of LAMP2A and α-syn in PD SP13 astrocytes. Scale bar, 10 μm. (D and E) (D) Western blot of α-syn and α-tubulin as a loading control and (E) quantification in Ctrl SP09 and PD SP13 astrocytes after 14 days in culture (n = 4). (F) Representative ICC images of Ctrl SP09 and PD SP13 astrocytes after 14 days of transduction with either LV-shLAMP2A or LV-shLuciferase (as a control) stained for α-syn, GFP, and DAPI. Boxed areas highlight the region for which high magnification images are shown. Scale bars, 20 and 10 μm, respectively. (G) Percentage of α-syn puncta area per cell in Ctrl SP09 and PD SP13 astrocytes transduced with LV-shLuciferase or LV-shLAMP2A (n = 3). (H) KFERQ-DENDRA (CMA reporter) in Ctrl SP09 and PD SP13 astrocytes 52 hr after photo-switching with UV light (n = 3). Images in the insets at the bottom are a magnification of the boxed area. (I and J) (I) Western blot of α-syn and β-actin as a loading control and (J) quantification of α-syn flux ratio normalized to β-actin in Ctrl SP09 and PD SP13 after the addition of inhibitors of lysosomal proteolysis (leupeptin [LEU], 100 μM) for 12 hr and proteasomal degradation (lactacystin [LAC], 5 μM) for 2 hr (n = 3). Data are expressed as mean ± SEM, unpaired two-tailed Student's t test, p < 0.05, ∗∗p < 0.01, ∗∗∗p < 0.001.
Figure 6
Figure 6
Dysfunctional Macroautophagy in LRRK2-PD Astrocytes (A) Representative ICC images of lysosomal protein marker LAMP1 and autophagosome marker LC3 in Ctrl SP09 and PD SP13 astrocytes (GFAP) at 6 and 14 days. Smaller white circles represent perinuclear area, whereas larger green circle represents non-perinuclear area. Scale bar, 20 μm. (B) Percentage of astrocytes with LAMP1-positive puncta positioning outside of perinuclear area and percentage of astrocytes that stained positive for LC3-II. Astrocyte lines used in the experiment were Ctrl SP09 and SP13 (n = 3). (C–E) (C) Western blot of LC3-II protein levels and β-actin as loading control with corresponding quantification of (D) the LC3-II basal expression and (E) LC3-II flux with or without lysosomal inhibitors NH4Cl and leupeptin (L/N) for 2 hr in Ctrl SP09 and PD SP13 astrocytes (n = 3). (F–H) (F) Western blot of p62 protein levels and β-actin as loading control with corresponding quantification of (G) the P62 basal expression and (H) P62 flux without inhibitors or with inhibitors leupeptin for 12 hr and lactacystin for 2 hr in Ctrl SP09 and PD SP13 astrocytes (n = 3). Data are expressed as mean ± SEM, unpaired two-tailed Student's t test, p < 0.05, ∗∗p < 0.01, ∗∗∗p < 0.001.
Figure 7
Figure 7
CMA Activator Drug Treatment Rescues α-syn Accumulation in Neurons Cultured with PD Astrocytes (A and B) Representative ICC images of (A) Ctrl and (B) PD astrocytes after 2 weeks in culture without treatment stained for LAMP2A, α-syn, GFAP, and DAPI. Orthogonal views reveal positive co-localization of α-syn to LAMP2A in PD untreated sample. Images on the right show a magnification of the area boxed in the left images. Dashed circles outline the perinuclear area of the cell. Scale bars, 100 and 20 μm in merge and zoom, respectively. (C) Representative ICC images of PD astrocytes after 20 μg of CA drug treatment stained for LAMP2A, α-syn, GFAP, and DAPI. Scale bars, 100 and 20 μm in merge and zoom, respectively. (D and E) (D) Quantitative analysis of PD astrocytes (SP13 and SP12) stained positive for α-syn either not treated or treated with CA; (E) quantitative analysis of the same astrocytes under the same conditions, showing LAMP2A puncta in the perinuclear area (n = 3). (F) Representative ICC images of 4-week Ctrl SP11 vmDAns co-cultured on PD SP13 astrocytes (left) or treated with CA for 2 weeks (right). Samples were stained for GFAP, TH, α-syn, and DAPI. Scale bars, 20 μm. (G–I) (G) Quantitative analysis of the percentage of vmDAns remaining after being co-cultured with PD SP12 or PD SP13 (without treatment or treated with CA) for 4 weeks. Percentage of the (H) vmDAns or (I) astrocytes that stained positive for α-syn 4 weeks after the same co-culture conditions (n = 6). (J) Representative ICC images of 4-week Ctrl SP11 vmDAns co-cultured on PD SP12 astrocytes with or without CA treatment for 2 weeks. Samples were stained for TH, α-syn, and DAPI. Arrows indicate the absence of α-syn accumulation in the selected TH-positive cell. Scale bars, 20 μm. (K and L) (K) Neurite length quantification and (L) number of branches of 4-week Ctrl SP11 vmDAns when co-cultured on PD SP12 or PD SP13 astrocytes with or without CA treatment for 2 weeks (n = 4); 20 neurons counted per experiment. Data are expressed as mean ± SEM, unpaired two-tailed Student's t test, p<0.05; ∗∗∗p < 0.001.

References

    1. Abeliovich A., Gitler A.D. Defects in trafficking bridge Parkinson's disease pathology and genetics. Nature. 2016;539:207–216. - PubMed
    1. Alwin S., Gere M.B., Guhl E., Effertz K., Barbas C.F., 3rd, Segal D.J., Weitzman M.D., Cathomen T. Custom zinc-finger nucleases for use in human cells. Mol. Ther. 2005;12:610–617. - PubMed
    1. Anguiano J., Garner T.P., Mahalingam M., Das B.C., Gavathiotis E., Cuervo A.M. Chemical modulation of chaperone-mediated autophagy by retinoic acid derivatives. Nat. Chem. Biol. 2013;9:374–382. - PMC - PubMed
    1. Booth H.D.E., Hirst W.D., Wade-Martins R. The role of astrocyte dysfunction in Parkinson's disease pathogenesis. Trends Neurosci. 2017;40:358–370. - PMC - PubMed
    1. Braak H., Sastre M., Del Tredici K. Development of alpha-synuclein immunoreactive astrocytes in the forebrain parallels stages of intraneuronal pathology in sporadic Parkinson's disease. Acta Neuropathol. 2007;114:231–241. - PubMed

Publication types

MeSH terms

Substances