. 2019 Feb 12;12(2):258-273.
doi: 10.1016/j.stemcr.2018.12.005. Epub 2019 Jan 10.

The Surface Proteome of Adult Neural Stem Cells in Zebrafish Unveils Long-Range Cell-Cell Connections and Age-Related Changes in Responsiveness to IGF

Affiliations

The Surface Proteome of Adult Neural Stem Cells in Zebrafish Unveils Long-Range Cell-Cell Connections and Age-Related Changes in Responsiveness to IGF

Jara Obermann et al. Stem Cell Reports. .

Abstract

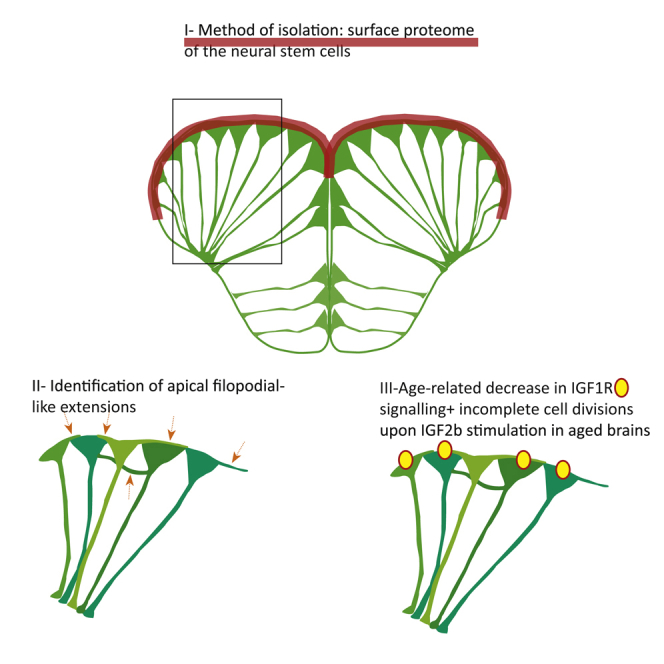
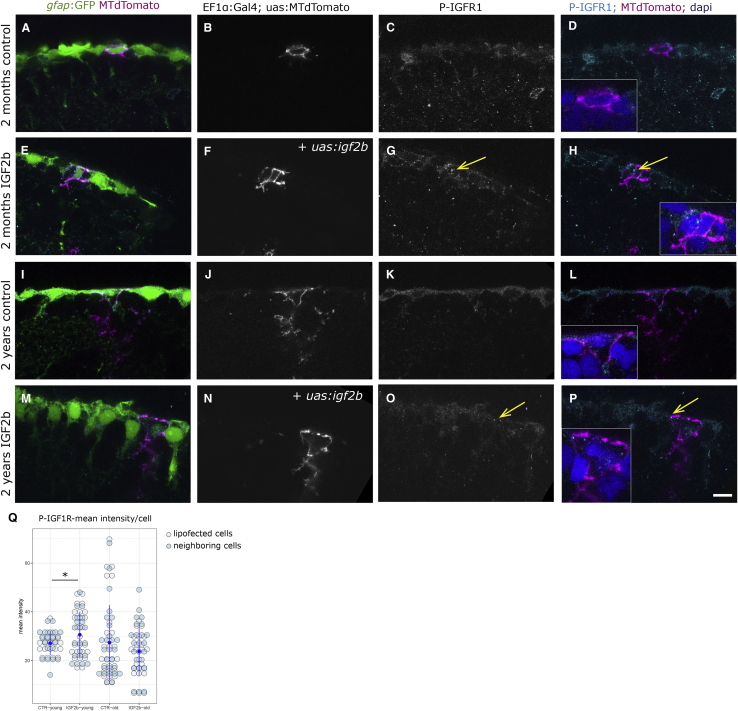
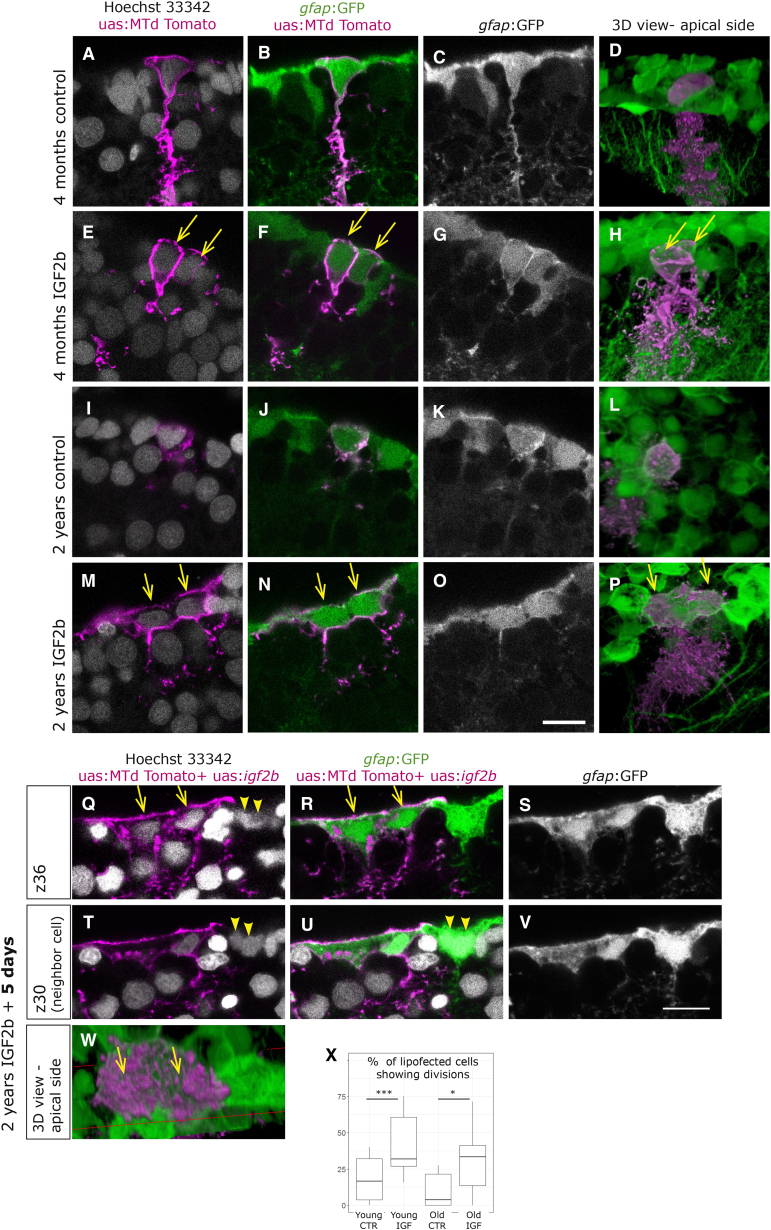
In adult stem cell populations, recruitment into division is parsimonious and most cells maintain a quiescent state. How individual cells decide to enter the cell cycle and how they coordinate their activity remains an essential problem to be resolved. It is thus important to develop methods to elucidate the mechanisms of cell communication and recruitment into the cell cycle. We made use of the advantageous architecture of the adult zebrafish telencephalon to isolate the surface proteins of an intact neural stem cell (NSC) population. We identified the proteome of NSCs in young and old brains. The data revealed a group of proteins involved in filopodia, which we validated by a morphological analysis of single cells, showing apically located cellular extensions. We further identified an age-related decrease in insulin-like growth factor (IGF) receptors. Expressing IGF2b induced divisions in young brains but resulted in incomplete divisions in old brains, stressing the role of cell-intrinsic processes in stem cell behavior.

Keywords: GFAP; aging; biotinylation; filopodia; lamellipodia; mass spectrometry; neurogenesis; pallium; quiescence; radial glia; telencephalon.


Figures

None
Graphical abstract
Figure 1
Figure 1
Proteome Identification (A) The biotinylation reaction was performed on freshly isolated brains. The yellow line depicts the location of the cross-section shown in (B). (B) Cross-section through the telencephalon of a zebrafish. Biotinylated surfaces are depicted as magenta dots. The upper surface of the pallium borders the ventricle, located below the tela choroidea (white arrow) and is composed of the cell somata of the radial glia (depicted in green in the inset). The midline between both hemispheres is also filled by a thin part of the ventricle. After the biotinylation reaction, telencephalons were separated into the dorsal part (pallium) and ventral part (subpallium). (C) Drawing of the fractions isolated by FACS and by biotinylation, depicting in green the radial glia, in dark blue the remaining cells of the telencephalon, in magenta the biotinylated fraction containing the cell surfaces of the radial glia, and in light blue the lysate fraction containing the remainder of these cells as well as the rest of the telencephalon. (D–I) Histochemistry on cross-sections with streptavidin coupled to AlexaFluor 555 after biotinylation of the brain, revealing the expected binding of biotin on the cell surfaces in young (D–F) and old (G–I) brains. (J) Cells of the GFP-positive and -negative fraction plated directly after the sorting; nuclei are stained by DAPI. (K) Known proteins isolated on FACS-sorted radial glia. (L) The overlaps between the surface fraction, lysate fraction, and GFP-positive fraction are represented. The majority (79.3%) of proteins identified in the FACS-GFP-positive fraction were also found in the biotinylated fraction. (M) Identified proteins were categorized according to the presence of signal peptides and transmembrane domains, revealing an enrichment of plasma membrane proteins in the biotinylated fraction compared with the lysate and to the FACS-retrieved proteins. Scale bars, 100 μm (B and I) and 10 μm (J).
Figure 2
Figure 2
Proteins Associated with Lamellipodia and Filopodia, Detected in Apical and Basolateral Locations of the Radial Glia (A) Hierarchical clustering for proteins associated with lamellipodia and filopodia, revealing that some of them display age-related changes. (B–V′) Lipofections in vivo were performed and imaged after fixation as whole-mount preparations or as sections (Q–S). (B–D) Overview of one telencephalic hemisphere visualized from the top onto the dorsal surface as a maximum-intensity projection. (B) Cell bodies of the radial glia are labeled by the gfap:GFP transgene. (C) A small, variable number of cells per brain were labeled by the in vivo lipofection (maximum 12 cells per brain); their somata and branched radial processes into the parenchyme are visible (inset is a higher magnification), revealing the soma at the top (apical side) and the radial process in the parenchyme with numerous branches. All lipofected cells displayed this radial process, but it is not visible on all pictures. (D) Merged channels. (E–G) Apical surface of one radial glia, viewed from the top, depicting the existence of lamellipodia extending laterally (arrow in F and G). (H–J) Apical surface of one radial glia, depicting the existence of filopodia (arrow in I and J). (K–M) Filopodia are also extending from the basolateral cell surface toward apical locations on neighboring cells (arrow in L and M). (N–P) The longest filopodia span below 4 cell diameters. (Q–S) lipofection with Lifeact-RFP also reveals basolateral extensions (arrows in R and S). (T–V) Apical view on a cell co-lipofected with the membrane-localized Lyn-GFP (T) and the F-actin localized Lifeact-RFP (U) revealing the presence of filopodial extensions with F-actin (yellow arrows) or without (white arrow). (V′) Lateral view of the same cell. Green lines in (K), (N), and (Q) depict the ventricular surface. Scale bars, 100 μm (D) and 10 μm (G, J, M, P, S, and V).
Figure 3
Figure 3
Expression Changes with Age in the Ventricular Zone (A) Hierarchical clustering of all proteins in the ventricular zone using normalized log2 transformed abundances of three old and three young brain samples (high-abundance proteins colored blue, low-abundance proteins yellow). (B) Principal component analysis of the three samples of old brain and three samples of young brain. (C) Volcano plot analysis: ratios of the means of all protein abundances in the three old compared with the three young brain samples were plotted against the corresponding negative log10 transformed p value.
Figure 4
Figure 4
The IGF Signaling Pathway Declines with Age (A) Hierarchical clustering of the IGF, Insulin, and Akt pathway protein members identified in the surface fraction, revealing the differential expressions in young and old dorsal surface fractions (scale: log2 young/old). Insulin receptor B, as well as IGF1 receptors a and b, are downregulated with age, while some other components are upregulated (i.e., MAP2K1 and BRAF). (B) Representation of the signaling pathway with color coding (blue, upregulated young; yellow, upregulated old). (C–J) Phosphorylated IGF1R (P-IGF1R) immunohistochemistry (Tyr1161) on young (5 months, C–F) and old (2 years, G–J) brains as a close-up view on the ventricular surface of the dorsal pallium depicted as single confocal planes. The radial glia somata, located at the border of the ventricle, express P-IGF1R (yellow arrows). We observe the distinct expression levels of P-IGF1R in young and old brains in a total of 4 young and 4 old immunosamples. Scale bar, 10 μm.
Figure 5
Figure 5
IGF2b Overexpression Activates the IGF1R in Lipofected Cells (A–P) P-IGF1R immunohistochemistry on young (A–H) and old (I–P) brains. The radial glia are labeled by the gfap:GFP transgene. Single cells in magenta have been lipofected in vivo 4 days prior to brain fixation with mtdTomato (control, A–D and I–L) or with mtdTomato and igf2b (IGF2b, E–H and M–P), highlighting primarily the cell soma (the radial process is not always in the plane of the optical section, but it is present below the somata of lipofected cells). We observe the distinct expression levels of P-IGF1R in young control (C and D), young + IGF2b (highest, arrows in G and H), old control (K and L), and old + IGF2b (a few dots, arrows in O and P). Insets in (D), (H), (L), and (P) are close-ups of the lipofected cells; nuclei in blue stained by DAPI. Single confocal planes are displayed. Scale bar, 10 μm. (Q) The mean intensity of the phospho-IGF staining was measured on 7 lipofected cells and their immediate neighbors in each condition. Staining intensities differ significantly between control and igf2b-lipofected brains (t test; p = 0.030) in young but not in old brains.
Figure 6
Figure 6
Overexpression of IFG2b Induces Complete Cell Division in Young Cells, but Incomplete Division in Old Cells (A–P) Brains were lipofected in vivo 4 days prior to fixation with mtdTomato (control, A–D and I–L) or with mtdTomato and igf2b (IGF2b, E–H and M–P). Single confocal planes are displayed in the left panels and 3D reconstructions in the rightmost panels (D, H, L, and P). Cell nuclei (Hoechst, gray) and membrane labeling of the lipofected cells (magenta) are shown in (A), (E), (I), and (M). (A–D) Young control lipofected cells reveal infrequent cell division events, while young cells with IGF2b overexpression (E–H) reveal a higher incidence of cell division events, being visible as two neighboring cells immediately abutting each other (E–H, arrows). (M–P) Old control lipofected cells with IGF2b overexpression result in large cells with two nuclei, indicating an incomplete division (arrows in M, N, and P). (Q–W) Brains fixed 5 days after igf2b lipofection also reveal binucleated large cells (arrows in Q, R, and W), visible here in two distinct confocal planes (Q–S and T–V). Some neighboring cells reveal the same phenotype (arrowheads in Q, T, and U). (X) Cells having divided after lipofection were quantified in 6 experiments with a total of 69 young-control, 114 young-igf2b, 64 old-control, and 71 old-igf2b cells. The significance was calculated by a chi-squared test (young, ∗∗∗p = 0.7 × 10−3; old, p = 0.01). Scale bars, 10 μm.

Similar articles

Cited by

References

    1. Adolf B., Chapouton P., Lam C.S., Topp S., Tannhauser B., Strahle U., Gotz M., Bally-Cuif L. Conserved and acquired features of adult neurogenesis in the zebrafish telencephalon. Dev. Biol. 2006;295:278–293. - PubMed
    1. Alagappan D., Ziegler A.N., Chidambaram S., Min J., Wood T.L., Levison S.W. Insulin-like growth factor receptor signaling is necessary for epidermal growth factor mediated proliferation of SVZ neural precursors in vitro following neonatal hypoxia-ischemia. Front. Neurol. 2014;5:79. - PMC - PubMed
    1. Alunni A., Bally-Cuif L. A comparative view of regenerative neurogenesis in vertebrates. Development. 2016;143:741–753. - PMC - PubMed
    1. Alunni A., Krecsmarik M., Bosco A., Galant S., Pan L., Moens C.B., Bally-Cuif L. Notch3 signaling gates cell cycle entry and limits neural stem cell amplification in the adult pallium. Development. 2013;140:3335–3347. - PMC - PubMed
    1. Barbosa J.S., Sanchez-Gonzalez R., Di Giaimo R., Baumgart E.V., Theis F.J., Gotz M., Ninkovic J. Neurodevelopment. Live imaging of adult neural stem cell behavior in the intact and injured zebrafish brain. Science. 2015;348:789–793. - PubMed

Publication types