. 2019 Feb:40:382-393.
doi: 10.1016/j.ebiom.2019.01.003. Epub 2019 Jan 11.

Identification of candidate diagnostic and prognostic biomarkers for pancreatic carcinoma

Affiliations

Identification of candidate diagnostic and prognostic biomarkers for pancreatic carcinoma

Yang Cheng et al. EBioMedicine. 2019 Feb.

Abstract

Background: Pancreatic carcinoma (PC) is one of the most aggressive cancers affecting human health. It is essential to identify candidate biomarkers for the diagnosis and prognosis of PC. The present study aimed to investigate the diagnosis and prognosis biomarkers of PC.

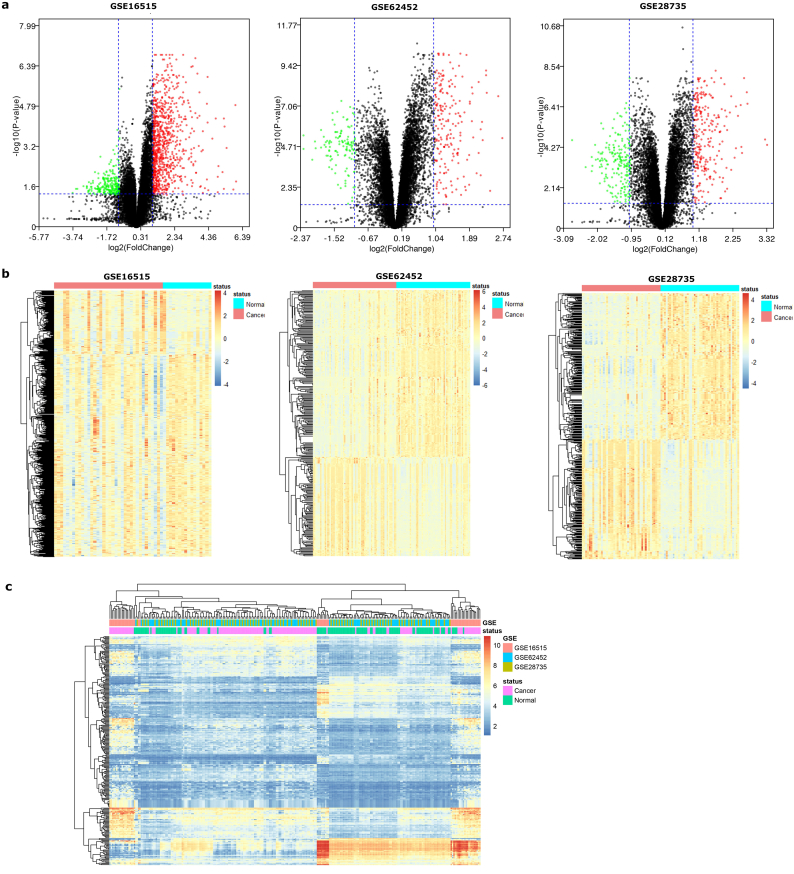
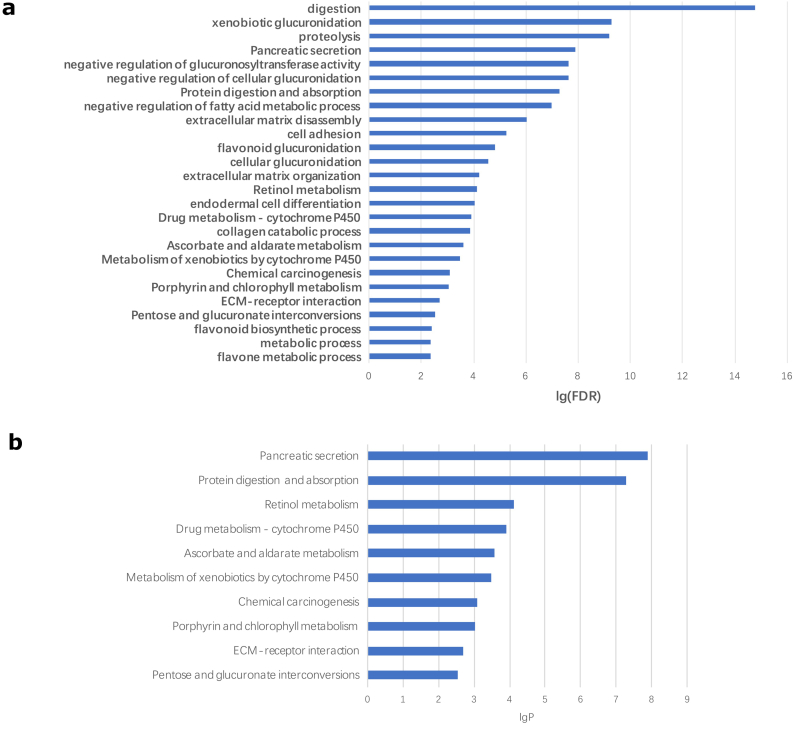
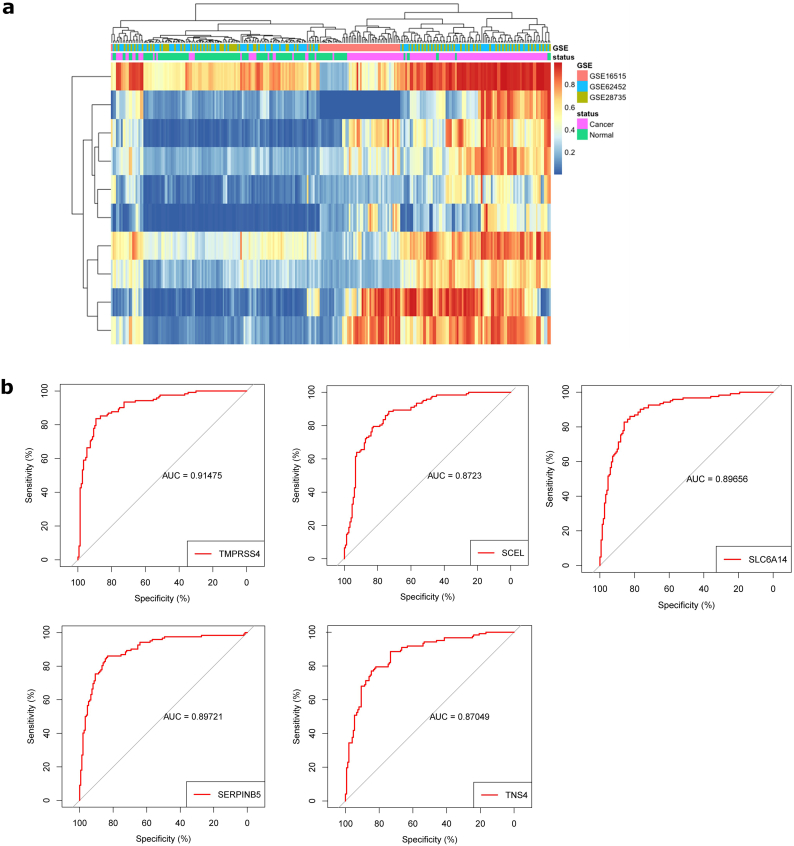
Methods: Differentially expressed genes (DEGs) were identified from the mRNA expression profiles of GSE62452, GSE28735 and GSE16515. Functional analysis and the protein-protein interaction network analysis was performed to explore the biological function of the identified DEGs. Diagnosis markers for PC were identified using ROC curve analysis. Prognosis markers were identified via survival analysis of TCGA data. The protein expression pattern of the identified genes was verified in clinical tissue samples. A retrospective clinical study was performed to evaluate the correlation between the expression of candidate proteins and survival time of patients. Moreover, comprehensive analysis of the combination of multiple genes/proteins for the prognosis prediction of PC was performed using both TCGA data and clinical data. In vitro studies were undertaken to elaborate the potential roles of these biomarkers in clonability and invasion of PC cells.

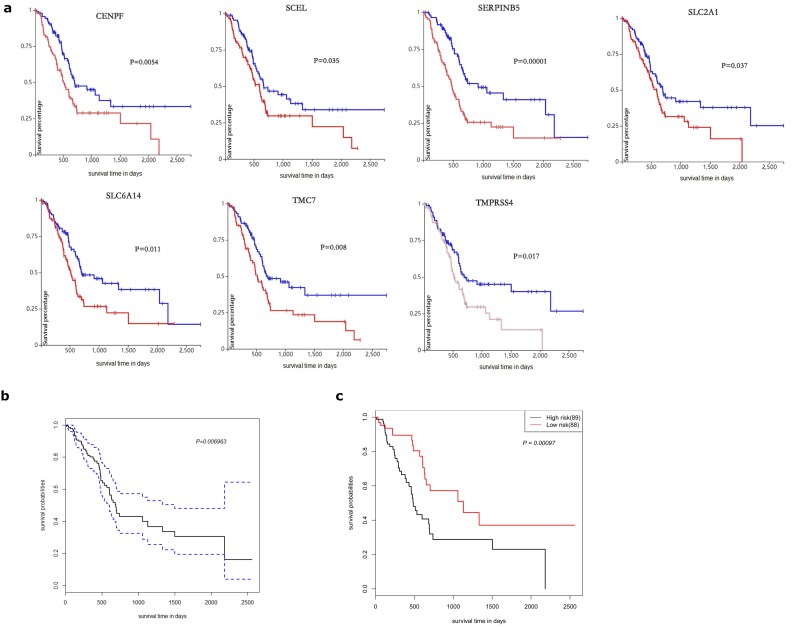
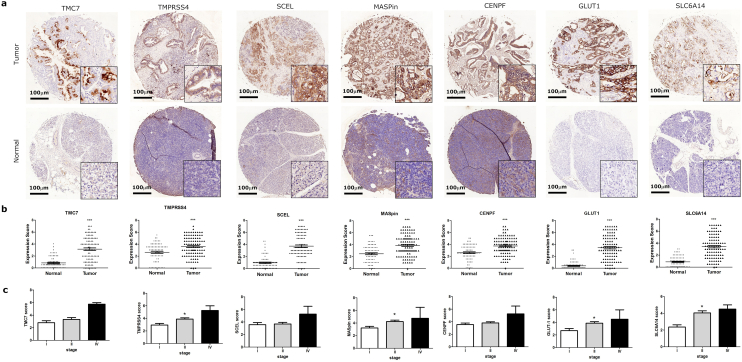
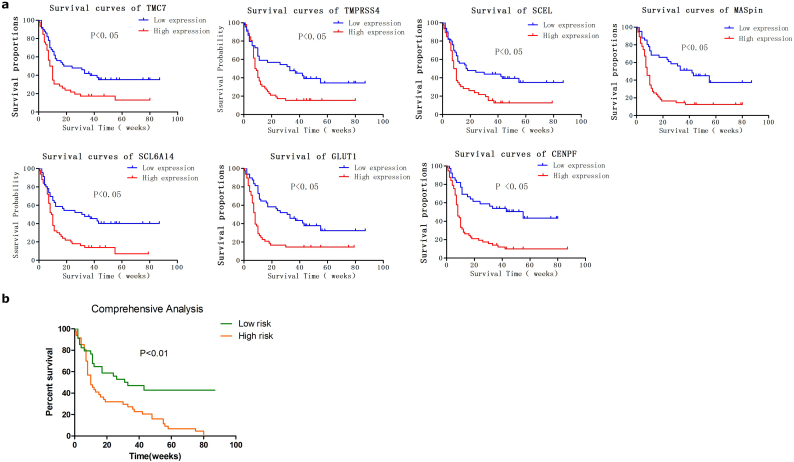
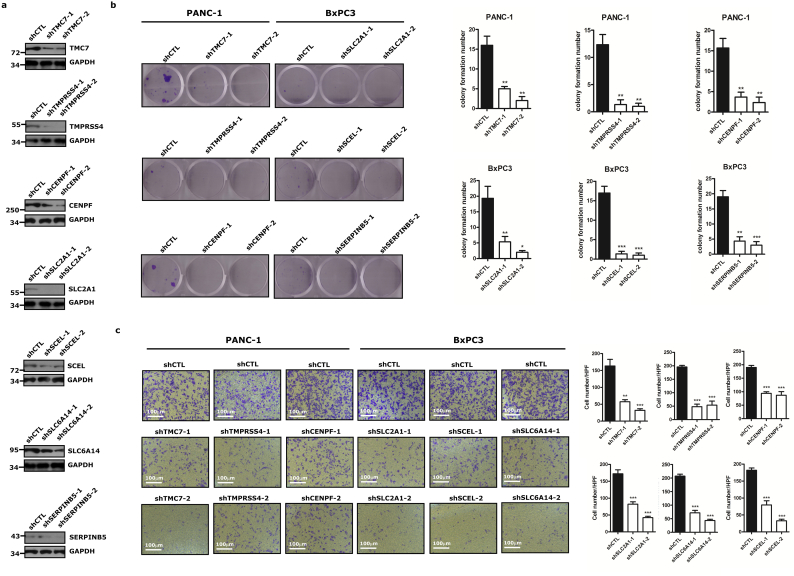
Findings: In total, 389 DEGs were identified. These genes were mainly associated with pancreatic secretion, protein digestion and absorption, cytochrome P450 drug metabolism, and energy metabolism pathway. The top 10 genes were filtered out following Fisher's exact test. ROC curve analysis demonstrated that TMPRSS4, SERPINB5, SLC6A14, SCEL, and TNS4 could be used as biomarkers for the diagnosis of PC. Survival analysis of TCGA data and clinical data suggested that TMC7, TMPRSS4, SCEL, SLC2A1, CENPF, SERPINB5 and SLC6A14 can be potential biomarkers for the prognosis of PC. Comprehensive analysis show that a combination of identified genes/proteins can predict the prognosis of PC. Mechanistically, the identified genes attributes to clonability and invasiveness of PC cells.

Interpretation: We synthesized several sets of public data and preliminarily clarified pathways and functions of PC. Candidate molecular markers were identified for diagnosis and prognosis prediction of PC including a novel gene, TMC7. Moreover, we found that the combination of TMC7, TMPRSS4, SCEL, SLC2A1, CENPF, SERPINB5 and SLC6A14 can serve as a promising indicator of the prognosis of PC patients. The candidate proteins may attribute to clonability and invasiveness of PC cells. This research provides a novel insight into molecular mechanisms as well as diagnostic and prognostic markers of PC. FUND: National Natural Science Foundation of China [No. 81602646 &81802339], Natural Science Foundation of Guangdong Province [No. 2016A030310254] and China Postdoctoral Science Foundation [No. 2016M600648].

Keywords: Biomarker; Diagnosis; Function; Pancreatic carcinoma; Prognosis.


Figures

Fig. 1
Fig. 1
Identification of differentially expressed genes in PC and data integration. (A) Volcano plot of genome-wide gene expression profiles in PC and adjacent normal tissues from GSE16515, GSE62452 and GSE28735. Red plots represent aberrantly expressed mRNAs with P < 0.05 and absolute log2FC > 1. Black plots represent normally expressed mRNAs. Green plots represent aberrantly expressed mRNAs with P < 0.05 and log2FC < −1. The abscissa shows the value of fold change in gene expression between tumors and normal tissues. The ordinate means the −log10 of the adjusted P value for each gene. (B) Heatmap analysis of differential expression profiles between normal tissues and cancer tissues from the three GEO databases. DEGs were defined with p < 0.05 and |log2FC| > 1. (C) The cluster heatmap of 389 consistently expressed DEGs from integrated analyses of the three GEO datasets. The normalized expression values are represented in shades of red and green, indicating expression above and below the median expression value across all tissues, respectively. (For interpretation of the references to colour in this figure legend, the reader is referred to the web version of this article.)
Fig. 2
Fig. 2
Significantly enriched pathway terms of DEGs in pancreatic carcinoma. (A) DEG functional and signaling pathway enrichment were conducted using online websites for GO and KEGG pathways (B). Significantly enriched GO terms of DEGs in PC are shown based on their functions. P < 0.05 was set as the threshold. The false discovery rate (FDR) was controlled at the 0.01 threshold.
Fig. 3
Fig. 3
Identification of key genes for diagnosis of PC. (A) Hierarchical clustering analysis of the top ten DEGs identified by Fisher's exact test. (B) ROC analysis of the top ten DEGs. Genes with an AUC value of >0.85 are shown.
Fig. 4
Fig. 4
Prognostic value of DEGs for PC in TCGA dataset. (A) Kaplan-Meier survival curves for patients of PC with high and low indicated gene expression in TCGA dataset. (B) The Univariate Cox regression model on TCGA dataset using the seven genes. (C) Kaplan-Meier survival curves for patients in the high-risk group and low-risk group using the Cox regression model based on TCGA data. P-Values were calculated using the log-rank test.
Fig. 5
Fig. 5
Differentially expressed proteins in human PC tissue and normal pancreatic tissue. (A) The protein expression of CENPF, SCEL, SERPINB5 (MASPin), SLC2A1(GLUT-1), SLC6A14, TMC7 and TMRSS4 in clinical human PC tissue and normal tissue was detected by IHC. Representative photos are shown (100× and 400×). Scale bar = 100 μm. (B) Protein expression scores in PC tissue and normal pancreatic tissue are shown. Significance tested by t-test, ***p < 0.001 versus normal tissue. (C) The expression of indicated proteins in PC tissue from patients at different stages. Significance tested by one-way ANOVA, * p < 0.05 versus Stage I. All data are represented by mean ± SEM.
Fig. 6
Fig. 6
Prognostic value of differentially expressed proteins for clinical pancreatic carcinoma. (A) Kaplan-Meier Survival curves for clinical PC patients with high and low expression of CENPF, SCEL, SERPINB5 (MASpin), SLC2A1(GLUT-1), SLC6A14, TMC7 and TMRSS4. (B) Survival curves for patients in the high-risk group and low-risk group based on expression scores of the differentially expressed proteins. Patients with high expression of more than four of the seven proteins were assigned to the high-risk group. The remaining patients were assigned to the low-risk group. P-Values were calculated using the log-rank test.
Fig. 7
Fig. 7
Targeted genes/proteins contribute to clonability and invasiveness of PC cells in vitro. (A) PANC-1 cells were transient transfected with shRNA of TMC7, TMPRSS4, CENPF and control shRNA (shCTL). BxPC3 cells were transient transfected with shRNA of SLC2A1, SCEL, SERPINB5, SLC6A14 and shCTL. Western blot was used to detect the transfection efficiency. (B) Colony formation test of treated PANC-1 and BxPC3 cells was done. (C) Transwell assay in specific shRNA transfected or control PANC-1 and BxPC3 cells. Cells that had passed through the membrane were counted. Representative images are shown. Significance tested by one-way ANOVA, **p < 0.01; ***p < 0.001 versus shCTL. All data are represented by mean ± SEM.

References

    1. Abel E.V., Simeone D.M. Biology and clinical applications of pancreatic cancer stem cells. Gastroenterology. 2013 Jun;144(6):1241–1248. - PubMed
    1. McGuire S. World Cancer Report 2014. Geneva, Switzerland: World Health Organization, International Agency for Research on Cancer, WHO Press, 2015. Advances in nutrition (Bethesda, Md). 2016 Mar;7(2):418–9. . - PMC - PubMed
    1. Wolfgang C.L., Herman J.M., Laheru D.A., Klein A.P., Erdek M.A., Fishman E.K. Recent progress in pancreatic cancer. CA Cancer J Clin. 2013 Sep;63(5):318–348. - PMC - PubMed
    1. Maeda S., Shinchi H., Kurahara H., Mataki Y., Noma H., Maemura K. Clinical significance of midkine expression in pancreatic head carcinoma. Br J Cancer. 2007 Aug 6;97(3):405–411. - PMC - PubMed
    1. Harsha H.C., Kandasamy K., Ranganathan P., Rani S., Ramabadran S., Gollapudi S. A compendium of potential biomarkers of pancreatic cancer. PLoS Med. 2009 Apr 7;6(4) - PMC - PubMed

Substances