. 2019 Feb:40:43-55.
doi: 10.1016/j.ebiom.2019.01.009. Epub 2019 Jan 11.

Autocrine CTHRC1 activates hepatic stellate cells and promotes liver fibrosis by activating TGF-β signaling

Affiliations

Autocrine CTHRC1 activates hepatic stellate cells and promotes liver fibrosis by activating TGF-β signaling

Jun Li et al. EBioMedicine. 2019 Feb.

Erratum in

Abstract

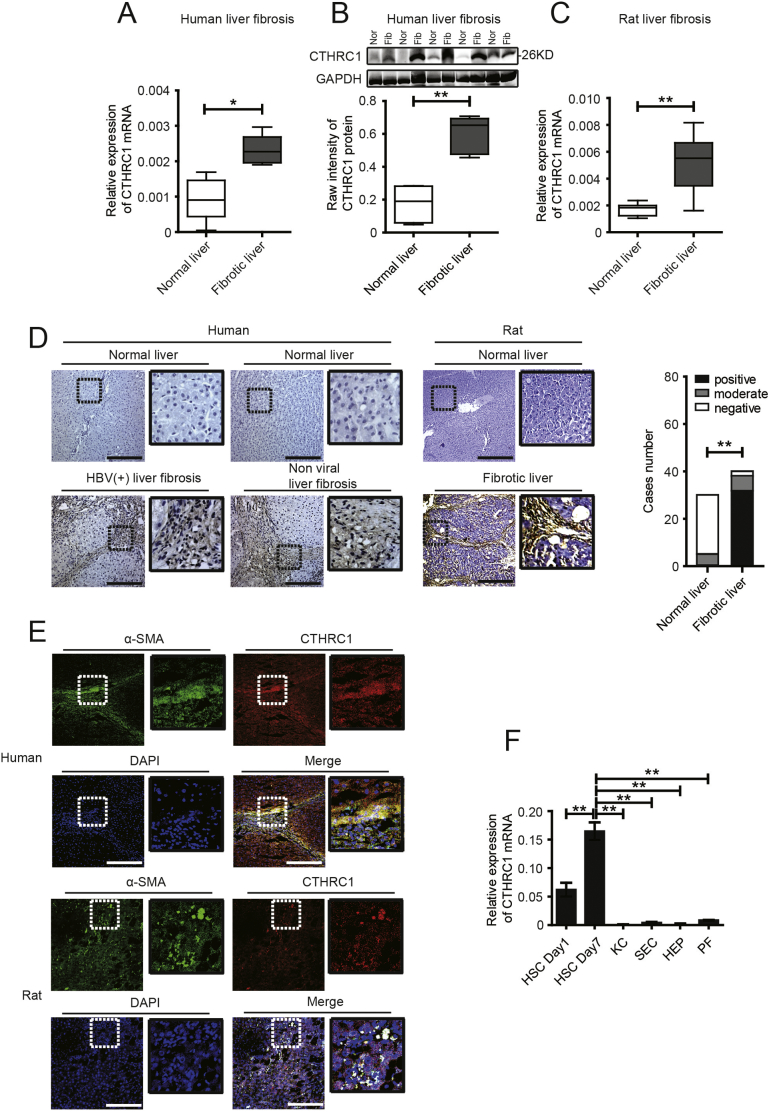
Background: Hepatic fibrosis is caused by chronic liver injury and may progress toward liver cirrhosis, and even hepatocellular carcinoma. However, current treatment is not satisfactory. Therefore, there is a mandate to find novel therapeutic targets to improve therapy, and biomarkers to monitor therapeutic response.

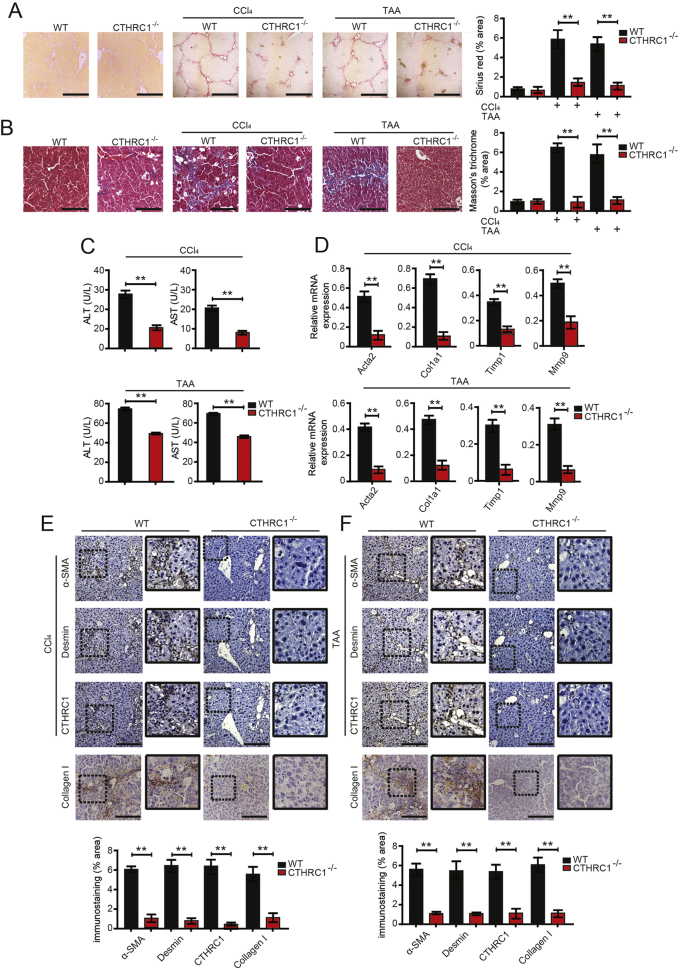
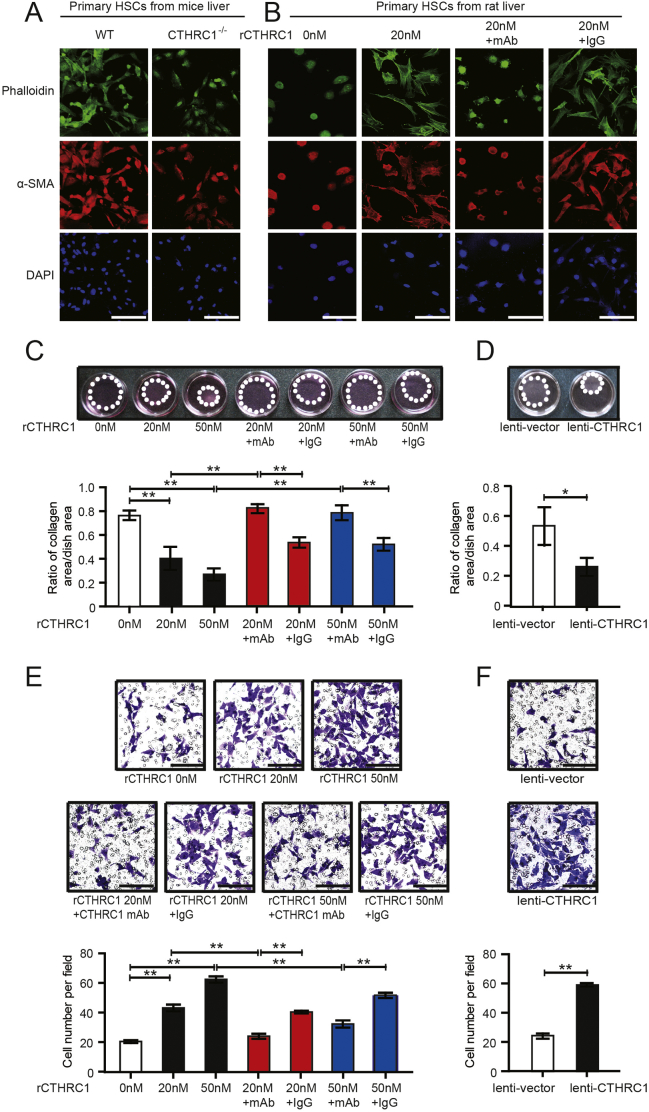
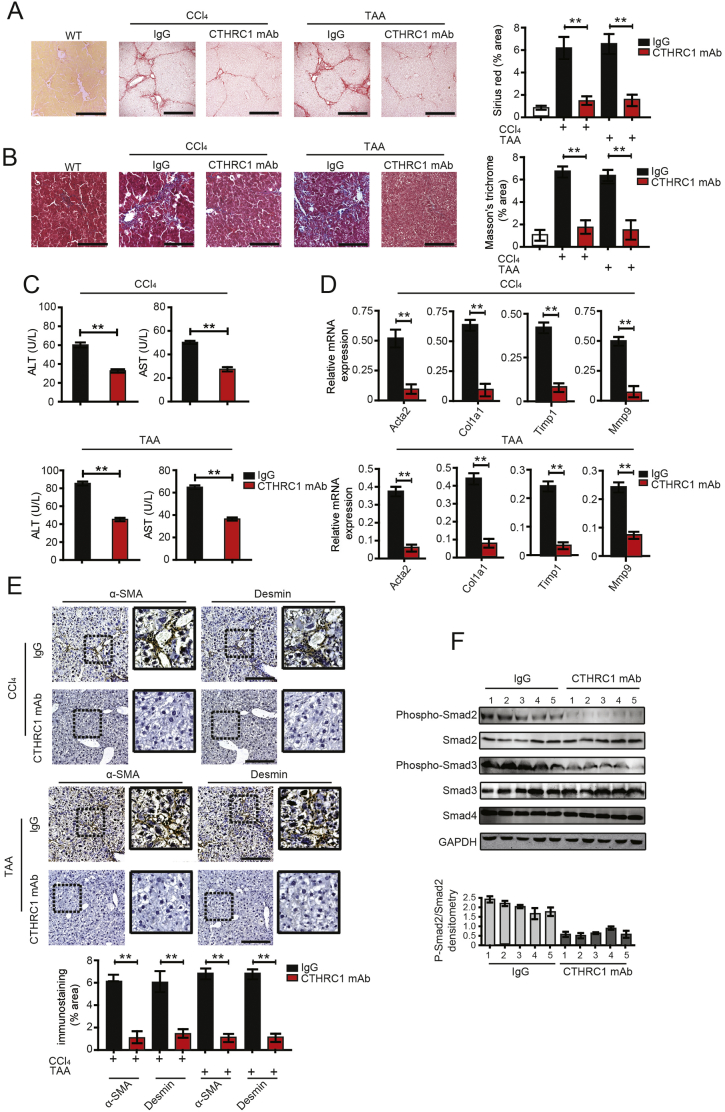
Methods: Liver fibrosis was induced by carbon tetrachloride (CCl4) or thioacetamide (TAA) in wild type (WT) or CTHRC1-/- mice, followed by immunofluorescence and immunohistochemical analyses. CTHRC1 monoclonal antibody (mAb) was used to abrogate the effect of CTHRC1 in vitro and in vivo.

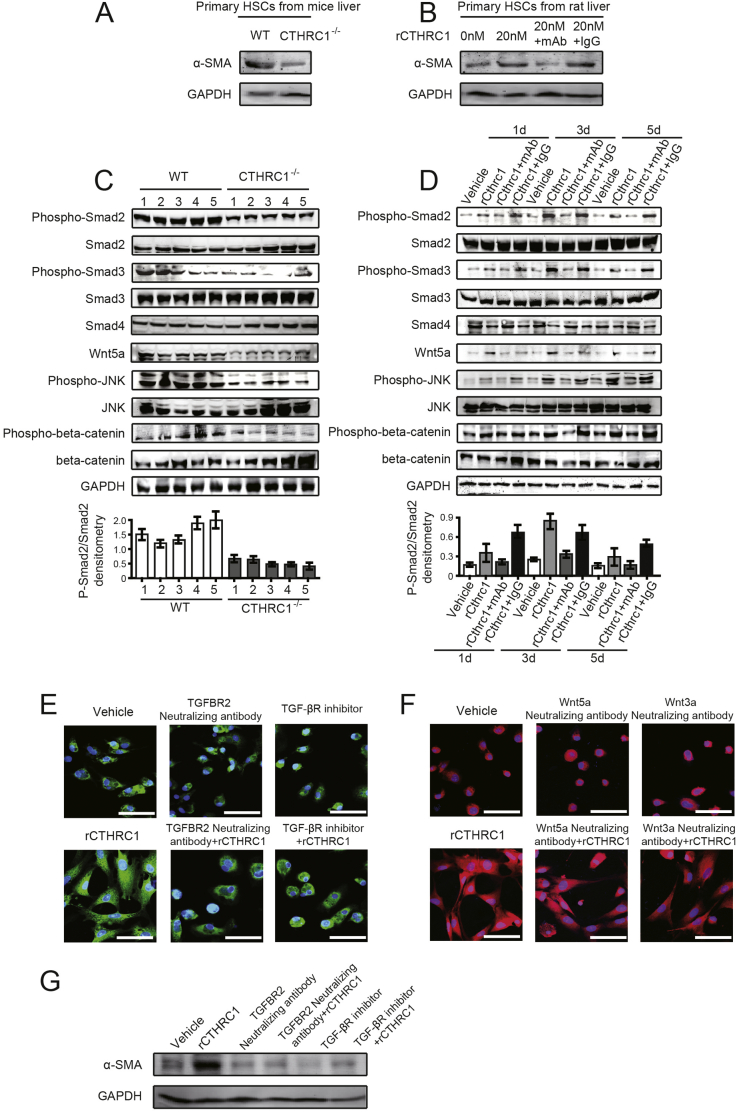
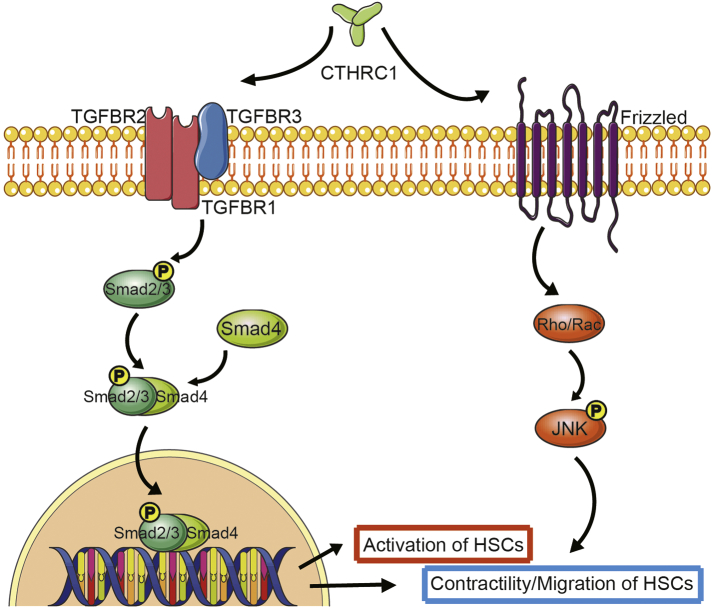
Results: Here, we reported that collagen triple helix repeat containing 1 (CTHRC1), a secreted protein derived from hepatic stellate cells (HSCs), was significantly up-regulated in fibrotic liver tissues. CTHRC1 promoted HSCs transformation from a quiescent to an activated state, and enhanced migratory or contractile capacities of HSCs by activating TGF-β signaling. Meanwhile, CTHRC1 competitively bound to Wnt noncononical receptor and promoted the contractility but not activation of HSCs. CCl4 or TAA-induced liver fibrosis was attenuated in CTHRC-/- mice compared with littermate control, while a monoclonal antibody of CTHRC1 suppressed liver fibrosis in WT mice treated with CCl4 or TAA.

Interpretation: We demonstrated that CTHRC1 is a new regulator of liver fibrosis by modulating TGF-β signaling. Targeting CTHRC1 could be a promising therapeutic approach, which can suppress TGF-β signaling and avoid the side effects caused by directly targeting TGF-β. CTHRC1 could also be a potential biomarker for monitoring response to anti-fibrotic therapy. FUND: This study was supported by the National Natural Science Foundation of China (ID 81672358, 81871923, 81872242, 81802890), the Shanghai Municipal Education Commission-Gaofeng Clinical Medicine Grant Support (ID 20181708), the Natural Science Foundation of Shanghai (ID 17ZR1428300, 18ZR1436900), and Shanghai Municipal Health Bureau (ID 2018BR32). The funders did not play a role in manuscript design, data collection, data analysis, interpretation nor writing of the manuscript.

Keywords: CTHRC1; HSCs; Liver fibrosis; TGF-β signaling.


Figures

Fig. 1
Fig. 1
CTHRC1 is up-regulated in fibrotic liver tissues and mainly derived from activated hepatic stellate cells (HSCs). A and B. Real-time quantitative PCR (A) and western blotting (B) analysis of CTHRC1 in human fibrotic (Fib) (n = 5) and normal liver tissues (Nor) (n = 5). C. Real-time quantitative PCR analysis of CTHRC1 in CCl4-induced rat fibrotic (n = 7) and normal liver tissues (n = 7). D. Immunohistochemical staining of CTHRC1 in a human tissue microarray that contained fibrotic (n = 40) and normal liver tissue (n = 30) samples (D, left photos), and CCl4-induced fibrotic and normal rat liver tissues (D, right photos). Scale bars, 100 μm. The percentage of tissue cores displaying negative, moderate or positive CTHRC1 staining. Statistical analysis of CTHRC1 expression in human fibrotic and normal liver tissue microarray was shown right. E. Immunofluorescence images of α-SMA (green), CTHRC1 (red), DAPI (blue) and merge (yellow) in human and rat fibrotic liver tissues. Scale bars, 100 μm. F. Relative CTHRC1 mRNA expression in primary HSCs, Kupffer cells (KC), sinusoidal endothelial cells (SEC), hepatocytes (HEP) and portal fibroblasts (PF), isolated from rat livers (n = 5). *P < .05, **P < .01. (For interpretation of the references to colour in this figure legend, the reader is referred to the web version of this article.)
Fig. 2
Fig. 2
CTHRC1 contributes to liver fibrosis in vivo. A and B. Sirius red and Masson's trichrome staining in the livers of WT (n = 5), CTHRC1−/− (n = 5), WT (n = 10) and CTHRC1−/− mice (n = 10) consecutively injected intraperitoneally with CCl4 (A) or TAA (B) for 8 weeks. Scale bars, 100 μm. Quantification of sirius red and Masson's trichrome staining was shown right. C. The serum levels of ALT and AST in WT (n = 10) and CTHRC1−/− mice (n = 10) consecutively injected intraperitoneally with CCl4 or TAA for 8 weeks. D. The hepatic levels of Acta2, Col1a1, Timp1 and Mmp9 mRNA in WT (n = 10) and CTHRC1−/− mice (n = 10) were determined by qPCR. E. WT and CTHRC1−/− mice were intraperitoneally injected with consecutive CCl4 for 8 weeks and their liver serial sections were subjected to immunostaining with α-SMA, desmin, collagen I and CTHRC1 antibodies. Scale bars, 100 μm. Quantification of immunostaining was shown below. F. Mice were intraperitoneally injected with consecutive TAA and their liver serial sections were subjected to immunostaining with α-SMA, desmin, collagen I and CTHRC1 antibodies. Scale bars, 100 μm. Quantification of immunostaining was shown below. **P < .01. (For interpretation of the references to colour in this figure legend, the reader is referred to the web version of this article.)
Fig. 3
Fig. 3
CTHRC1 promotes HSC activation, migratory and contractile capacities in vitro. A. Representative immunofluorescence images of phalloidin (green) and α-SMA (red) in primary HSCs after 7 days isolated from WT and CTHRC1−/− mice. Nuclei are stained with DAPI (blue). Scale bars, 50 μm. B. Immunofluorescence images of phalloidin (green) and α-SMA (red) in primary rat HSCs after 4 days, which were treated with vehicle, 20 nM purified recombinant CTHRC1 (rCTHRC1) protein alone, and 20 nM rCTHRC1 protein plus CTHRC1 mAb or IgG. Nuclei are stained with DAPI (blue). Scale bars, 50 μm. C. Collagen gel contraction assay of LX-2 treated with 0 nM, 20 nM or 50 nM rCTHRC1 protein alone, and 20 nM or 50 nM rCTHRC1 protein plus CTHRC1 mAb or IgG (n = 3 each group). Statistical analysis of collagen gel contractionis was shown below. D. Collagen gel contraction assay of LX-2/lenti-vector and LX-2/lenti-CTHRC1 (n = 3 each group). Statistical analysis was shown below. E. Representative images of LX-2 migration treated with 0 nM, 20 nM or 50 nM rCTHRC1 protein alone, and 20 nM or 50 nM rCTHRC1 protein plus CTHRC1 mAb or IgG, respectively (n = 3 each group). Scale bars, 100 μm. Statistical analysis of cell migration of LX-2 treated with 0 nM, 20 nM or 50 nM rCTHRC1 protein alone, and 20 nM or 50 nM rCTHRC1 protein plus CTHRC1 mAb or IgG was shown below. F. Representative images of LX-2/lenti-vector and LX-2/lenti-CTHRC1 cell migration (n = 3 each group). Scale bars, 100 μm. Statistical analysis of cell migration of LX-2/lenti-vector and LX-2/lenti-CTHRC1 was shown below. *P < .05, **P < .01. (For interpretation of the references to colour in this figure legend, the reader is referred to the web version of this article.)
Fig. 4
Fig. 4
CTHRC1 activates both TGF-β and Wnt signaling, while the promotive effect of CTHRC1 on HSC activation is mainly dependent on TGF-β signaling. A. The expression of α-SMA in primary HSCs after 7 days isolated from WT and CTHRC1−/− mice. B. The expression of α-SMA in primary rat HSCs after 4 days, which were treated with vehicle, 20 nM rCTHRC1 protein alone, and 20 nM rCTHRC1 protein plus CTHRC1 mAb or IgG. C. Western blotting analysis of phosphorylation of Smad2, Smad3, JNK, total Smad4 and expression of Wnt5a in five liver tissues of WT or CTHRC1−/− mice intraperitoneally injected with CCl4. GAPDH was the loading control. The densitometry of p-Smad2/Smad2 was shown below. D. Phosphorylation of Smad2, Smad3, JNK, total Smad4 and expression of Wnt5a in primary rat HSCs, which were treated with vehicle, 20 nM rCTHRC1 protein, and 20 nM rCTHRC1 protein plus CTHRC1 mAb or IgG for 1, 3, 5 days, individually. GAPDH was the loading control. The densitometry of p-Smad2/Smad2 was shown below. E and F. Representative immunofluorescence images of α-SMA (green in E, red in F) in primary rat HSCs after 4 days, which were treated with vehicle, 20 nM rCTHRC1 protein, and 20 nM rCTHRC1 protein plus neutralizing antibodies or inhibitor as follows: TGFBR2 neutralizing antibody or TGF-β receptor inhibitor (E), Wnt5a or Wnt3a neutralizing antibody (F). Nuclei are stained with DAPI (blue). Scale bars, 50 μm. G. The expression of α-SMA in primary rat HSCs after 4 days, which were treated with vehicle, 20 nM rCTHRC1 protein, and 20 nM rCTHRC1 protein plus TGFBR2 neutralizing antibody or TGF-β receptor inhibitor. GAPDH was the loading control. (For interpretation of the references to colour in this figure legend, the reader is referred to the web version of this article.)
Fig. 5
Fig. 5
CTHRC1 monoclonal antibody attenuates promotive effects of CTHRC1 on liver fibrosis. A and B. Sirius red and Masson's trichrome staining in the livers of WT, WT C57 mice treated with CCl4 (A) or TAA (B) and intraperitoneally injected with monoclonal antibody (mAb) of CTHRC1 (n = 10) or IgG (n = 10). Each mouse was intraperitoneally injected with CTHRC1 mAb at a dose of 5 μg/g body weight. Scale bars, 100 μm. Quantification of sirius red and Masson's trichrome staining was shown right. C. The serum levels of ALT and AST in WT C57 mice treated with CCl4 or TAA and intraperitoneally injected with mAb of CTHRC1 (n = 10) or IgG (n = 10). D. The hepatic levels of Acta2, Col1a1, Timp1 and Mmp9 mRNA in WT C57 mice treated with CCl4 or TAA and intraperitoneally injected with CTHRC1 mAb (n = 10) or IgG (n = 10) were determined by qPCR. E. Immunohistochemical staining of α-SMA and desmin in CCl4 (E, upper photos) and TAA (E, lower photos) induced liver fibrosis tissues of WT mice treated with CTHRC1 blocking antibody or IgG control, using serial sections. Scale bars, 100 μm. Quantification of immunostaining was shown below. F. Western blotting analysis of phosphorylation of Smad2, Smad3 and total Smad4 in five liver tissues of WT mice treated with CTHRC1 mAb or IgG. GAPDH was detected as the loading control. The densitometry of p-Smad2/Smad2 was shown below. **P < .01. (For interpretation of the references to colour in this figure legend, the reader is referred to the web version of this article.)
Fig. 6
Fig. 6
A model for CTHRC1 modulating HSC behaviors through TGF-β and Wnt signaling pathways. CTHRC1 induces activation of TGF-β downstream signaling molecules: Smad2, Smad3 and Smad4, which mediates the activation, migration and contractility of HSCs. In addition, CTHRC1 competitively binds to Wnt noncononical receptor and induces the phosphorylation of JNK, which mediates the contractility but not activation of HSCs.

References

    1. Bataller R., Brenner D.A. Liver fibrosis. J Clin Invest. 2005 Feb;115(2):209–218. PubMed PMID: 15690074. Pubmed Central PMCID: 546435. - PMC - PubMed
    1. Schuppan D., Afdhal N.H. Liver cirrhosis. Lancet. 2008 Mar 8;371(9615):838–851. PubMed PMID: 18328931. Pubmed Central PMCID: 2271178. - PMC - PubMed
    1. Friedman S.L. Mechanisms of hepatic fibrogenesis. Gastroenterology. 2008 May;134(6):1655–1669. PubMed PMID: 18471545. Pubmed Central PMCID: 2888539. - PMC - PubMed
    1. Lee Y.A., Wallace M.C., Friedman S.L. Pathobiology of liver fibrosis: a translational success story. Gut. 2015 May;64(5):830–841. PubMed PMID: 25681399. Pubmed Central PMCID: 4477794. - PMC - PubMed
    1. Popov Y., Schuppan D. Targeting liver fibrosis: strategies for development and validation of antifibrotic therapies. Hepatology. 2009 Oct;50(4):1294–1306. PubMed PMID: 19711424. - PubMed

MeSH terms