. 2019 Apr;1864(4):500-511.
doi: 10.1016/j.bbalip.2019.01.007. Epub 2019 Jan 9.

Hepatocyte-specific lysosomal acid lipase deficiency protects mice from diet-induced obesity but promotes hepatic inflammation

Affiliations

Hepatocyte-specific lysosomal acid lipase deficiency protects mice from diet-induced obesity but promotes hepatic inflammation

Christina Leopold et al. Biochim Biophys Acta Mol Cell Biol Lipids. 2019 Apr.

Abstract

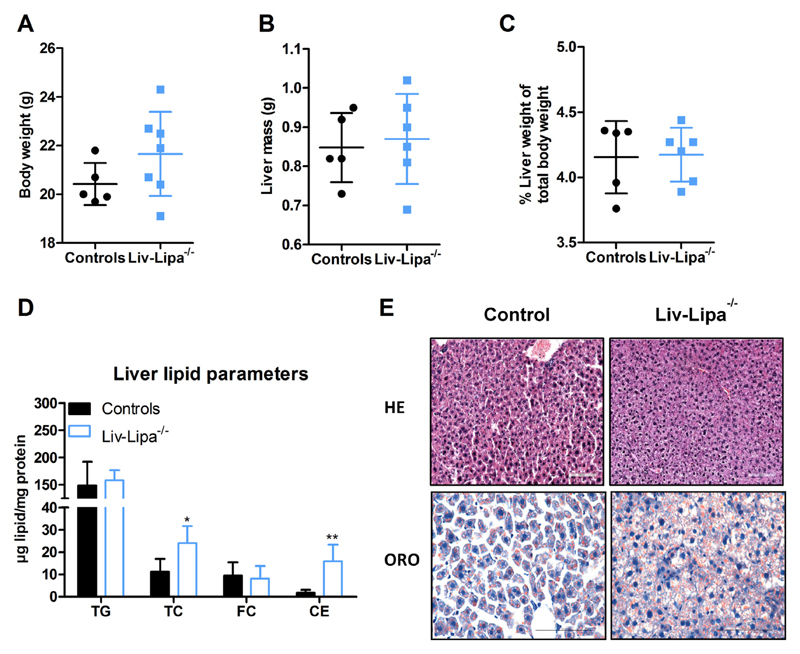
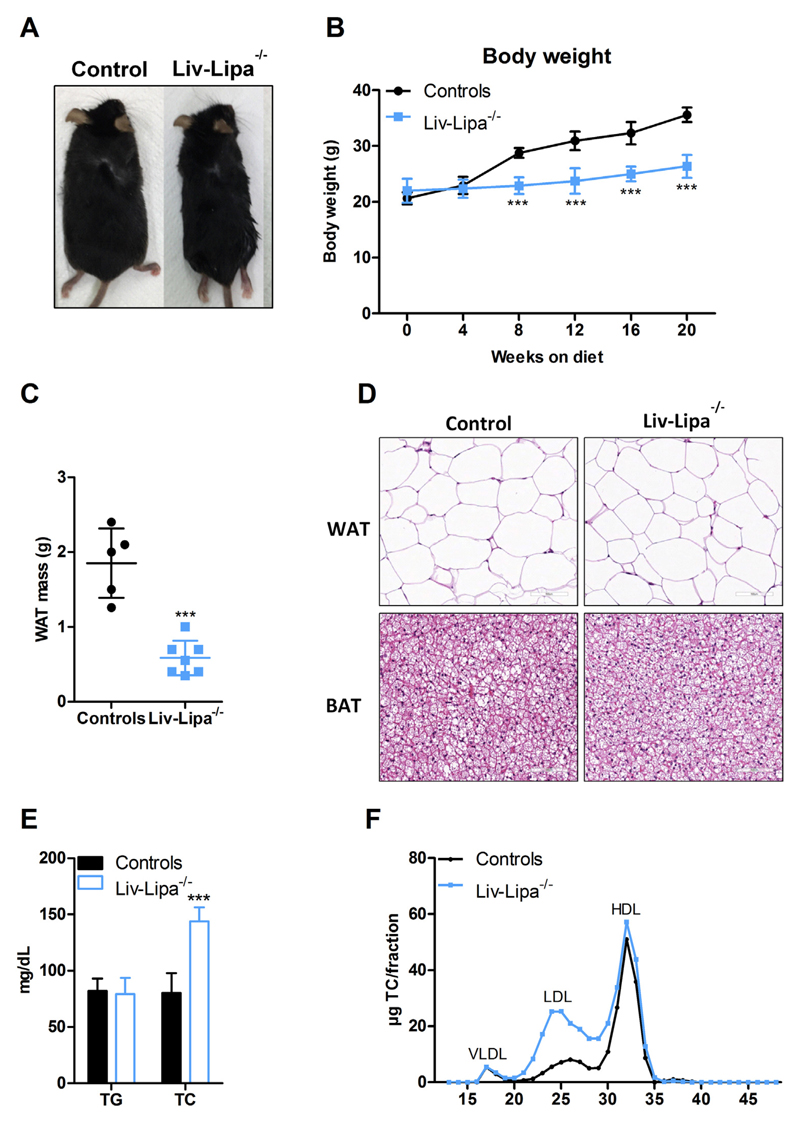
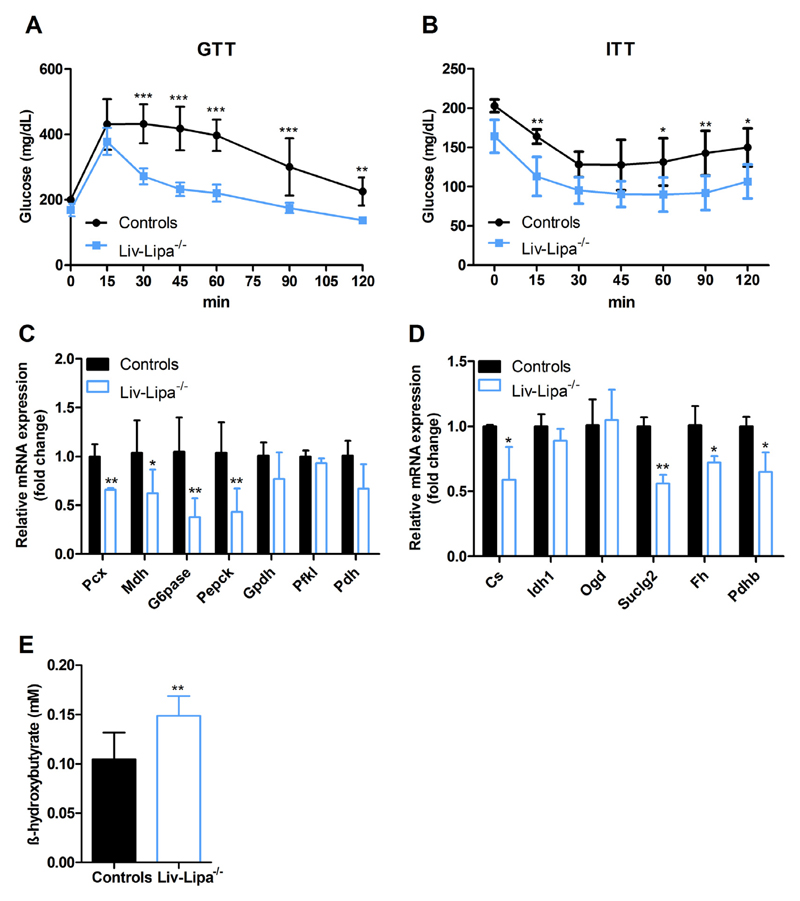
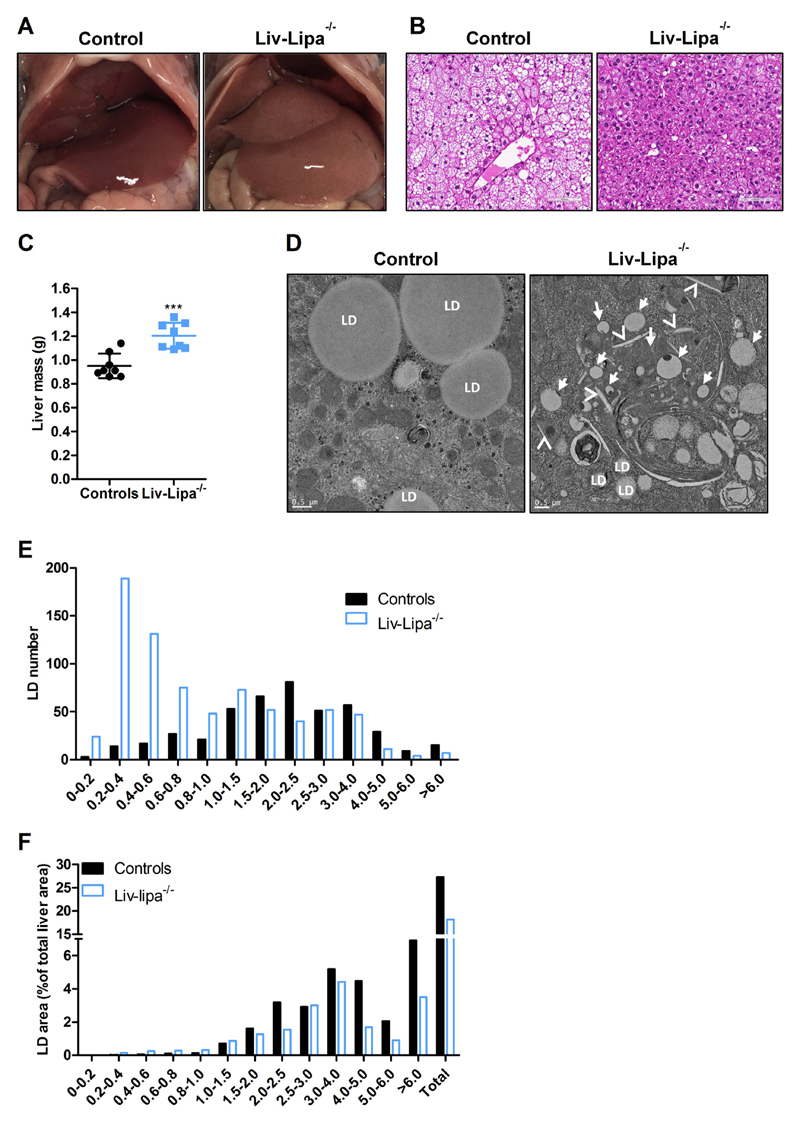
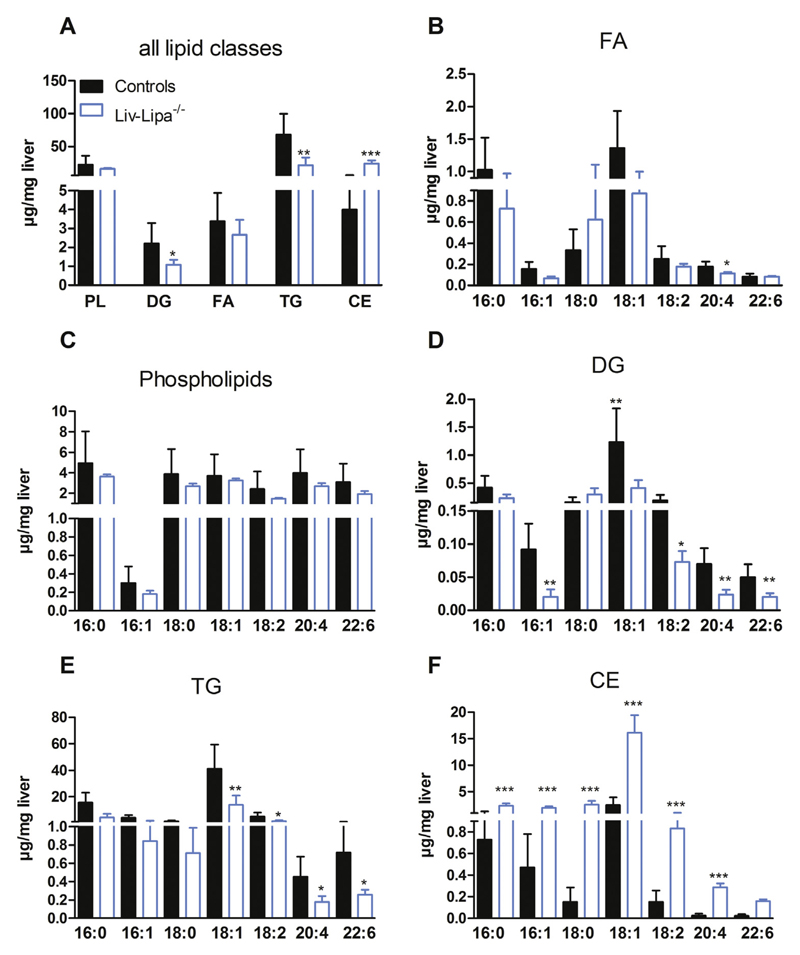
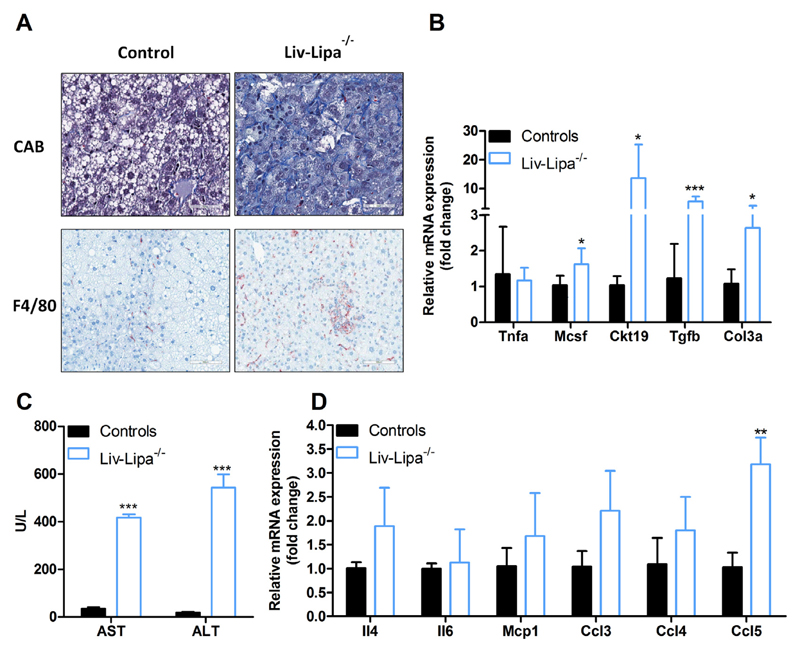
Lysosomal acid lipase (LAL) hydrolyzes cholesteryl esters (CE) and triglycerides (TG) to generate fatty acids (FA) and cholesterol. LAL deficiency (LAL-D) in both humans and mice leads to hepatomegaly, hypercholesterolemia, and shortened life span. Despite its essential role in lysosomal neutral lipid catabolism, the cell type-specific contribution of LAL to disease progression is still elusive. To investigate the role of LAL in the liver in more detail and to exclude the contribution of LAL in macrophages, we generated hepatocyte-specific LAL-deficient mice (Liv-Lipa-/-) and fed them either chow or high fat/high cholesterol diets (HF/HCD). Comparable to systemic LAL-D, Liv-Lipa-/- mice were resistant to diet-induced obesity independent of food intake, movement, and energy expenditure. Reduced body weight gain was mainly due to reduced white adipose tissue depots. Furthermore, Liv-Lipa-/- mice exhibited improved glucose clearance during glucose and insulin tolerance tests compared to control mice. Analysis of hepatic lipid content revealed a massive reduction of TG, whereas CE concentrations were markedly increased, leading to CE crystal formation in the livers of Liv-Lipa-/- mice. Elevated plasma transaminase activities, increased pro-inflammatory cytokines and chemokines as well as hepatic macrophage infiltration indicated liver inflammation. Our data provide evidence that hepatocyte-specific LAL deficiency is sufficient to alter whole-body lipid and energy homeostasis in mice. We conclude that hepatic LAL plays a pivotal role by preventing liver damage and maintaining lipid and energy homeostasis, especially during high lipid availability.

Keywords: Cholesteryl ester storage disease; Fibrosis; LAL-D; Lipid; Liver damage; Wolman disease.


Conflict of interest statement

Conflict of interest

The authors declare that there is no conflict of interest associated with this manuscript.

Figures

Fig. 1
Fig. 1
LAL is efficiently knocked out in hepatocytes of Liv-Lipa−/− mice. Fifteen week old male ad libitum chow diet-fed Lipafl/fl (controls) and Liv-Lipa−/− mice were used. Lipa mRNA expression relative to cyclophilin A as reference gene in (A) indicated tissues (n = 4) and (B) hepatocytes (n = 3) (Duo, Duodenum; Jej, Jejunum; Ile, Ileum; SM, skeletal muscle; BAT, brown adipose tissue; WAT, white adipose tissue). Expression profiles were determined using the 2−ΔΔCT method and Lipa mRNA expression in control mice was arbitrarily set to 1. LAL activity in (C) livers (n = 4–6), (D) non-parenchymal cells (NPCs) (n = 3), and hepatocytes was determined using a fluorogenic substrate at pH 4 (n = 5). (E) Immunoblotting against LAL using calnexin as loading control. (F) TG hydrolase activity (pH 4) and (G) CE hydrolase activity (pH 4) in hepatocytes (n = 3). Data represent mean + SD; p < 0.05 (*), p ≤ 0.01 (**), p ≤ 0.001 (***). (A–F) Student's unpaired t-test.
Fig. 2
Fig. 2
Increased hepatic cholesterol concentrations in chow diet-fed Liv-Lipa−/− mice. (A) Body weight, (B) total liver weight, and (C) liver weight relative to body weight of 20 week old female chow diet-fed control and Liv-Lipa−/− mice. (D) Hepatic lipid parameters. (E) HE staining (upper panel) and Oil red O (ORO) staining (lower panel) of liver sections (scale bar, 100 μm). Data represent mean (n = 5–7) ± SD; p < 0.05 (*), p ≤ 0.01 (**). (A–D) Student's unpaired t-test.
Fig. 3
Fig. 3
Liv-Lipa−/− mice are resistant to diet-induced obesity. (A) Representative image of a male control and a Liv-Lipa−/− mouse fed HF/HCD for 10 weeks. (B) Body weight curves and (C) perigonadal WAT weights of female control and Liv-Lipa−/− mice after 20 weeks on HF/HCD. (D) H&E staining of WAT and brown adipose tissue sections of male HF/HCD-fed Liv-Lipa−/− and control mice (scale bar, 100 μm). (E) Plasma triglyceride (TG) and total cholesterol (TC) concentrations in 12 h-fasted female mice. (F) Lipoprotein profile of pooled plasma samples after fast protein liquid chromatography separation in female mice (n = 8). Data represent mean ± SD; p ≤ 0.001 (***). (B) ANOVA. (C, E) Student's unpaired t-test.
Fig. 4
Fig. 4
Improved glucose clearance in HD/HCD-fed Liv-Lipa−/− mice. GTT and ITT were performed in female control and Liv-Lipa−/− mice fed HFHCD for 10 and 12 weeks, respectively. Plasma glucose concentrations after i.p. injection of (A) glucose (2 g/kg) and (B) insulin (0.25 U/kg), respectively (n = 8). Hepatic mRNA expression of genes involved in (C) gluconeogenesis and (D) tricarboxylic acid cycle genes relative to cyclophilin A as reference gene in female mice fed a HF/HCD for 20 weeks (n = 3–7). (E) Plasma β-hydroxybuyrate concentrations in male mice fed HF/HCD for 10 weeks (n = 5–7). Data represent mean ± SD; p < 0.05 (*), p ≤ 0.01 (**), p ≤ 0.001 (***). (A, B) ANOVA. (C–E) Student's unpaired t-test.
Fig. 5
Fig. 5
Increased liver size and CE crystal formation in HF/HCD-fed Liv-Lipa−/− mice. (A) Representative images of livers and (B) representative HE staining of liver sections (scale bar, 100 μm) from male control and Liv-Lipa−/− mice fed HF/HCD for 10 weeks. (C) Total liver weight (n = 8) and (D) representative electron micrographs of livers (scale bar 0,5 μm) from mice fed HF/HCD for 10 weeks; LD indicates cytosolic lipid droplets, arrows indicate lipid-laden lysosomes, arrow heads indicate CE crystals. (E) LD distribution and (F) % of LD area calculated from 60 electron micrographs (each 142.09 μm2) per genotype. Data represent mean ± SD; p ≤ 0.001 (***). (B) Student's unpaired t-test.
Fig. 6
Fig. 6
Accumulation of various FA species in hepatic CE fraction of HF/HCD-fed Liv-Lipa−/− mice. Female control and Liv-Lipa−/− mice were fed HF/HCD for 10 weeks. (A) GC analysis of hepatic lipid species after TLC separation. (B–F) GC analysis of FA composition for each major lipid class (FA-, PL-, DG-, TG-, and CE-corresponding bands after TLC separation). Data represent mean + SD; p < 0.05 (*), p ≤ 0.01 (**), p ≤ 0.001 (***) (n = 5–6). (A–F) Student's unpaired t-test.
Fig. 7
Fig. 7
HF/HCD drives upregulation of cytokines, chemokines, and liver injury markers in Liv-Lipa−/− livers. (A) Liver sections of 20 week HF/HCD-fed male control and Liv-Lipa−/− mice stained with chromotrope aniline blue (CAB) as fibrosis marker (scale bar, 50 μm) and F4/80 as macrophage marker (scale bar, 100 μm). (B, D) Hepatic mRNA expression levels of liver injury markers, chemokines, and cytokines relative to cyclophilin A as reference gene in female mice fed HF/HCD for 20 weeks (n = 5–7). (C) Plasma concentrations of aspartate-aminotransferase (AST) and alanine aminotransferase (ALT) in female mice fed HF/HCD for 10 weeks (n = 3–4). Data represent mean values + SD; *p < 0.05, **p ≤ 0.01, ***p ≤ 0.001.

References

    1. Rui L. Energy metabolism in the liver. Compr Physiol. 2014;4:177–197. doi: 10.1002/cphy.c130024. - DOI - PMC - PubMed
    1. Bernstein DL, Hulkova H, Bialer MG, Desnick RJ. Cholesteryl ester storage disease: review of the findings in 135 reported patients with an underdiagnosed disease. J Hepatol. 2013;58:1230–1243. doi: 10.1016/j.jhep.2013.02.014. - DOI - PubMed
    1. Grumet L, Eichmann TO, Taschler U, Zierler KA, Leopold C, Moustafa T, et al. Lysosomal acid lipase hydrolyzes retinyl ester and affects retinoid turnover. J Biol Chem. 2016;291:17977–17987. doi: 10.1074/jbc.M116.724054. - DOI - PMC - PubMed
    1. Radovic B, Vujic N, Leopold C, Schlager S, Goeritzer M, Patankar JV, et al. Lysosomal acid lipase regulates VLDL synthesis and insulin sensitivity in mice. Diabetologia. 2016;59:1743–1752. doi: 10.1007/s00125-016-3968-6. - DOI - PMC - PubMed
    1. Sheriff S, Du H, Grabowski GA. Characterization of lysosomal acid lipase by site-directed mutagenesis and heterologous expression. J Biol Chem. 1995;270:27766–27772. - PubMed

Publication types

Substances