

Illusory face detection in pure noise images: The role of interindividual variability in fMRI activation patterns
- PMID: 30640899
- PMCID: PMC6331101
- DOI: 10.1371/journal.pone.0209310
Illusory face detection in pure noise images: The role of interindividual variability in fMRI activation patterns
Abstract
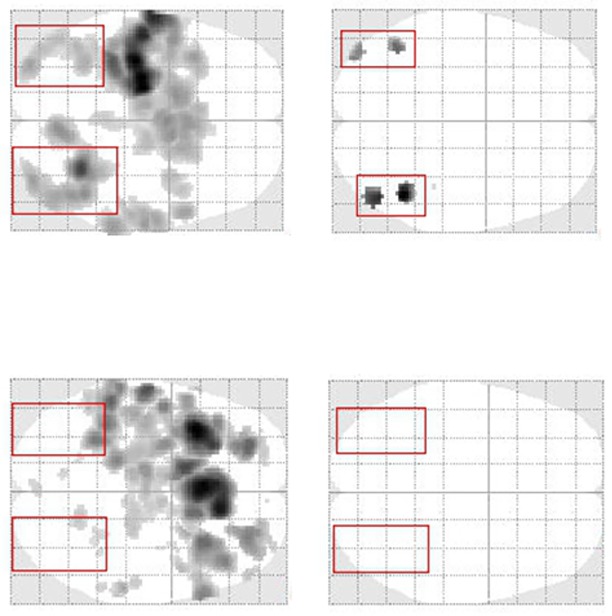
Illusory face detection tasks can be used to study the neural correlates of top-down influences on face perception. In a typical functional magnetic resonance imaging (fMRI) study design, subjects are presented with pure noise images, but are told that half of the stimuli contain a face. The illusory face perception network is assessed by comparing blood oxygenation level dependent (BOLD) responses to images in which a face has been detected against BOLD activity related to images in which no face has been detected. In the present study, we highlight the existence of strong interindividual differences of BOLD activation patterns associated with illusory face perception. In the core system of face perception, 4 of 9 subjects had highly significant (p<0.05, corrected for multiple comparisons) activity in the bilateral occipital face area (OFA) and fusiform face area (FFA). In contrast, 5 of 9 subjects did not show any activity in these regions, even at statistical thresholds as liberal as p = 0.05, uncorrected. At the group level, this variability is reflected by non-significant activity in all regions of the core system. We argue that these differences might be related to individual differences in task execution: only some participants really detected faces in the noise images, while the other subjects simply responded in the desired way. This has several implications for future studies on illusory face detection. First, future studies should not only analyze results at the group level, but also for single subjects. Second, subjects should be explicitly queried after the fMRI experiment about whether they really detected faces or not. Third, if possible, not only the overt response of the subject, but also additional parameters that might indicate the perception of a noise stimulus as face should be collected (e.g., behavioral classification images).
Conflict of interest statement
The authors have declared that no competing interests exist.
Figures


References
-
- Haxby J, Hoffman E, Gobbini M. The distributed human neural system for face perception. Trends Cogn Sci. 2000;4: 223–233. Available: http://www.ncbi.nlm.nih.gov/pubmed/10827445 - PubMed
Publication types
MeSH terms
Substances
LinkOut - more resources
Full Text Sources
