. 2019 Jan 14;17(1):e2005258.
doi: 10.1371/journal.pbio.2005258. eCollection 2019 Jan.

The brown algal mode of tip growth: Keeping stress under control

Affiliations

The brown algal mode of tip growth: Keeping stress under control

Hervé Rabillé et al. PLoS Biol. .

Abstract

Tip growth has been studied in pollen tubes, root hairs, and fungal and oomycete hyphae and is the most widely distributed unidirectional growth process on the planet. It ensures spatial colonization, nutrient predation, fertilization, and symbiosis with growth speeds of up to 800 μm h-1. Although turgor-driven growth is intuitively conceivable, a closer examination of the physical processes at work in tip growth raises a paradox: growth occurs where biophysical forces are low, because of the increase in curvature in the tip. All tip-growing cells studied so far rely on the modulation of cell wall extensibility via the polarized excretion of cell wall-loosening compounds at the tip. Here, we used a series of quantitative measurements at the cellular level and a biophysical simulation approach to show that the brown alga Ectocarpus has an original tip-growth mechanism. In this alga, the establishment of a steep gradient in cell wall thickness can compensate for the variation in tip curvature, thereby modulating wall stress within the tip cell. Bootstrap analyses support the robustness of the process, and experiments with fluorescence recovery after photobleaching (FRAP) confirmed the active vesicle trafficking in the shanks of the apical cell, as inferred from the model. In response to auxin, biophysical measurements change in agreement with the model. Although we cannot strictly exclude the involvement of a gradient in mechanical properties in Ectocarpus morphogenesis, the viscoplastic model of cell wall mechanics strongly suggests that brown algae have evolved an alternative strategy of tip growth. This strategy is largely based on the control of cell wall thickness rather than fluctuations in cell wall mechanical properties.


Conflict of interest statement

The authors have declared that no competing interests exist.

Figures

Fig 1
Fig 1. Diversity of tip growth in the eukaryotic tree of life.
Phylogenetic position of eukaryotic taxa with tip-growing organisms. Cell shapes and growth rates are shown. (A–D) Archaeplastida group. (A) Moss protonema; (B) root hair; (C) pollen tube; (D) green algal filament. (E–H) Stramenopiles, which include the coenocytic oomycetes and the multicellular brown algae, e.g., the filamentous alga Ectocarpus. (E) Ectocarpus apical cell of a prostrate sporophyte filament; (F) Ectocarpus tuft with several branches; (G) Ectocarpus filament viewed with an SEM; (H) oomycete hyphae. (I, J) Tip growth in the Opisthokonta group. (I) Neurons of metazoans; (J) fungal hyphae. (K) Two main cellular regions defining tip-growing cells. Top frames are the two taxa compared in this study (pollen tube and brown algal filament). Bar = 5 μm (A–C, E, H–J), 10 μm (G), 20 μm (D, F). Photo credits: (A) A. Le Bail, Erlangen University, Germany; (B) Florian Frugier, IPS2 Gif/Yvette, France, (C) B. Kost, Erlangen University, Germany; (D) M. Braun, Erlangen University; (G) A. Le Bail, Station Biologique Roscoff CNRS-UPMC, France, (H) reproduced with permission from Cell Research [8]; (I) reproduced with permission from Disease Models Mechanisms (CC-BY license) [9]; (J) reproduced with permission from Journal of Cell Science [10]. SEM, scanning electronic microscope.
Fig 2
Fig 2. Position and direction of cell wall expansion during growth.
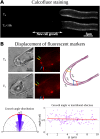
(A) Pulse-chase experiment using calcofluor-white stain during growth. Filaments were washed to remove the calcofluor-white immediately after staining and observed again after 16 h. The dark area thus corresponds to recently deposited cell materials. (B) Orthogonal growth in the apical cell. (Top) Cell wall deformation at the apex of an apical cell during growth, as visualized by the displacement of fluorescent microspheres 24 h after applying them to the cell surface. (Left) Bright-field pictures; (right) corresponding confocal pictures showing the microspheres as red fluorescent dots. Note the progressive displacement of four microspheres from the dome toward the shank of the cell as the cell grows. Bar = 5 μm. (Bottom) Distribution of angles between the cell surface and the growth direction (sectors); (left) red line and tick marks denote the mean and standard deviation. (Right) Angle values plotted as a function of the meridional abscissa |s|, showing that the angle is stable regardless of position in the dome (red line: linear regression). Data are available as Supporting Information S1 Data. S1 Fig illustrates a representative sample of the data.
Fig 3
Fig 3. Biophysical model of tip growth.
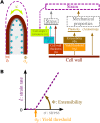
(A) Diagram showing the relationship between the different factors involved in cell wall growth. Wall stress depends on cell turgor (P), cell curvature (κ), and cell wall thickness (δ). In the viscoplastic model [33], the strain rate (purple dashed lines) at each point of the cell surface is a function of wall stress and the mechanical properties of the cell wall (i.e., isotropy and propensity to yield represented by extensibility Ф and the yield threshold σy). Strain results in a new cell shape (dashed arrow). (B) Strain rate as a function of stress, according to the Lockhart law for growth of viscoplastic cell walls.
Fig 4
Fig 4. Turgor and curvature of the apical cells.
(A) Turgor value in apical cells measured using the limit plasmolysis method [34]. Different osmolarities (Ce) were applied to Ectocarpus filaments, and plasmolysis was monitored in apical cells (n > 100 for each osmolarity). Limit plasmolysis concentration (Cpl), which is the solute concentration for which 50% of apical cells are plasmolyzed, was 1,980 mOsm L−1 (each color represents an independent experiment [n = 3]). Corrections, as explained in the Materials and methods section, led to a final turgor value of 0.495 MPa. Data are available as Supporting Information S3 Data. (B) Apical cell curvature. (Left) Ectocarpus apical cell contour was drawn manually on microscope images. (Middle) From the contour of each cell, a smoothed cubic spline was computed. (Right) The meridional curvature of each cell was calculated from the discretized contour. All curvature series (for n = 17 Ectocarpus apical cells, S2 Fig) were averaged (blue curve, SD shown as light blue curves), and the mean curvature was used to create a mean contour. Circumferential curvature (green curve) was then inferred from the mean contour. Gray lines are for curvature = 0. The same procedure was used for 6 tobacco pollen-tube cells.
Fig 5
Fig 5. Cell wall thickness of the apical cell.
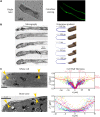
(A) Confocal images of Ectocarpus apical cells stained with calcofluor-white. The most apical part of the cell is barely visible because the cell wall is thin. (B) Serial sections (300 nm thick) of an apical cell compared with theoretical sections with the cell wall gradient observed in (C). Theoretical sections were rendered using Persistence Of Vision ray-tracing software [37]. In the meridional position, the cell wall is barely visible at the tip, whereas it is clearly visible in the shanks. In nonmeridional sections, the cell wall is visible both at the tip and in the shanks. (C) Left: Ultrathin (70 nm) longitudinal sections of apical cells observed by TEM, showing the cell wall thickness gradient from the tip to the base of the cell, from a large field view (top) and from a close-up focused on the dome region (bottom). (Right) Plotted distribution of the corrected cell wall thickness values measured every 386 nm in average as a function of the meridional distance (s) from the tip (s = 0) to s = ±70 μm on both sides. Each color corresponds to one cell (n = 15 cells); each dot corresponds to one value measured on one given cell. The curve shows the theoretical gradient adjusted to the data, according to a law adapted from Pearson’s function. Adjusted cell wall width at s = 0 is δ = 36.2 nm, and the plateau on the shanks is δ = 591 nm. The distribution in the dome area is shown (bottom). See the whole set of photos in S3 Fig and the whole set of measurements in S4 Data. TEM, transmission electron microscopy.
Fig 6
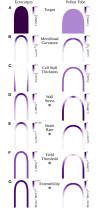
Fig 6. Diagrams summarizing the biophysical properties of two tip-growing cells: Ectocarpus filament apical cell and the tobacco pollen tube.
2D profiles are shown. (A) Turgor. (B) Meridional curvature. (C) Cell wall thickness. (D) Wall stress. (E) Strain rate pattern. (F) Cell wall plastic yield threshold. (G) Cell wall plastic extensibility. Note that the color scale differs between Ectocarpus and pollen tube in (D–G), indicated with an asterisk (*).
Fig 7
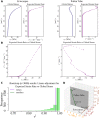
Fig 7. Contribution of the cell wall biophysical factors in Ectocarpus and pollen-tube tip growth.
(A) For each cell type, the global stress σe was computed using measured values of turgor, curvature, and cell wall thickness (equation S2 in S1 Text). Knowing normal velocity Vn at each point, the expected strain rate ε˙* was computed according to equation S10 in S1 Text. Note the different scales between Ectocarpus and the pollen tube. (B) Relationship between stress and expected strain rate in Ectocarpus apical cells (left) and in the tobacco pollen tube (right): instead of plotting each value against s, these values were plotted against each other to show how the stress results in strain. In Ectocarpus, but not in the pollen tube, ε˙* behaves according to the Lockhart equation ε˙=Φ(σe-σy)ifσe>σy;ε˙=0 otherwise, with constant values for Φ and σy (compare with Fig 3B). (C) Robustness of this result was tested using a bootstrap analysis with 3,000 replicates. For each sample, the linearity of the part of the curve (where σe > σy) was estimated by linear regression. The distribution of the values of r2 shows that linearity is well supported (see also S4 Fig). Data are available as S4 Data. (D) Relationship between the three biophysical features of the cell wall: plastic yield threshold (σy, x-axis), thickness (δ, y-axis), and plastic extensibility (Φ, z-axis). In Ectocarpus, only variation of δ accounts for tip growth (brown line), whereas in pollen tubes, both σy and Φ vary while the wall thickness remains constant (green line).
Fig 8
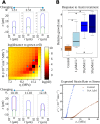
Fig 8. Impact of yield threshold (σy) and extensibility (Φ) variations on Ectocarpus tip growth.
(A) Simulation of tip growth in Ectocarpus with varying extensibility (Φ) and yield threshold (σy). (Middle) Heatmap representing the logarithm of mean weighted distance residuals (rD) for a range of σy (horizontal axis) and Ф (vertical axis) (one complete simulation for each pair of σy and Ф values). The darker the color, the lower the rD and the better the simulation. rD was calculated as the linear distance of points sharing the same meridional (s) distance between the simulated final cell contour and the initial one translated forwardly of 25 μm. Optimized values were 2.51 MPa−1 for the cell wall extensibility (Ф) and 11.18 MPa for the yield threshold (σy). See also S1 Movie showing the time course of the 2D simulation. (Bottom) Impact of variation of cell wall yield threshold σy on tip-growth simulation. The diagram shows the 2D profile of apical cells before the simulation (initial stage, green contour) and at the end of the simulation (blue contour). The purple contour represents the translated initial shape to help comparison with the initial contour. σy values were 10.18, 11.18, and 12.18 MPa (diamonds on the heatmap). Simulations were run for 5 h 27 min, corresponding to a growth of 25 μm forward for the fastest simulation. See S2 Movie for time course of the 2D simulation with varying σy. (Top) Impact of the cell wall extensibility Ф on tip-growth simulation (same color code as in the bottom figure). Ф values were 1.51, 2.51, and 3.51 × 10⁻³ min−1 MPa−1 (circles on the heatmap). Simulations ran until the first simulation reached 25 μm in distance. See S3 Movie for time course of the 2D simulation with varying Ф. (B) Response to auxin treatment. (Top) The linear growth rate (ΔL/Δt) was measured 24 h after adding 1, 10, or 50 μM of IAA. Relative growth rate was calculated as the ratio to the mean growth rate in the control condition (2 μM NaOH, see Materials and methods for details). * denotes pairs of conditions for which a pairwise Mann-Whitney tests showed significant differences (p-value < 0.05 after Holm correction for multiple tests). (Bottom) Expected strain rate versus stress for control conditions and in the presence of 1 μ Mol L−1 IAA. The curve shows that both σy and Ф are affected by the presence of IAA: σy decreases while Ф increases, both modifications corresponding to a cell wall–loosening effect. Data are available as S6 Data. IAA, indole-3-acetic acid.
Fig 9
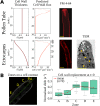
Fig 9. Impact of the cell wall thickness gradient and pattern of cell wall biosynthesis.
(A) Dynamics of cell wall synthesis in the pollen tube (top) and Ectocarpus apical cell (bottom). From left to right: cell wall thickness δ from which the computed cell wall flux was inferred using the model. Note the different x-scales between Ectocarpus and the pollen tube. Vesicle pattern displayed by FM4-64 labeling. Confocal image about 30 min after addition of FM4-64 at RT in living Ectocarpus and in the pollen tube (Courtesy of G. Grebnev and B. Kost, Erlangen Univ., Germany). Bar = 5 μm. Longitudinal sections observed using TEM. No specific network of vesicles was observed in the dome of the Ectocarpus apical cell (see [55] for a comparative image of the pollen tube). Instead, chloroplasts and associated reticulum (see [14] for the description of the overall intracellular organization) are present all along the cell axis. White stars: chloroplasts; orange arrow heads: CER; P: pyrenoids. Bar = 5 μm. (B) FRAP experiment. (Left) Definition of the zones A–E from which fluorescence recovery was measured (also shown in panel A). (Right) Quantification of cell wall replacement expressed as the increase in normalized fluorescence intensity at t = 0 (time of photobleaching). See S7 Fig for details about the FRAP analysis. Data are available as S8 Data. CER, chloroplastic endoplasmic reticulum; FRAP, fluorescence recovery after photobleaching; RT, room temperature; TEM, transmission electron microscopy.

Similar articles

Cited by

References

    1. Davidson LA. Mechanical design in embryos: mechanical signalling, robustness and developmental defects. Philos Trans R Soc B Biol Sci. 2017;372 10.1098/rstb.2015.0516 - DOI - PMC - PubMed
    1. Mirabet V, Das P, Boudaoud A, Hamant O. The role of mechanical forces in plant morphogenesis. Annu Rev Plant Biol. 2011;62: 365–385. 10.1146/annurev-arplant-042110-103852 - DOI - PubMed
    1. Heath IB. Tip growth in plant and fungal cells Harcourt Brace Jovanovich. San Diego: Academic Press; 1990.
    1. Campàs O, Rojas E, Dumais J, Mahadevan L. Strategies for cell shape control in tip-growing cells. Am J Bot. 2012;99: 1577–1582. 10.3732/ajb.1200087 - DOI - PubMed
    1. Benkert R, Obermeyer G, Bentrup F-W. The turgor pressure of growing lily pollen tubes. Protoplasma. 1997;198: 1–8. 10.1007/BF01282125 - DOI

Publication types

MeSH terms

Substances