. 2019 Jan 14;15(1):e1007908.
doi: 10.1371/journal.pgen.1007908. eCollection 2019 Jan.

Estimating recent migration and population-size surfaces

Affiliations

Estimating recent migration and population-size surfaces

Hussein Al-Asadi et al. PLoS Genet. .

Abstract

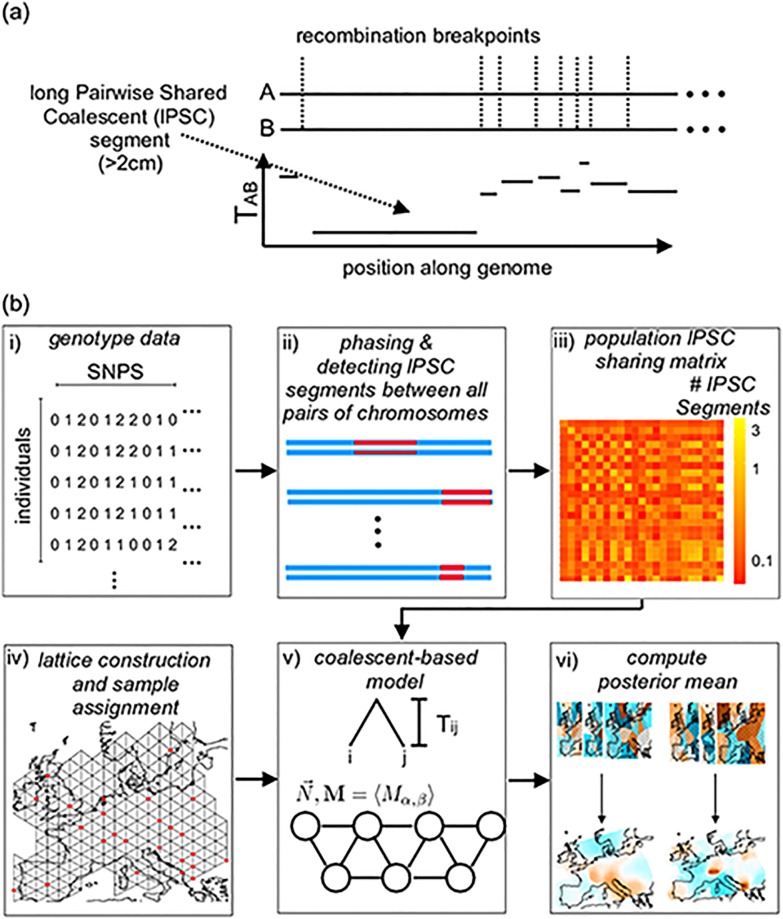
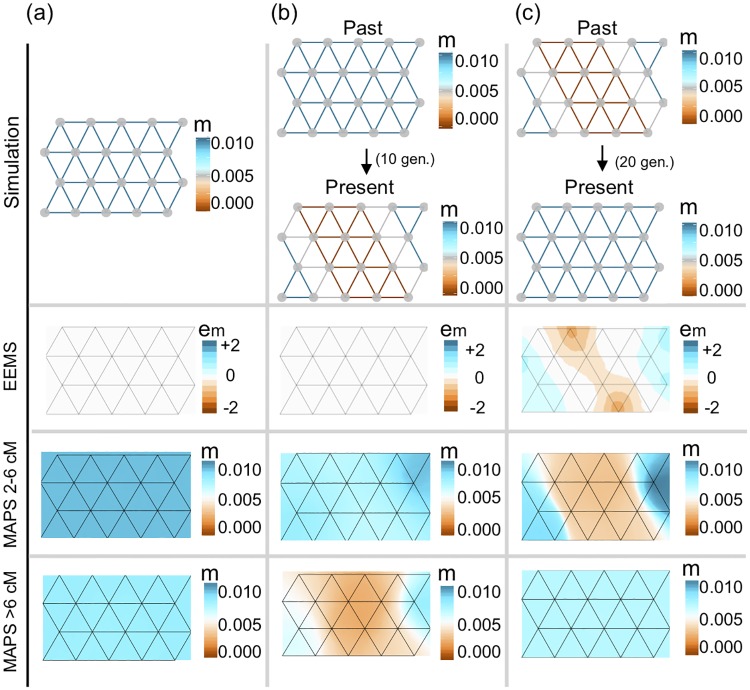
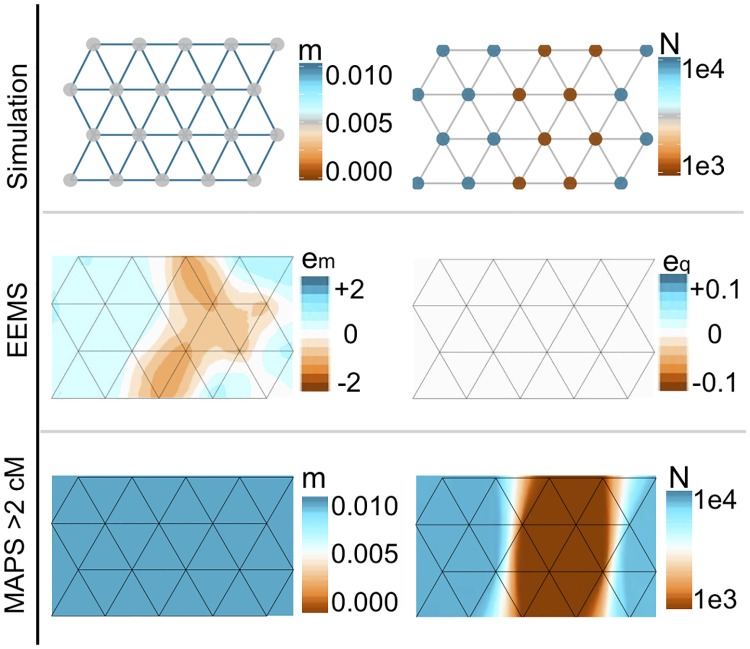
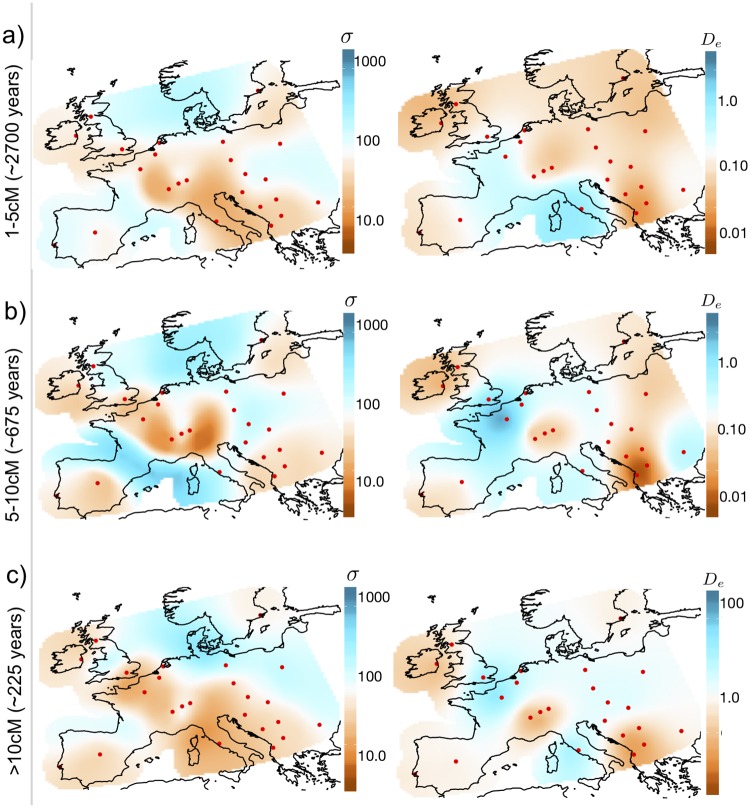
In many species a fundamental feature of genetic diversity is that genetic similarity decays with geographic distance; however, this relationship is often complex, and may vary across space and time. Methods to uncover and visualize such relationships have widespread use for analyses in molecular ecology, conservation genetics, evolutionary genetics, and human genetics. While several frameworks exist, a promising approach is to infer maps of how migration rates vary across geographic space. Such maps could, in principle, be estimated across time to reveal the full complexity of population histories. Here, we take a step in this direction: we present a method to infer maps of population sizes and migration rates associated with different time periods from a matrix of genetic similarity between every pair of individuals. Specifically, genetic similarity is measured by counting the number of long segments of haplotype sharing (also known as identity-by-descent tracts). By varying the length of these segments we obtain parameter estimates associated with different time periods. Using simulations, we show that the method can reveal time-varying migration rates and population sizes, including changes that are not detectable when using a similar method that ignores haplotypic structure. We apply the method to a dataset of contemporary European individuals (POPRES), and provide an integrated analysis of recent population structure and growth over the last ∼3,000 years in Europe.


Conflict of interest statement

The authors have declared that no competing interests exist.

Figures

Fig 1
Fig 1. Schematic overview of MAPS.
(a) Coalescent times between a pair of hapolotypes (A and B) will vary across the genome in discrete segments bordered by recombination breakpoints. On average, longer segments represent shorter pairwise coalescent times (TAB) (b) Flow diagram of MAPS. i) We start with a matrix of called genotypes; ii) lPSC segments between all pairs of chromosomes across the genome are identified from the data using external methods (such as BEAGLE, [27]); iii) lPSC segments between pairs of individuals are aggregated at the levels of pairs of populations; iv) A grid is constructed and individuals are assigned to the most nearby node; v) The probability of the PSC sharing matrix can be computed under a stepping-stone model where each node represents a population and each edge represents symmetric migration; vi) We use an MCMC scheme to sample from the posterior distribution of migration rates and population sizes. The final MAPS output is the mean over these posterior samples, and the averaged rates can be transformed to units of dispersal rate and population density. The diagram does not show a bootstrapping step used to estimate likelihood weights to account for correlations between lPSC segments, see Eq (6) in Methods.
Fig 2
Fig 2. Simulations comparing migration rates inferred with MAPS against effective migration rates inferred with EEMS.
(a) We simulated data under uniform migration rates equal to 0.01 and applied EEMS and MAPS using PSC segments in the range 2-6cM and ≥6cM. Like EEMS, MAPS correctly infers a uniform migration surface. Additionally, MAPS provides accurate estimates of the migration rates for both PSC segments 2-6cM (mean 0.01) and PSC segments ≥6cM (mean 0.0086). (b) We simulated a recent sudden migration barrier formed 10 generations ago. Here, EEMS is unable to infer a barrier, while MAPS correctly infers the historical uniform surface (2-6cM) and a barrier in the more recent time scale (≥6cM). (c) We simulated a long-standing migration barrier that recently dissipated 20 generations ago. EEMS infers a barrier, while MAPS correctly infers both the historical migration barrier (2-6cM) and the uniform migration surface in the more recent time scale (≥6cM). In all cases shown here, we simulated a 20 deme stepping stone model such that the population sizes all equal to 10,000, and 10 diploid individuals were sampled at each deme.
Fig 3
Fig 3. Simulations comparing population sizes inferred with MAPS and “diversity-rates” inferred with EEMS.
We simulated uniform migration rates of 0.01 and a trough of low population sizes in the center of the habitat such that population sizes equal to 1,000 at the center and 10,000 otherwise. Under these simulations, EEMS infers a barrier in effective migration and infers uniform diversity rates. However, MAPS correctly infers a uniform migration surface (mean 0.01) and provides accurate estimates of deme sizes (mean 985 at the center and 9100 at the edges).
Fig 4
Fig 4. Inferred dispersal surfaces and population density surfaces over time for Europe.
We apply MAPS to a European subset of POPRES [25] with 2,234 individuals and plot the inferred dispersal σ(x) and population density De(x) surfaces for PSC length bins (a) >1cM (b) 5-10cM and (c) >10cM. We transform estimates of N and M to estimates of σ(x) and De(x) by scaling the migration rates and population sizes by the grid step-size and area (see Eqs (17) and (18)). Generally, we observe the patterns of dispersal to be relatively constant over time periods, however, we see a sharp increase in population density in the most recent time scale (>10cM). Note the wider plotting limits in inferred densities in the most recent time scale.
Fig 5
Fig 5. The correlation between census size and inverse average PSC sharing as a function of minimum PSC length considered.
We computed the correlation coefficient (Spearman’s) between census size and one over the average PSC sharing. We use census size compiled from the [36] and [37]. The smooth black curve denotes the loess fit. Longer PSC segments correlate more strongly with census size than shorter PSC segments.

Similar articles

Cited by

References

    1. Wright S. Isolation by Distance. Genetics. 1943;28(2):114 - PMC - PubMed
    1. Manel S, Schwartz MK, Luikart G, Taberlet P. Landscape Genetics: Combining Landscape Ecology and Population Genetics. Trends in Ecology & Evolution. 2003;18(4):189–197. 10.1016/S0169-5347(03)00008-9 - DOI
    1. Turner MG, Gardner RH, O’neill RV, et al. Landscape Ecology in Theory and Practice. Springer-Verlag; New York; 2001.
    1. Segelbacher G, Cushman SA, Epperson BK, Fortin MJ, Francois O, Hardy OJ, et al. Applications of Landscape Genetics in Conservation Biology: Concepts and Challenges. Conservation Genetics. 2010;11(2):375–385. 10.1007/s10592-009-0044-5 - DOI
    1. Rousset F. Genetic Structure and Selection in Subdivided Populations (MPB-40). Princeton University Press; New Jersey; 2004.

Publication types