. 2019 Apr;24(4):466-475.
doi: 10.1177/2472555218818756. Epub 2019 Jan 14.

Transfer Learning with Deep Convolutional Neural Networks for Classifying Cellular Morphological Changes

Affiliations

Transfer Learning with Deep Convolutional Neural Networks for Classifying Cellular Morphological Changes

Alexander Kensert et al. SLAS Discov. 2019 Apr.

Abstract

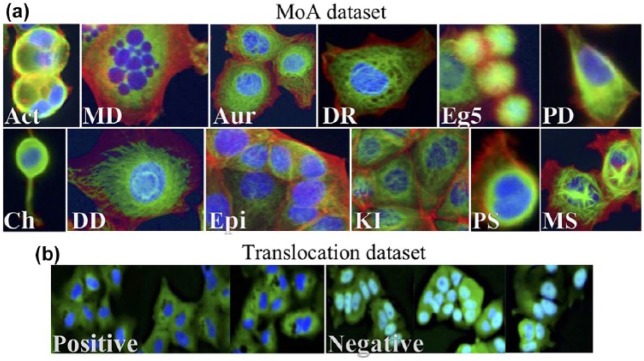
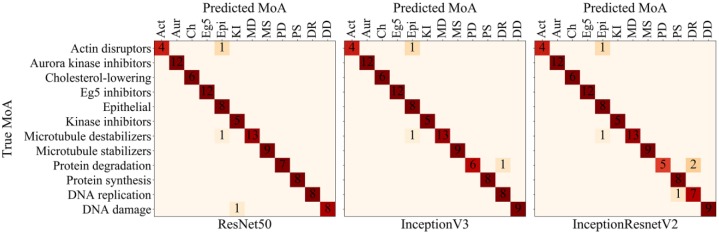
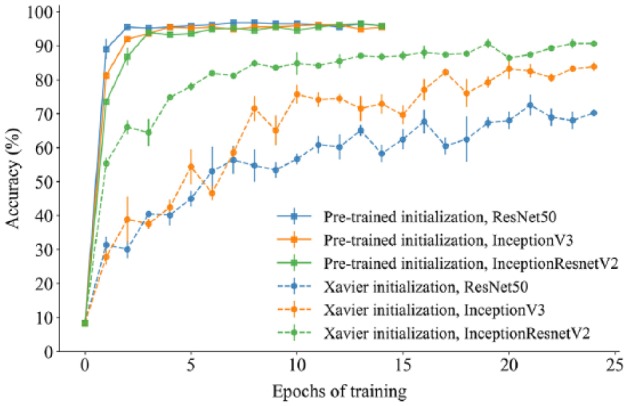
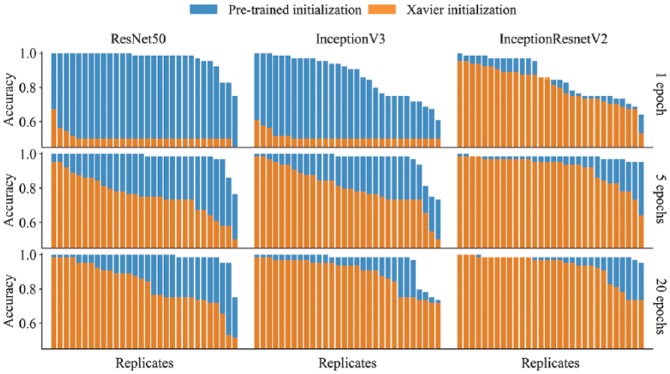
The quantification and identification of cellular phenotypes from high-content microscopy images has proven to be very useful for understanding biological activity in response to different drug treatments. The traditional approach has been to use classical image analysis to quantify changes in cell morphology, which requires several nontrivial and independent analysis steps. Recently, convolutional neural networks have emerged as a compelling alternative, offering good predictive performance and the possibility to replace traditional workflows with a single network architecture. In this study, we applied the pretrained deep convolutional neural networks ResNet50, InceptionV3, and InceptionResnetV2 to predict cell mechanisms of action in response to chemical perturbations for two cell profiling datasets from the Broad Bioimage Benchmark Collection. These networks were pretrained on ImageNet, enabling much quicker model training. We obtain higher predictive accuracy than previously reported, between 95% and 97%. The ability to quickly and accurately distinguish between different cell morphologies from a scarce amount of labeled data illustrates the combined benefit of transfer learning and deep convolutional neural networks for interrogating cell-based images.

Keywords: cell phenotypes; deep learning; high-content imaging; machine learning; transfer learning.


Conflict of interest statement

Declaration of Conflicting Interests: The authors declared no potential conflicts of interest with respect to the research, authorship, and/or publication of this article.

Figures

Figure 1.
Figure 1.
(a) The different MoAs in the MoA dataset. Images were cropped and processed from the original training images. Act = actin disruption; MD = microtubule destabilization; Aur = aurora kinase inhibition; DR = DNA replication; Eg5 = Eg5 inhibition; PD = protein degradation; Ch = cholesterol lowering; DD = DNA damage; Epi = epithelial; KI = kinase inhibition; PS = protein synthesis; MS = microtubule stabilization. (b) The two different classes (positive and negative) in the translocation dataset. Positive means translocation; negative means no translocation. Images were cropped and processed from the original training images.
Figure 2.
Figure 2.
Confusion matrices for hard predictions of compound–concentration pairs of the MoA dataset, with a mean accuracy of 97%, 97%, and 95% for ResNet50, InceptionV3, and InceptionResnetV2, respectively. Zeros are excluded for better visualization.
Figure 3.
Figure 3.
A comparison of test set accuracy between pretrained applications and Xavier initialized applications of the same architectures and the same hyperparameter settings for the MoA dataset. The plot illustrates how pretrained applications greatly improve learning, where the pretrained ResNet50 application attained near 90% accuracy after just a single epoch of training.
Figure 4.
Figure 4.
A comparison of test set accuracy between pretrained applications and Xavier initialized applications of the same architectures and the same hyperparameter settings for the translocation dataset. Each bar plot (nine in total) represents 30 replicate models, all trained with identical hyperparameter values.
Figure 5.
Figure 5.
A comparison between the pretrained model and the fine-tuned model showing a subset of images that maximize certain filter output activations in the different layers of ResNet50 (attained using the keras-vis toolkit). The fine-tuned model was trained on the MoA dataset for 10 epochs.

References

    1. Carpenter A. E., Jones T. R., Lamprecht M., et al. Cellprofiler: Image Analysis Software for Identifying and Quantifying Cell Phenotypes. Genome Biol. 2006, 7, R100. - PMC - PubMed
    1. Liberali P., Snijder B., Pelkmans L. Single-Cell and Multivariate Approaches in Genetic Perturbation Screens. Nat. Rev. Genet. 2015, 16, 18–32. - PubMed
    1. Sommer C., Gerlich D. W. Machine Learning in Cell Biology—Teaching Computers to Recognize Phenotypes. J. Cell Sci. 2013, 126, 5529–5539. - PubMed
    1. Caicedo J., Cooper S., Heigwer F., et al. Data-Analysis Strategies for Image-Based Cell Profiling. Nat. Methods 2017, 14, 849–863. - PMC - PubMed
    1. Singh S., Bray M., Jones T., et al. Pipeline for Illumination Correction of Images for High-Throughput Microscopy. J. Microsc. 2014, 256, 231–236. - PMC - PubMed

Publication types

LinkOut - more resources