

Direct Infusion Based Metabolomics Identifies Metabolic Disease in Patients' Dried Blood Spots and Plasma
- PMID: 30641898
- PMCID: PMC6359237
- DOI: 10.3390/metabo9010012
Direct Infusion Based Metabolomics Identifies Metabolic Disease in Patients' Dried Blood Spots and Plasma
Abstract
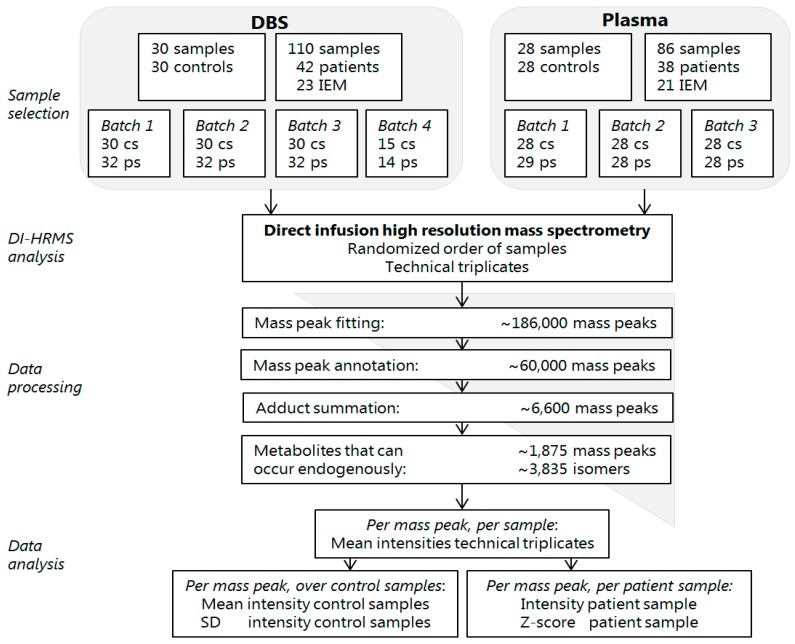
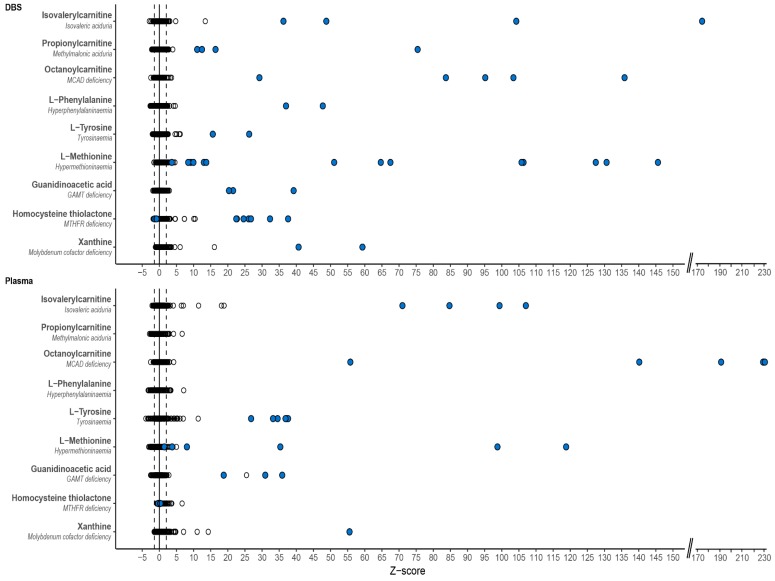
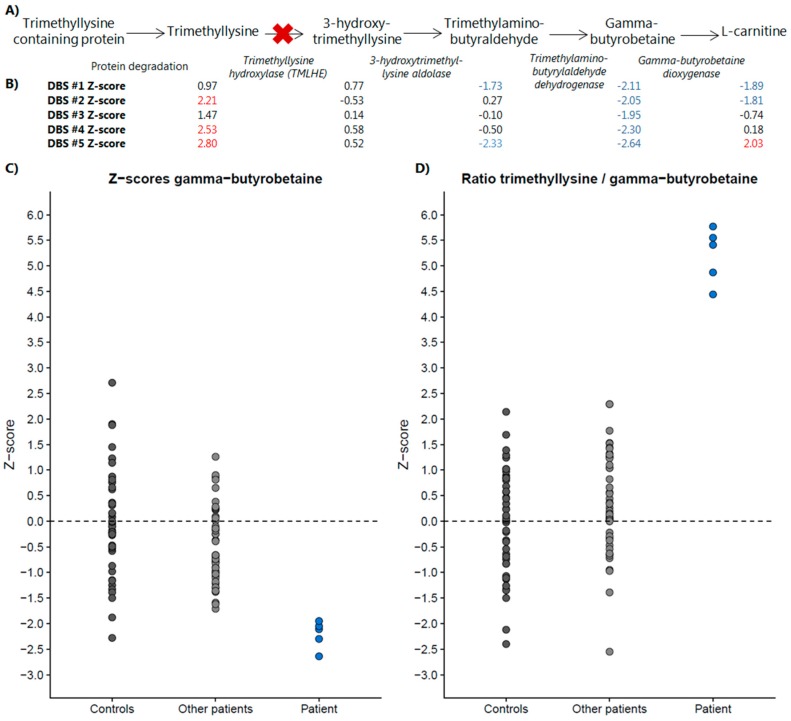
In metabolic diagnostics, there is an emerging need for a comprehensive test to acquire a complete view of metabolite status. Here, we describe a non-quantitative direct-infusion high-resolution mass spectrometry (DI-HRMS) based metabolomics method and evaluate the method for both dried blood spots (DBS) and plasma. 110 DBS of 42 patients harboring 23 different inborn errors of metabolism (IEM) and 86 plasma samples of 38 patients harboring 21 different IEM were analyzed using DI-HRMS. A peak calling pipeline developed in R programming language provided Z-scores for ~1875 mass peaks corresponding to ~3835 metabolite annotations (including isomers) per sample. Based on metabolite Z-scores, patients were assigned a 'most probable diagnosis' by an investigator blinded for the known diagnoses of the patients. Based on DBS sample analysis, 37/42 of the patients, corresponding to 22/23 IEM, could be correctly assigned a 'most probable diagnosis'. Plasma sample analysis, resulted in a correct 'most probable diagnosis' in 32/38 of the patients, corresponding to 19/21 IEM. The added clinical value of the method was illustrated by a case wherein DI-HRMS metabolomics aided interpretation of a variant of unknown significance (VUS) identified by whole-exome sequencing. In summary, non-quantitative DI-HRMS metabolomics in DBS and plasma is a very consistent, high-throughput and nonselective method for investigating the metabolome in genetic disease.
Keywords: DIMS; IEM; direct-infusion mass spectrometry; inborn errors of metabolism; metabolomics.
Conflict of interest statement
All authors state that they have no conflict of interest to declare. None of the authors accepted any reimbursements, fees, or funds from any organization that may in any way gain or lose financially from the results of this study. The authors have not been employed by such an organization. The authors have not act as an expert witness on the subject of the study. The authors do not have any other conflict of interest.
Figures
References
-
- Janeckova H., Hron K., Wojtowicz P., Hlídková E., Barešová A., Friedecký D., Zídková L., Hornik P., Behúlová D., Procházková D., et al. Targeted metabolomic analysis of plasma samples for the diagnosis of inherited metabolic disorders. J. Chromatogr. A. 2012;1226:13–17. doi: 10.1016/j.chroma.2011.09.074. - DOI - PubMed
-
- Pitt J.J., Eggington M., Kahler S.G. Comprehensive screening of urine samples for inborn errors of metabolism by electrospray tandem mass spectrometry. Clin. Chem. 2002;48:1970–1980. - PubMed
-
- Kurko J., Tringham M., Tanner L., Näntö-Salonen K., Vähä-Mäkilä M., Nygren H., Pöhö P., Lietzen N., Mattila I., Olkku A., et al. Imbalance of plasma amino acids, metabolites and lipids in patients with lysinuric protein intolerance. Metabolism. 2016;65:1361–1375. doi: 10.1016/j.metabol.2016.05.012. - DOI - PubMed
Grants and funding
LinkOut - more resources
Full Text Sources
