

Altered Adipose Tissue DNA Methylation Status in Metabolic Syndrome: Relationships Between Global DNA Methylation and Specific Methylation at Adipogenic, Lipid Metabolism and Inflammatory Candidate Genes and Metabolic Variables
- PMID: 30642114
- PMCID: PMC6352101
- DOI: 10.3390/jcm8010087
Altered Adipose Tissue DNA Methylation Status in Metabolic Syndrome: Relationships Between Global DNA Methylation and Specific Methylation at Adipogenic, Lipid Metabolism and Inflammatory Candidate Genes and Metabolic Variables
Abstract
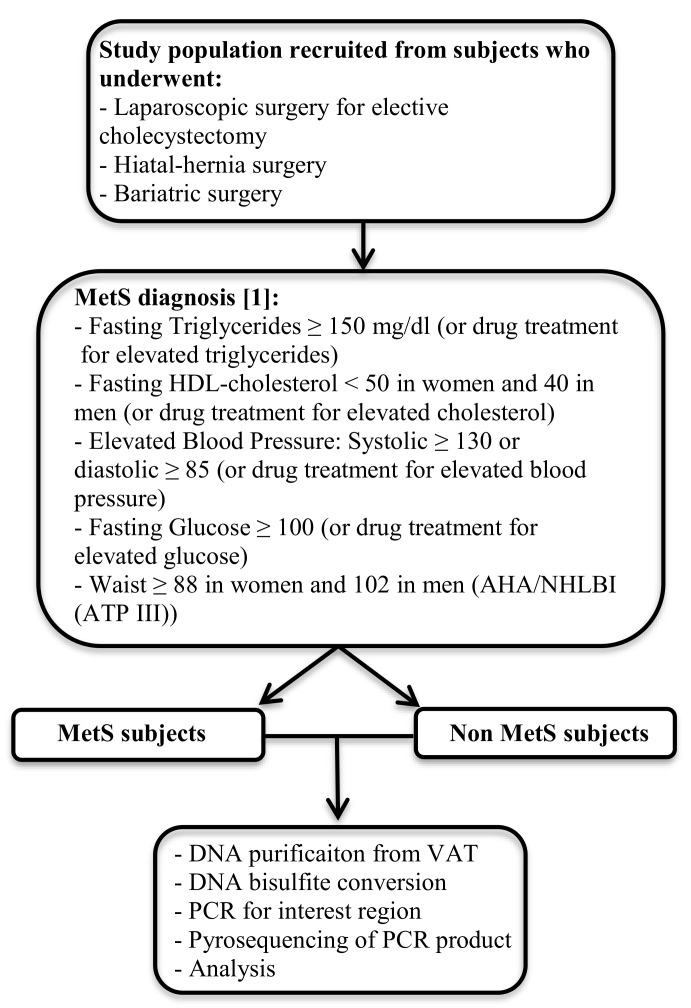
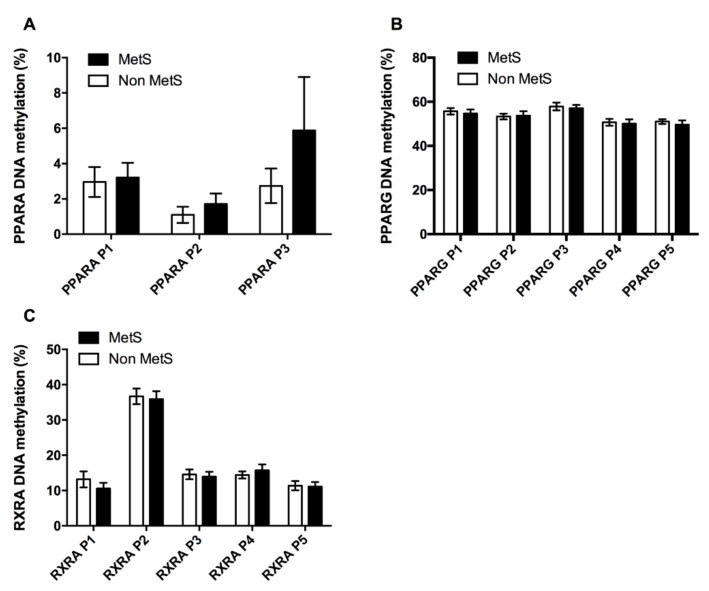
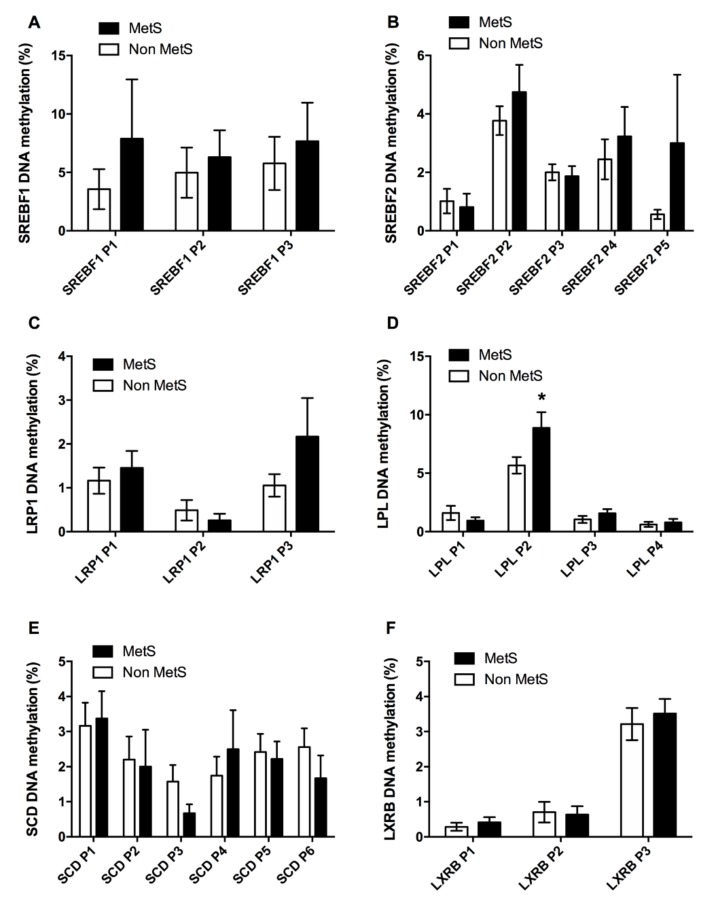
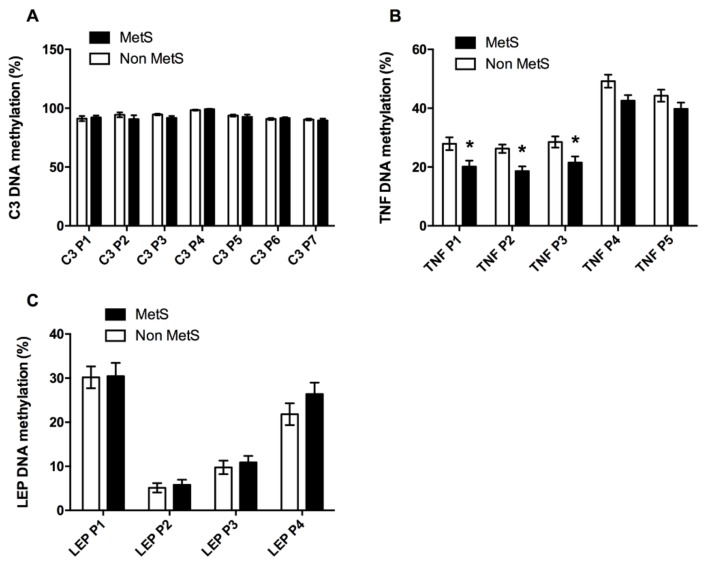
Metabolic syndrome (MetS) has been postulated to increase the risk for type 2 diabetes, cardiovascular disease and cancer. Adipose tissue (AT) plays an important role in metabolic homeostasis, and AT dysfunction has an active role in metabolic diseases. MetS is closely related to lifestyle and environmental factors. Epigenetics has emerged as an interesting landscape to evaluate the possible interconnection between AT and metabolic disease, since it can be modulated by environmental factors and metabolic status. The aim of this study was to determine whether MetS has an impact on the global DNA methylation pattern and the DNA methylation of several genes related to adipogenesis (PPARG, PPARA), lipid metabolism (RXRA, SREBF2, SREBF1, SCD, LPL, LXRb), and inflammation (LRP1 C3, LEP and TNF) in visceral adipose tissue. LPL and TNF DNA methylation values were significantly different in the control-case comparisons, with higher and lower methylation respectively in the MetS group. Negative correlations were found between global DNA methylation (measured by LINE-1 methylation levels) and the metabolic deterioration and glucose levels. There were associations among variables of MetS, BMI, and HOMA-IR with DNA methylation at several CpG positions for the studied genes. In particular, there was a strong positive association between serum triglyceride levels (TG) with PPARA and LPL methylation levels. TNF methylation was negatively associated with the metabolic worsening and could be an important factor in preventing MetS occurrence according to logistic regression analysis. Therefore, global DNA methylation and methylation at specific genes related to adipogenesis, lipid metabolism and inflammation are related to the etiology of MetS and might explain in part some of the features associated to metabolic disorders.
Keywords: DNA methylation; adipose tissue; epigenetics; metabolic syndrome.
Conflict of interest statement
The authors declare no conflict of interest.
Figures
Similar articles
-
Human adipose tissue H3K4me3 histone mark in adipogenic, lipid metabolism and inflammatory genes is positively associated with BMI and HOMA-IR.PLoS One. 2019 Apr 8;14(4):e0215083. doi: 10.1371/journal.pone.0215083. eCollection 2019. PLoS One. 2019. PMID: 30958852 Free PMC article.
-
Adipose Tissue LPL Methylation is Associated with Triglyceride Concentrations in the Metabolic Syndrome.Clin Chem. 2018 Jan;64(1):210-218. doi: 10.1373/clinchem.2017.277921. Epub 2017 Oct 18. Clin Chem. 2018. PMID: 29046332
-
Differential methylation in visceral adipose tissue of obese men discordant for metabolic disturbances.Physiol Genomics. 2014 Mar 15;46(6):216-22. doi: 10.1152/physiolgenomics.00160.2013. Epub 2014 Feb 4. Physiol Genomics. 2014. PMID: 24495915
-
Metabolic syndrome: an update on diagnostic criteria, pathogenesis, and genetic links.Hormones (Athens). 2018 Sep;17(3):299-313. doi: 10.1007/s42000-018-0051-3. Epub 2018 Aug 31. Hormones (Athens). 2018. PMID: 30171523 Review.
-
DNA methylation of genes in adipose tissue.Proc Nutr Soc. 2011 Feb;70(1):57-63. doi: 10.1017/S0029665110004015. Epub 2010 Dec 14. Proc Nutr Soc. 2011. PMID: 21144123 Review.
Cited by
-
Molecular Insight into the Interaction between Epigenetics and Leptin in Metabolic Disorders.Nutrients. 2019 Aug 12;11(8):1872. doi: 10.3390/nu11081872. Nutrients. 2019. PMID: 31408957 Free PMC article. Review.
-
DNA Methylation Is a Potential Biomarker for Cardiometabolic Health in Mexican Children and Adolescents.Epigenomes. 2023 Feb 3;7(1):4. doi: 10.3390/epigenomes7010004. Epigenomes. 2023. PMID: 36810558 Free PMC article.
-
Visceral Adipose Tissue Inflammatory Factors (TNF-Alpha, SOCS3) in Gestational Diabetes (GDM): Epigenetics as a Clue in GDM Pathophysiology.Int J Mol Sci. 2020 Jan 12;21(2):479. doi: 10.3390/ijms21020479. Int J Mol Sci. 2020. PMID: 31940889 Free PMC article.
-
Premature Vascular Aging in Guinea Pigs Affected by Fetal Growth Restriction.Int J Mol Sci. 2019 Jul 15;20(14):3474. doi: 10.3390/ijms20143474. Int J Mol Sci. 2019. PMID: 31311132 Free PMC article.
-
Horizontal Gene Transfer: From Evolutionary Flexibility to Disease Progression.Front Cell Dev Biol. 2020 May 19;8:229. doi: 10.3389/fcell.2020.00229. eCollection 2020. Front Cell Dev Biol. 2020. PMID: 32509768 Free PMC article. Review.
References
-
- Alberti K.G.M.M., Eckel R.H., Grundy S.M., Zimmet P.Z., Cleeman J.I., Donato K.A., Fruchart J.-C., James W.P.T., Loria C.M., Smith S.C. Harmonizing the Metabolic Syndrome: A Joint Interim Statement of the International Diabetes Federation Task Force on Epidemiology and Prevention; National Heart, Lung, and Blood Institute; American Heart Association; World Heart Federation; International Atherosclerosis Society; and International Association for the Study of Obesity. Circulation. 2009;120:1640–1645. doi: 10.1161/circulationaha.109.192644. - DOI - PubMed
-
- Castellano-Castillo D., Moreno-Indias I., Fernandez-Garcia J.C., Alcaide-Torres J., Moreno-Santos I., Ocana L., Gluckman E., Tinahones F., Queipo-Ortuno M.I., Cardona F. Adipose Tissue LPL Methylation Is Associated with Triglyceride Concentrations in the Metabolic Syndrome. Clin. Chem. 2017 doi: 10.1373/clinchem.2017.277921. - DOI - PubMed
Grants and funding
- CP16/00163/ISCIII-Co-Funded by Fondo Europeo de Desarrollo Regional-FEDER
- CPI13/00065/ISCIII-Co-Funded by Fondo Europeo de Desarrollo Regional-FEDER
- FPU13/04211/Ministerio de Educación, Cultura y Deporte-Co-Funded by Fondo Europeo de Desarrollo Regional-FEDER
- C-0032-2016/Consejería de Salud, co-funded by the Fondo Europeo de Desarrollo Regional - FEDER
- PI08/1655; PI11/02518; PI14/00082/Instituto de Salud Carlos III co-founded by Fondo Europeo de Desarrollo Regional - FEDER
LinkOut - more resources
Full Text Sources
Miscellaneous
