. 2019 Jan;12(1):e007835.
doi: 10.1161/CIRCIMAGING.118.007835.

18F-Fluoride Signal Amplification Identifies Microcalcifications Associated With Atherosclerotic Plaque Instability in Positron Emission Tomography/Computed Tomography Images

Affiliations

18F-Fluoride Signal Amplification Identifies Microcalcifications Associated With Atherosclerotic Plaque Instability in Positron Emission Tomography/Computed Tomography Images

Michael D Creager et al. Circ Cardiovasc Imaging. 2019 Jan.

Abstract

Background: Microcalcifications in atherosclerotic plaques are destabilizing, predict adverse cardiovascular events, and are associated with increased morbidity and mortality.18F-fluoride positron emission tomography (PET)/computed tomography (CT) imaging has demonstrated promise as a useful clinical diagnostic tool in identifying high-risk plaques; however, there is confusion as to the underlying mechanism of signal amplification seen in PET-positive, CT-negative image regions. This study tested the hypothesis that 18F-fluoride PET/CT can identify early microcalcifications.

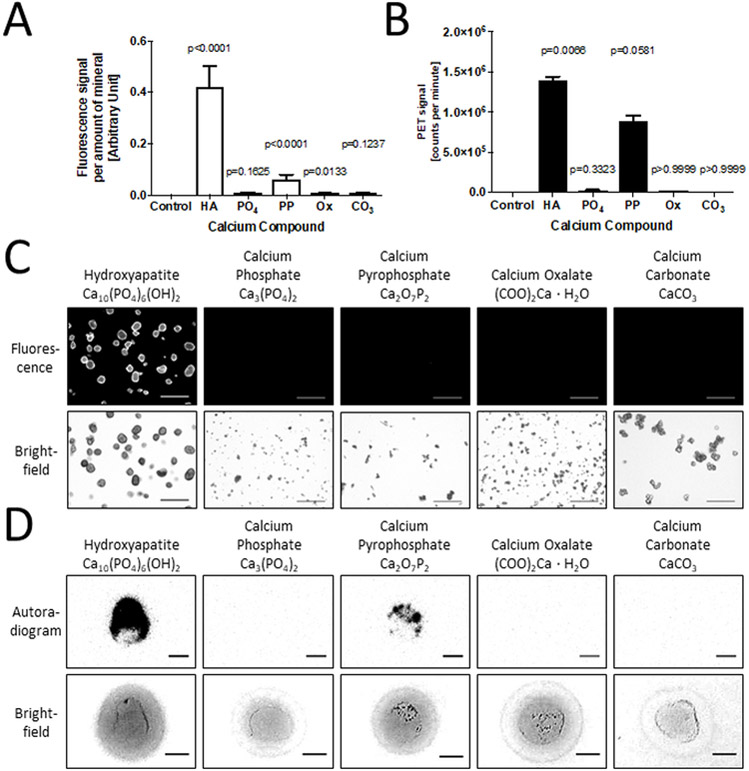
Methods: 18F-fluoride signal amplification derived from microcalcifications was validated against near-infrared fluorescence molecular imaging and histology using an in vitro 3-dimensional hydrogel collagen platform, ex vivo human specimens, and a mouse model of atherosclerosis.

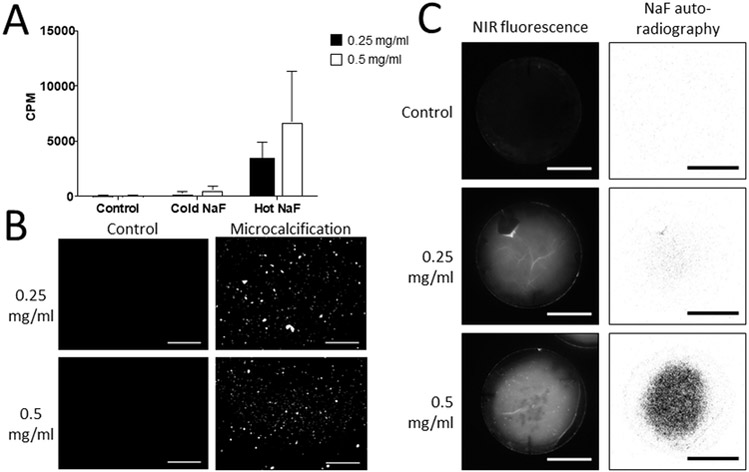
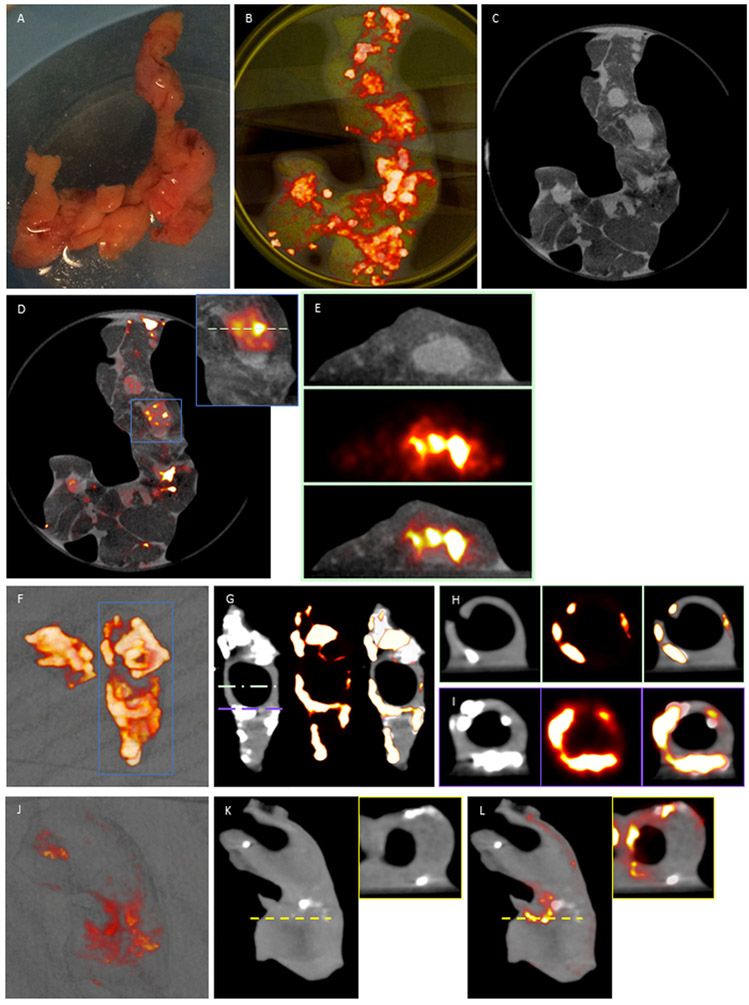
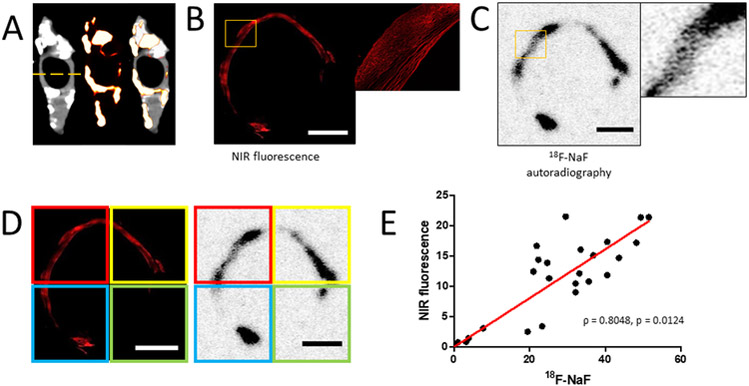
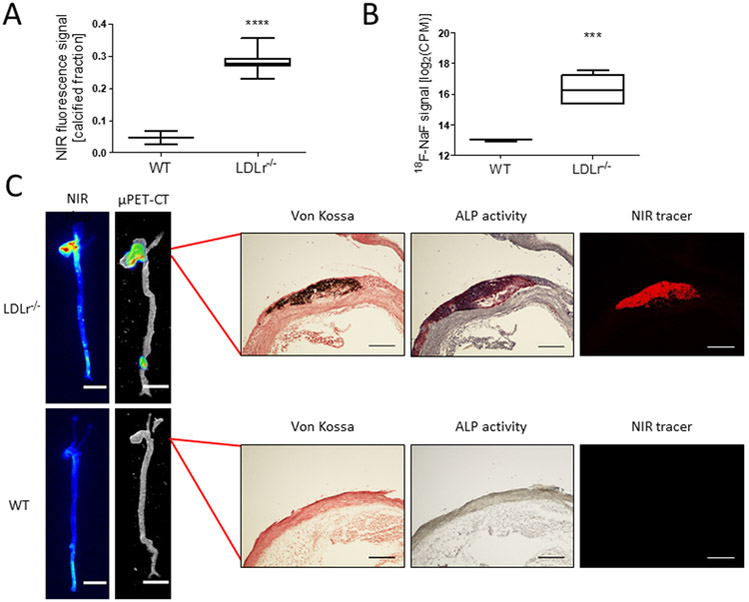
Results: Microcalcification size correlated inversely with collagen concentration. The 18F-fluoride ligand bound to microcalcifications formed by calcifying vascular smooth muscle cell derived extracellular vesicles in the in vitro 3-dimensional collagen system and exhibited an increasing signal with an increase in collagen concentration (0.25 mg/mL collagen -33.8×10²±12.4×10² counts per minute; 0.5 mg/mL collagen -67.7×10²±37.4×10² counts per minute; P=0.0014), suggesting amplification of the PET signal by smaller microcalcifications. We further incubated human atherosclerotic endarterectomy specimens with clinically relevant concentrations of 18F-fluoride. The 18F-fluoride ligand labeled microcalcifications in PET-positive, CT-negative regions of explanted human specimens as evidenced by 18F-fluoride PET/CT imaging, near-infrared fluorescence, and histological analysis. Additionally, the 18F-fluoride ligand identified micro and macrocalcifications in atherosclerotic aortas obtained from low-density lipoprotein receptor-deficient mice.

Conclusions: Our results suggest that 18F-fluoride PET signal in PET-positive, CT-negative regions of human atherosclerotic plaques is the result of developing microcalcifications, and high surface area in regions of small microcalcifications may amplify PET signal.

Keywords: atherosclerosis; fluoride; microcalcification; molecular imaging; positron emission tomography.


Figures

Figure 1.
Figure 1.. Affinity study of calcium salts with two markers for microcalcification - a near infrared fluorescence (NIRF) calcium tracer, and 18F-fluoride.
A, Signal quantification of NIRF tracer for individual calcium salts, and a Kruskal-Wallis test with Dunn’s multiple comparison test: Control – no mineral added (0.0±0.0, 0.0% of HA), HA – Hydroxyapatite (0.422±0.304, p<0.0001), PO4 – Calcium Phosphate (0.008±0.011, 1.8% of HA, p=0.1625), PP – Calcium Pyrophosphate (0.062±0.066, 14.8% of HA, p<0.001), Ox – Calcium Oxalate (0.006±0.008, 1.5% of HA, p=0.0133), CO3 – Calcium Carbonate (0.006±0.008, 1.5% of HA, p=0.1237). B, Signal quantification of radioactively labelled 18F-fluoride for different calcium salts, and a Kruskal-Wallis test with Dunn’s multiple comparison test: Control (0.007×10⁵±0.010×10⁵ CPM, 0.05% of HA), HA (13.9×10⁵±0.7×10⁵ CPM, p=0.0066), PO4 (0.27×10⁵±0.08×10⁵ CPM, 1.9% of HA, p=0.3323), PP (8.91×10⁵±0.94×10⁵ CPM, 64.0% of HA, p=0.0581), Ox (0.13×10⁵±0.01×10⁵ CPM, 0.9% of HA, p>0.9999), CO3 (0.006×10⁵±0.005×10⁵ CPM, 0.04% of HA, p>0.9999). C, Fluorescence images of different calcium salts after incubation with NIRF calcium tracer (scale bars, 100 µm). D, Autoradiograms of different calcium salts after incubation with 18F-fluoride (scale bars, 0.25 mm).
Figure 2.
Figure 2.. Collagen hydrogels demonstrate affinity of 18F-fluoride for microcalcifications.
A, Quantification of radioactive signal of 18F-NaF bound to microcalcifications within collagen hydrogels of two different collagen concentrations and two-way ANOVA analysis. Control – collagen hydrogels incubated without extracellular vesicles (0.25 mg/ml - 0.88×10²±0.02×10² CPM; 0.5 mg/ml - 0.85×10²±0.04 ×10² CPM). Cold NaF - a mixture of radioactively labeled 18F-fluoride and unlabeled fluoride to test for nonspecific binding of the tracer to microcalcifications (0.25 mg/ml - 2.59×10²±1.62×10² CPM; 0.5 mg/ml - 5.67×10²±2.79×10² CPM). Hot NaF – radioactively labeled 18F-fluoride for total binding (0.25 mg/ml - 33.8×10²±12.4×10² CPM; 0.5 mg/ml - 67.7×10²±37.4×10² CPM) (p=0.0014). P-value of the labeling method = 0.0014, p-value associated with collagen concentration = 0.2119, p-value of the interaction = 0.2956. B, Fluorescence microscopy of microcalcifications in collagen hydrogels with microcalcifications after incubation with bisphosphonate-based fluorescent tracer (scale bars 100 µm). Two different collagen concentrations were used for the hydrogels. C, NIRF and autoradiography of microcalcifications in 3D collagen hydrogels after incubation with a NIRF tracer or 18F-fluoride, respectively (scale bars 10 mm).
Figure 3.
Figure 3.. Coronary artery (a-e) and carotid endarterectomy specimens (f-l) 18F-fluoride μPET/CT.
A, Explanted coronary artery specimens were incubated in 100kBq/mL 18F-fluoride (t=60 mins). B, 3-dimensional volume rendered casts colocalizes binding to coronary artery sections with paucity of uptake in the surrounding epicardial fat and myocardium C, μCT and, D, fused images enabled, E, detailed axial reconstruction of 18F-fluoride binding in non-calcified coronary artery walls. F & J, 3-dimensional volume rendered casts of 18F-fluoride binding in explanted carotid artery specimens. G & K, sagittal CT colocalizes 18F-fluoride binding to exposed surfaces of hydroxyapatite on macrocalcified tissue. H, I, K (inset) & l (inset), focal 18F-fluoride binding is present in non-calcified regions of the carotid artery wall.
Figure 4.
Figure 4.. Quantitative histological analysis of PET-positive/CT-negative areas of carotid endarterectomy sample
A, Location of section taken for histological analysis of carotid endarterectomy sample. B, Confocal microscopy imaging of carotid endarterectomy section after incubation with a NIRF calcium tracer (scale bar 2 mm). C, Autoradiography imaging of the same histological section after incubation with 18F-fluoride (scale bar 2 mm). D, Confocal and autoradiography images were divided into four quadrants and each quadrant of the images was quantified (scale bars 2 mm). E, Linear correlation between NIRF signal and 18F-fluoride autoradiography signal (Pearson R = 0.8048, p = 0.0124; n = 6 histological sections were analyzed).
Figure 5.
Figure 5.. µPET/CT scan of calcified murine aortas shows presence of macro- and microcalcification and correlation between NIRF and PET signals.
A, Ex vivo fluorescence, and B, ex vivo autoradiography imaging quantification of the calcified fraction of murine aortas for knockout (p<0.0001, Welch’s t-test of log2(CPM) values) C, Respective murine aortic regions were sectioned and stained with von Kossa, ALP, and NIRF tracers to confirm the presence of calcification. Stains show consecutive sections (5 µm) (scale bars, NIRF and µPET/CT = 5 mm; von Kossa, ALP, and NIRF = 200 µm).

Comment in

References

    1. Greenland P, LaBree L, Azen SP, Doherty TM and Detrano RC. Coronary artery calcium score combined with Framingham score for risk prediction in asymptomatic individuals. Jama. 2004;291:210–5. - PubMed
    1. Detrano R, Guerci AD, Carr JJ, Bild DE, Burke G, Folsom AR, Liu K, Shea S, Szklo M, Bluemke DA, O’Leary DH, Tracy R, Watson K, Wong ND and Kronmal RA. Coronary calcium as a predictor of coronary events in four racial or ethnic groups. The New England journal of medicine. 2008;358:1336–45. - PubMed
    1. Hecht HS, Cronin P, Blaha MJ, Budoff MJ, Kazerooni EA, Narula J, Yankelevitz D and Abbara S. 2016 SCCT/STR guidelines for coronary artery calcium scoring of noncontrast noncardiac chest CT scans: A report of the Society of Cardiovascular Computed Tomography and Society of Thoracic Radiology. Journal of cardiovascular computed tomography. 2017;11:74–84. - PubMed
    1. Adamson PD, Vesey AT, Joshi NV, Newby DE and Dweck MR. Salt in the wound: (18)F-fluoride positron emission tomography for identification of vulnerable coronary plaques. Cardiovasc Diagn Ther. 2015;5:150–5. - PMC - PubMed
    1. O’Brien KD, Kuusisto J, Reichenbach DD, Ferguson M, Giachelli C, Alpers CE and Otto CM. Osteopontin is expressed in human aortic valvular lesions. Circulation. 1995;92:2163–8. - PubMed

Publication types

MeSH terms