. 2019 Jan 14;13(1):7.
doi: 10.1186/s12918-018-0672-9.

An agent-based model of the Notch signaling pathway elucidates three levels of complexity in the determination of developmental patterning

Affiliations

An agent-based model of the Notch signaling pathway elucidates three levels of complexity in the determination of developmental patterning

Elaine R Reynolds et al. BMC Syst Biol. .

Abstract

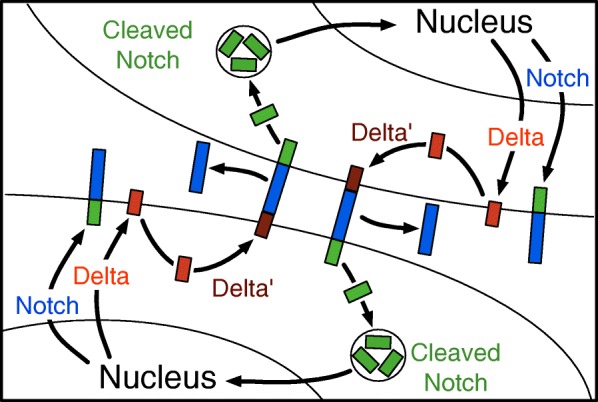
Background: The Notch signaling pathway is involved in cell fate decision and developmental patterning in diverse organisms. A receptor molecule, Notch (N), and a ligand molecule (in this case Delta or Dl) are the central molecules in this pathway. In early Drosophila embryos, these molecules determine neural vs. skin fates in a reproducible rosette pattern.

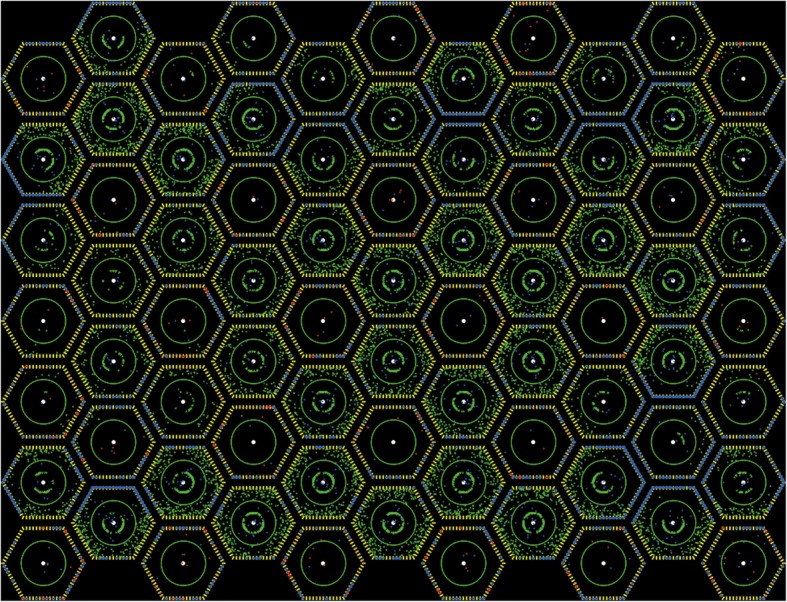
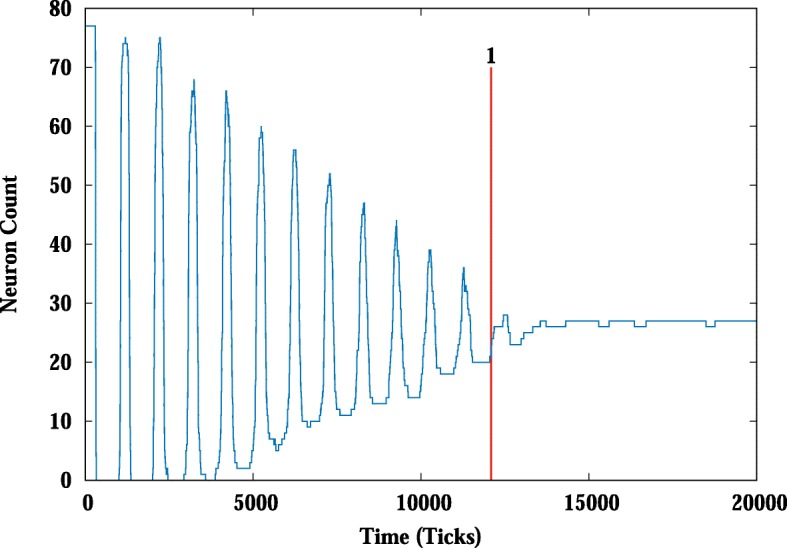
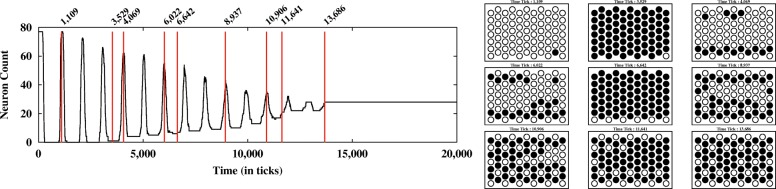
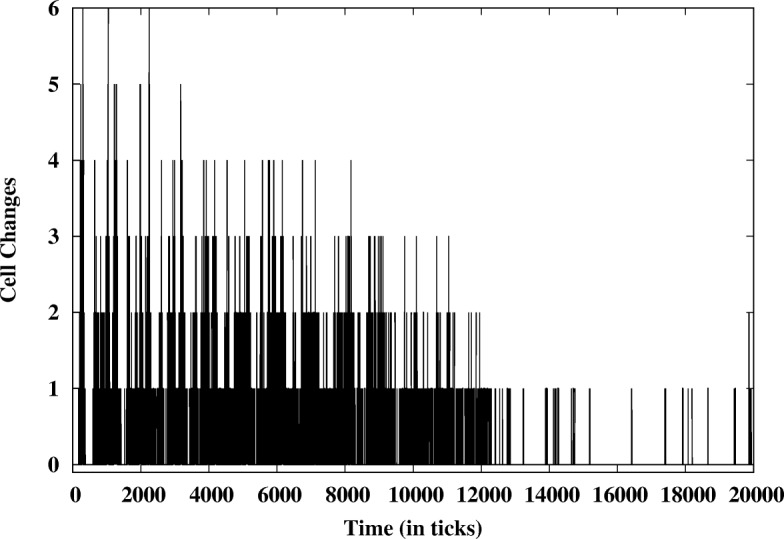
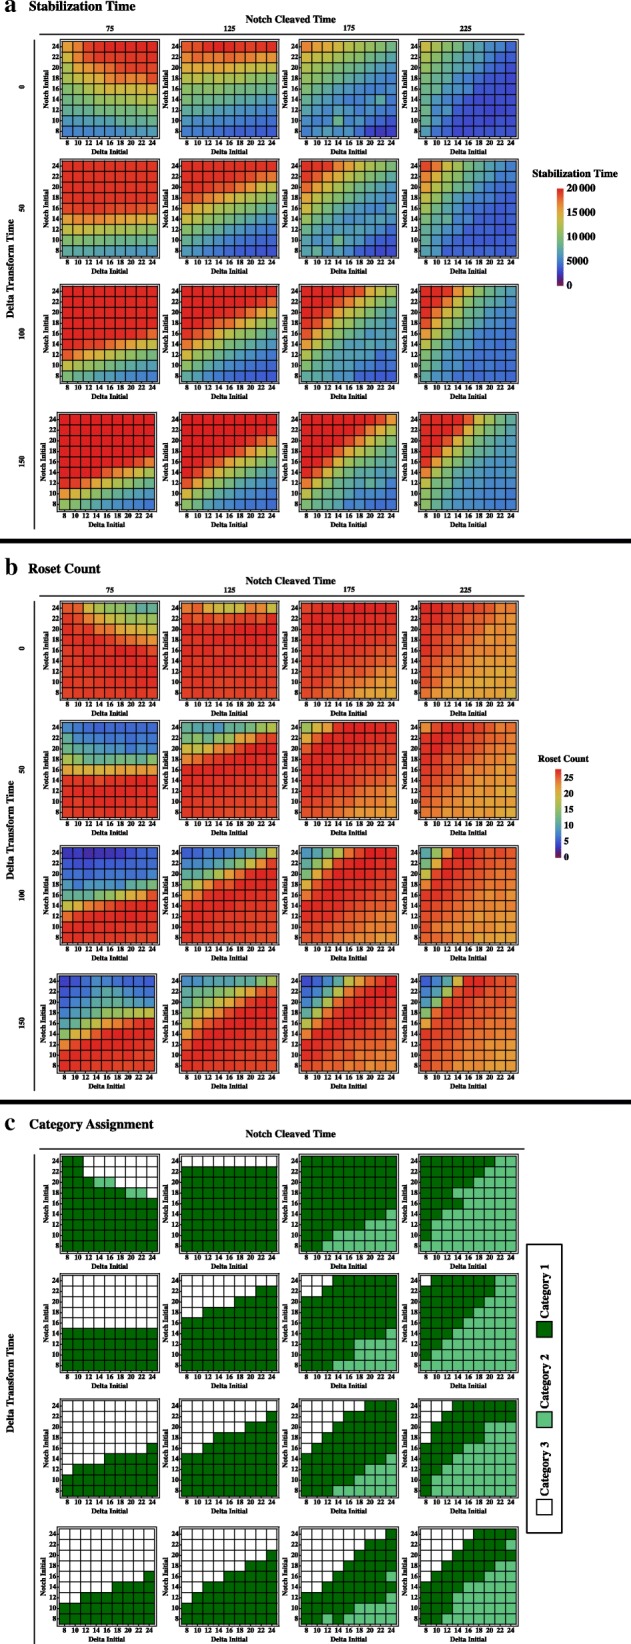
Results: We have created an agent-based model (ABM) that simulates the molecular components for this signaling pathway as agents acting within a spatial representation of a cell. The model captures the changing levels of these components, their transition from one state to another, and their movement from the nucleus to the cell membrane and back to the nucleus again. The model introduces stochastic variation into the system using a random generator within the Netlogo programming environment. The model uses these representations to understand the biological systems at three levels: individual cell fate, the interactions between cells, and the formation of pattern across the system. Using a set of assessment tools, we show that the current model accurately reproduces the rosette pattern of neurons and skin cells in the system over a wide set of parameters. Oscillations in the level of the N agent eventually stabilize cell fate into this pattern. We found that the dynamic timing and the availability of the N and Dl agents in neighboring cells are central to the formation of a correct and stable pattern. A feedback loop to the production of both components is necessary for a correct and stable pattern.

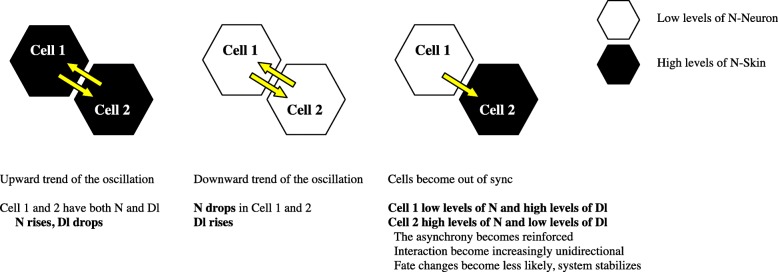
Conclusions: The signaling pathways within and between cells in our model interact in real time to create a spatially correct field of neurons and skin cells. This model predicts that cells with high N and low Dl drive the formation of the pattern. This model also be used to elucidate general rules of biological self-patterning and decision-making.

Keywords: Agent-based modeling; Notch signaling pathway; Self-patterning.


Conflict of interest statement

Ethics approval and consent to participate

Not applicable.

Consent for publication

Not applicable.

Competing interests

The authors declare that they have no competing interests.

Publisher’s Note

Springer Nature remains neutral with regard to jurisdictional claims in published maps and institutional affiliations.

Figures

Fig. 1
Fig. 1
The cellular events of N signaling pathway. The steps are (1) N and Dl proteins are transcribed, translated and transported to the cell membrane; (2) Dl undergoes an endocytic processing step to become the ligand for N; (3) the Dl ligand and N receptor interact resulting in a cleavage and endocytosis of a N fragment; (4) A second cleavage releases a N product that is translocated to the nucleus
Fig. 2
Fig. 2
A NetLogo screen capture of the sheet of cells in the model space. The yellow agents are Mem and represent the membrane of the cell. Nm agents are blue, and all Dl agents are red. The nucleus is delineated by a green circle with a white dot in it (representing the spatial location where new agents are produced as part of the Netlogo programming environment). Nc agents are green and are outside the nucleus and the Nn agents are also green but are within the nucleus. They accumulate in an arc just inside the nuclear
Fig. 3
Fig. 3
Remapping from the model representation to a sequence. As the model runs, two types of information at each time point are collected: The number of Nn agents in a given cell (signal strength, bottom number in each cell) and the position of that cell in the field (pattern, top number in each cell). The scaled signal condenses the N level to the base 10 logarithm with the special zero-signal case equating to zero (a 0 to 0, 1 thru 9 to 1, 10 thru 99 to 2, etc)
Fig. 4
Fig. 4
Stabilization time metric. Stabilization points are defined as the earliest point where there is deviation of one neuron or less as indicated by the red line
Fig. 5
Fig. 5
Dynamics of a single model run. A histogram is created to capture the neuron count vs time (left) as shown above in Fig. 4 and a diagram showing position can be constructed (right) from the N level and positional data information. White represents neurons and black, skin cells
Fig. 6
Fig. 6
Measure of cell fate change over time during a model run. This analysis compares the changes in cell fate using a modification of Hamming distance to compare strings at adjacent time points
Fig. 7
Fig. 7
Overall characteristics of runs with variations of four parameter settings. The histogram on the left shows stabilization time for all runs, while the histogram on the right shows rosette counts for all runs
Fig. 8
Fig. 8
Data set varying four different parameters. For each individual graphs, initial N setting is on the y axis and initial Dl setting is on the x axis. Progression left to right for each row is increasing Nc to Nn transition time. Progression from top to bottom represents increasing Dlm to Dlm’ transition time. a stability time (blue is low stabilization time and red is high) b rosette counts (blue is low rosette counts and red is high). c category assignments (white represents runs that fail to stabilize within 18,000 time, light green represents runs that stabilize with the incorrect number of rosettes (< 25), and dark green representing runs that stabilize with the correct number of rosettes
Fig. 9
Fig. 9
Interactions within model that lead to stabilized fate

References

    1. Artavanis-Tsakonas S, Muskavitch MAT. Notch: the past, the present and the future. Curr Top Dev Biol. 2010;92:1–29. doi: 10.1016/S0070-2153(10)92001-2. - DOI - PubMed
    1. Kooh PJ, Fehon RG, Muskavitch MAT. Implications of dynamic patterns of Delta and Notch expression for cellular interactions during Drosophila development. Development. 1993;117:493–507. - PubMed
    1. Artavanis-Tsakonas S, Matsuno K, Fortini ME. Notch signaling. Science. 1995;268:225–232. doi: 10.1126/science.7716513. - DOI - PubMed
    1. Kopan R, Ilagan MXG. The canonical Notch Signaling pathway: unfolding the activation mechanism. Cell. 2009;137:216–233. doi: 10.1016/j.cell.2009.03.045. - DOI - PMC - PubMed
    1. Tien A-C, Rajan A, Bellen H. A Notch updated. J Cell Biol. 2009;184:621–629. doi: 10.1083/jcb.200811141. - DOI - PMC - PubMed

Publication types

Substances

LinkOut - more resources