. 2019 Jan 14;17(1):4.
doi: 10.1186/s12964-019-0318-6.

Overexpression of MTA1 inhibits the metastatic ability of ZR-75-30 cells in vitro by promoting MTA2 degradation

Affiliations

Overexpression of MTA1 inhibits the metastatic ability of ZR-75-30 cells in vitro by promoting MTA2 degradation

Long Zhang et al. Cell Commun Signal. .

Abstract

Background: As the first member of the metastasis-associated protein (MTA) family, MTA1 and another MTA family member, MTA2, have both been reported to promote breast cancer progression and metastasis. However, the difference and relationship between MTA1 and MTA2 have not been fully elucidated.

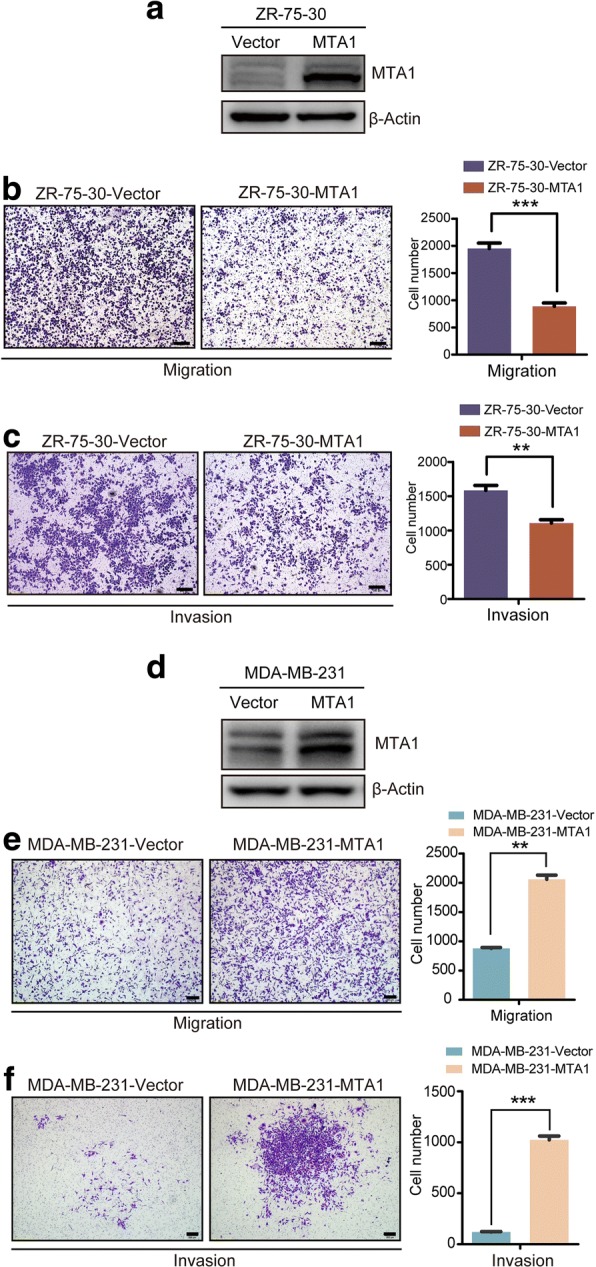
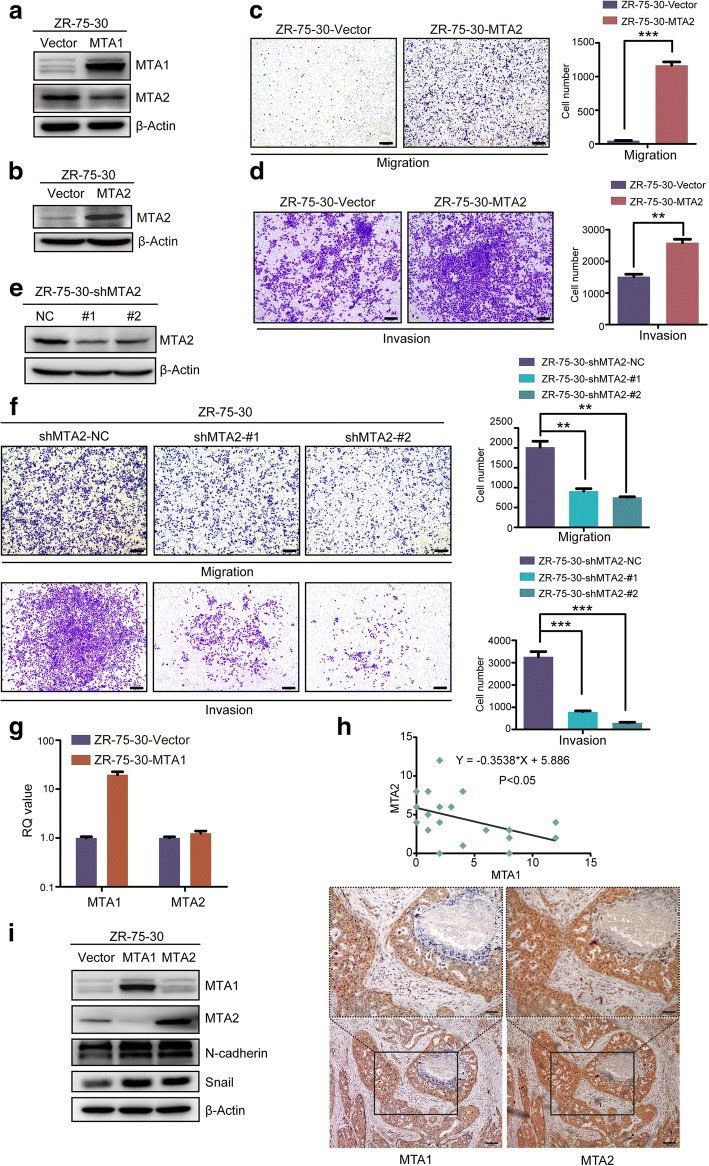
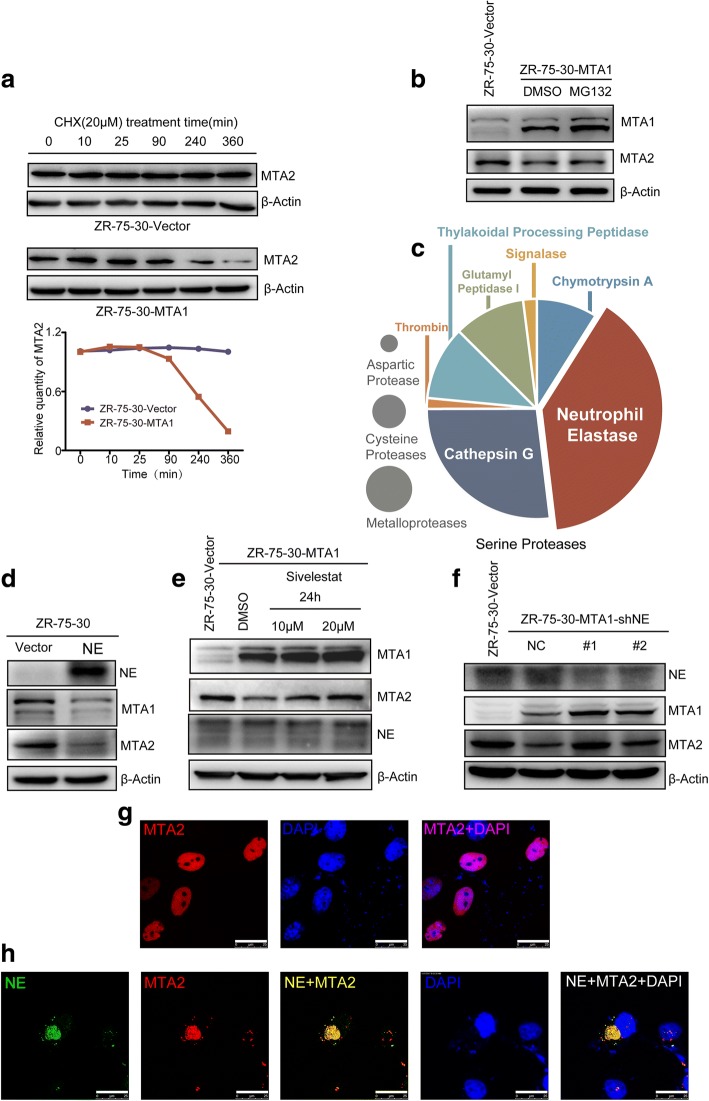
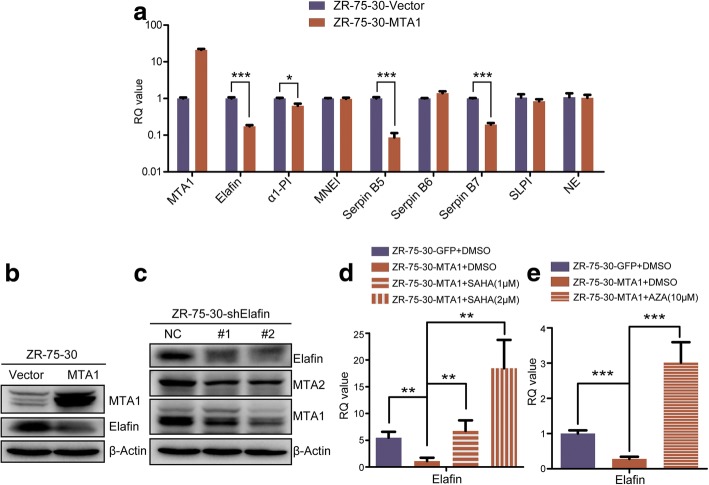
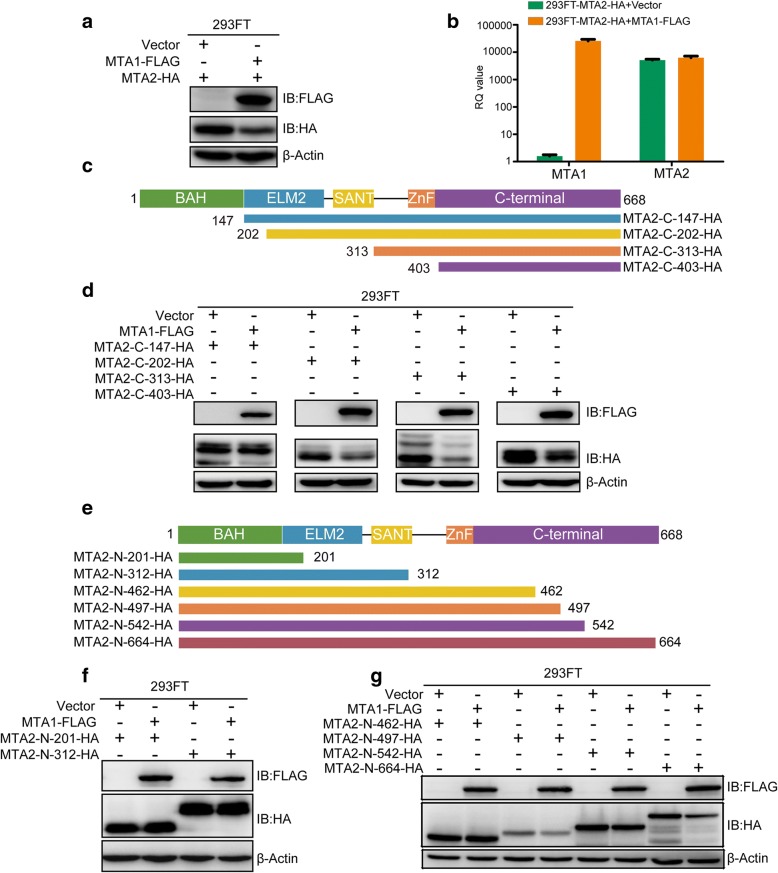
Methods: Transwell assays were used to assess the roles of MTA1 and MTA2 in the metastasis of ZR-75-30 luminal B breast cancer cells in vitro. Immunoblotting and qRT-PCR were used to evaluate the effect of MTA1 overexpression on MTA2. Proteases that cleave MTA2 were predicted using an online web server. The role of neutrophil elastase (NE) in MTA1 overexpression-induced MTA2 downregulation was confirmed by specific inhibitor treatment, knockdown, overexpression and immunocytochemistry, and NE cleavage sites in MTA2 were confirmed by MTA2 truncation and mutation. The effect of MTA1 overexpression on the intrinsic inhibitor of NE, elafin, was detected by qRT-PCR, immunoblotting and treatment with inhibitors.

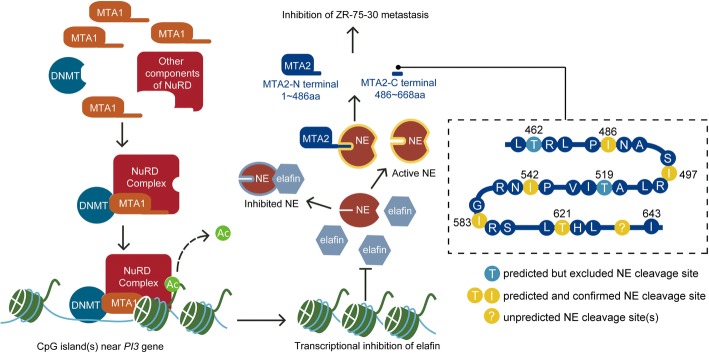
Results: MTA1 overexpression inhibited, while MTA2 promoted the metastasis of ZR-75-30 cells in vitro. MTA1 overexpression downregulated MTA2 expression at the protein level rather than the mRNA level. NE was predicted to cleave MTA2 and was responsible for MTA1 overexpression-induced MTA2 degradation. NE was found to cleave MTA2 in the C-terminus at the 486, 497, 542, 583 and 621 sites. MTA1 overexpression activated NE by downregulating elafin in a histone deacetylase- and DNA methyltransferase-dependent manner.

Conclusions: MTA1 and MTA2 play opposing roles in the metastasis of ZR-75-30 luminal B breast cancer cells in vitro. MTA1 downregulates MTA2 at the protein level by epigenetically repressing the expression of elafin and releasing the inhibition of neutrophil elastase, which cleaves MTA2 in the C-terminus at multiple specific sites.

Keywords: Breast cancer metastasis; Elafin; MTA1; MTA2; Neutrophil elastase.


Conflict of interest statement

Ethics approval and consent to participate

Not applicable

Consent for publication

Not applicable

Competing interests

The authors declare that they have no competing interests.

Publisher’s Note

Springer Nature remains neutral with regard to jurisdictional claims in published maps and institutional affiliations.

Figures

Fig. 1
Fig. 1
MTA1 overexpression inhibited the metastasis of ZR-75-30 cells. a MTA1 was overexpressed in ZR-75-30-MTA1 stable cell line compared to its control cell line ZR-75-30-Vector. Detected by immunoblot. b Overexpression of MTA1 significantly inhibited the migration and (c) invasion of ZR-75-30 cells in vitro. Detected by transwell migration and invasion assays. 30,000 cells migrated for 24 h. Scale bars = 200 μm, mean ± SD, n = 3,***P < 0.001, **P < 0.01, t test. c MTA1 was overexpressed in MDA-MB-231 cells compared with control cells. d Overexpression of MTA1 significantly promoted the migration and (e) invasion of MDA-MB-231 cells in vitro. Scale bars = 200 μm, mean ± SD, n = 3,***P < 0.001, **P < 0.01, t test
Fig. 2
Fig. 2
Overexpression of MTA1 downregulated MTA2 which promotes the metastasis of ZR-75-30 cells. a MTA2 was downregulated by MTA1 overexpression. b MTA2 was overexpressed in ZR-75-30-MTA2 cell line. c Overexpression of MTA2 significantly promoted the migration and (d) invasion of ZR-75-30 cells in vitro. 50,000 cells migrated for 20 h. 40,000 cells, invaded for 2.5d. Scale bars = 200 μm, mean ± SD, n = 3,**P < 0.01, ***P < 0.001, t test. e MTA2 was knocked down by 2 shRNAs specifically targeting MTA2. f MTA2 knockdown significantly inhibited the migration and invasion of ZR-75-30 cells. 35,000 cells and 50,000 cells migrated for 36 h and invaded for 3.5d respectively. Scale bars = 200 μm, mean ± SD, n = 3,**P < 0.01,***P < 0.001, t test. g Overexpression of MTA1 did not repress the transcription of MTA2. Detected by qRT-PCR. Mean ± SD, n = 3, RQ value: relative quantified value of mRNA expression. h The protein level of MTA1 and MTA2 are negatively correlated in tissues derived from luminal B breast cancer patients. Detected by IHC. Scale bars in upper box = 50 μm, scale bars in lower box = 100 μm. i Both overexpression of MTA1 and MTA2 increased EMT landmarks Snail and N-cadherin
Fig. 3
Fig. 3
NE is responsible for MTA1 induced MTA2 downregulation. a Overexpression of MTA1 decreased the protein stability of MTA2. b Treatment of ZR-75-30-MTA1 cells with MG132 (5 μM, 12 h) increased the protein level of MTA1 but did not increase that of MTA2. c Schematic diagram of the proteases predicted to cleave MTA2 at PROSPER website.NE is predicted to have the most cleavage sites in MTA2. d Overexpression of NE downregulated MTA2 and MTA1. e NE specific inhibitor sivelestat treatment restored MTA2, and upregulated MTA1, in ZR-75-30-MTA1 cells in a dose dependent manner. f NE knockdown increased the protein level of MTA2 and MTA1. g MTA2 located exclusively in nuclei. Detected by ICC. Scale bars = 25 μm. h MTA2 and NE co-localized in cytoplasm. Scale bars = 25 μm
Fig. 4
Fig. 4
MTA1 overexpression significantly inhibited the transcription of the intrinsic inhibitor of NE, elafin, in a HDAC and/or DNMT dependent manner. a Overexpression of MTA1 significantly downregulated the mRNA level of intrinsic inhibitors of NE, elafin and α1-PI, and serine protease inhibitors Serpin B5 and Serpin B7, but didn’t significantly change the transcription of NE, MNEI, Serpin B6, and SLPI. Mean ± SD, n = 3, *P < 0.05, ***P < 0.001, t test. b MTA1 overexpression decreased the protein level of elafin. c Knocking down of elafin decreased MTA2 and MTA1 at protein level. d HDAC inhibitor and e DNMT inhibitor treatments increased the mRNA level of elafin. ZR-75-30-MTA1 cells were treated with HDAC inhibitor SAHA and DNMT inhibitor, AZA, for 48 h, after which the mRNA level of elafin significantly elevated, even to a value higher than that of ZR-75-30-Vector. Mean ± SD, n = 3, **P < 0.01, ***P < 0.001, t test
Fig. 5
Fig. 5
NE cleavage site(s) locate(s) in MTA2 at its C terminus. a FLAG-tagged MTA1 downregulated HA-tagged MTA2 in 293FT cells. b The expression of MTA1-FLAG did not decrease the mRNA level of MTA2-HA in 293FT cells. Mean ± SD, n = 3, t test. c Schematic diagram of the constructed C-terminal truncated mutants of MTA2 fused with HA tag. The full length of MTA2 contains 668aa. The C-terminal truncated mutant from 147aa to 668aa fused with HA tag was designated as MTA2-C-147-HA, and the rest were designated in a similar fashion. d MTA1-FLAG downregulated all 4 C-terminal truncated mutants of MTA2. e Schematic diagram of the constructed MTA2 N-terminal truncated mutants. f MTA2-N-201-HA, MTA2-N-312-HA and (g) MTA2-N-462-HA instead of MTA2-N-497-HA and longer N-terminal truncated mutants of MTA2 could not be downregulated by MTA1-FLAG
Fig. 6
Fig. 6
486, 497, 542, 583 and 621 sites were identified to be NE cleavage sites of MTA2. a Schematic diagram of the predicted 9 NE cleavage sites after 461 locating in MTA2 C-terminus. b Identification of 486, (c) 497 (d) 542, 583 and (e) 621 as NE cleavage sites. f Unpredicted NE cleavage site(s) may locate between 621 and 643 sites. g MTA2-N-624-I486GI497GI542GI583GT621G-HA, designated as MTA2-N-624-5smut-HA was overexpressed in ZR-75-30 cells. h Overexpression of MTA2-N-624-5smut-HA significantly promoted the migration and (i) invasion of ZR-75-30-MTA1 cells. Scale bars = 200 μm, mean ± SD, n = 3,***P < 0.001, t test. j MTA2-N-486-HA showed a tendency of diffusing into cytoplasm. Scale bars = 25 μm
Fig. 7
Fig. 7
Schematic diagram of the mechanism by which MTA1 downregulate MTA2

References

    1. Siegel RL, Miller KD, Jemal A. Cancer statistics, 2018. CA Cancer J Clin. 2018;68(1):7–30. - PubMed
    1. Eroles P, Bosch A, Perez-Fidalgo JA, Lluch A. Molecular biology in breast cancer: intrinsic subtypes and signaling pathways. Cancer Treat Rev. 2012;38(6):698–707. - PubMed
    1. Bosch A, Eroles P, Zaragoza R, Vina JR, Lluch A. Triple-negative breast cancer: molecular features, pathogenesis, treatment and current lines of research. Cancer Treat Rev. 2010;36(3):206–215. - PubMed
    1. Kennecke H, Yerushalmi R, Woods R, Cheang MC, Voduc D, Speers CH, et al. Metastatic behavior of breast cancer subtypes. J Clin Oncol. 2010;28(20):3271–3277. - PubMed
    1. Tran B, Bedard PL. Luminal-B breast cancer and novel therapeutic targets. Breast Cancer Res. 2011;13(6):221. - PMC - PubMed

Publication types

MeSH terms