. 2019 Jan 15:8:e39856.
doi: 10.7554/eLife.39856.

Genomics of 1 million parent lifespans implicates novel pathways and common diseases and distinguishes survival chances

Collaborators, Affiliations

Genomics of 1 million parent lifespans implicates novel pathways and common diseases and distinguishes survival chances

Paul Rhj Timmers et al. Elife. .

Abstract

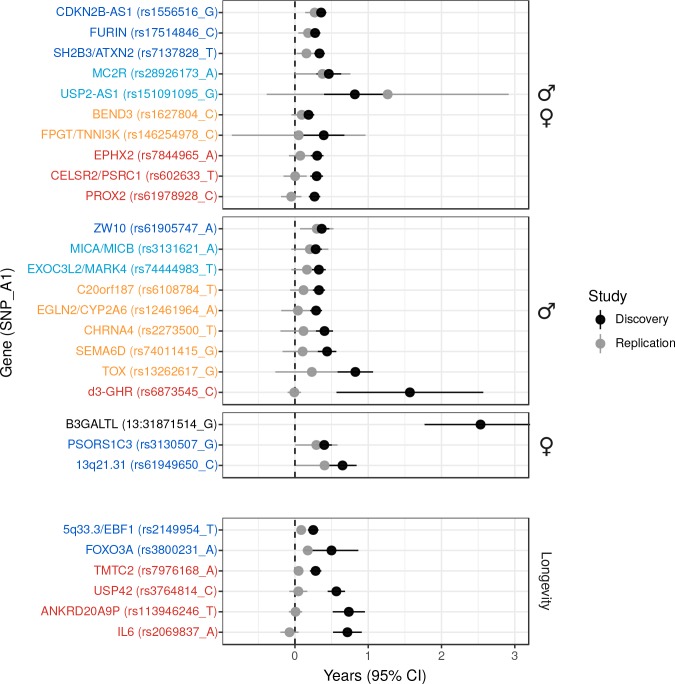
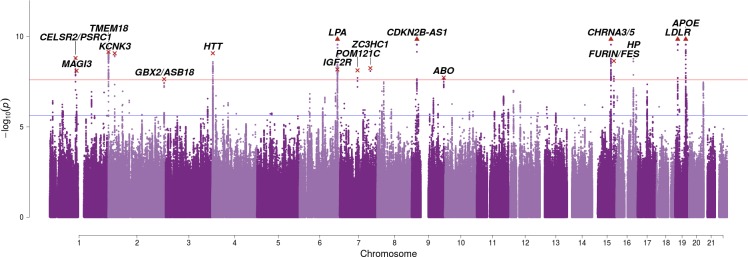
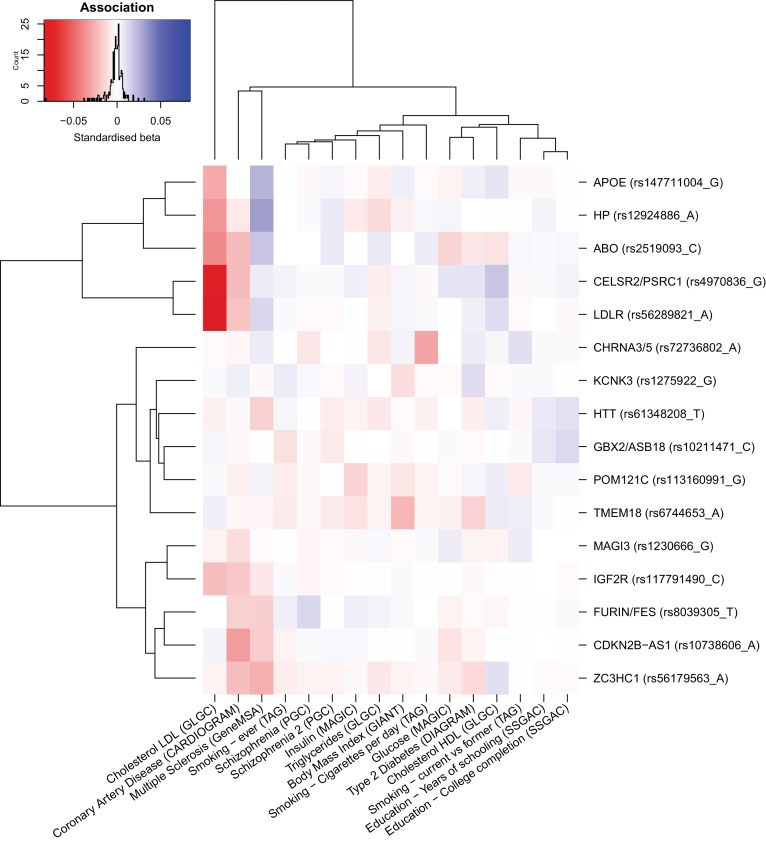
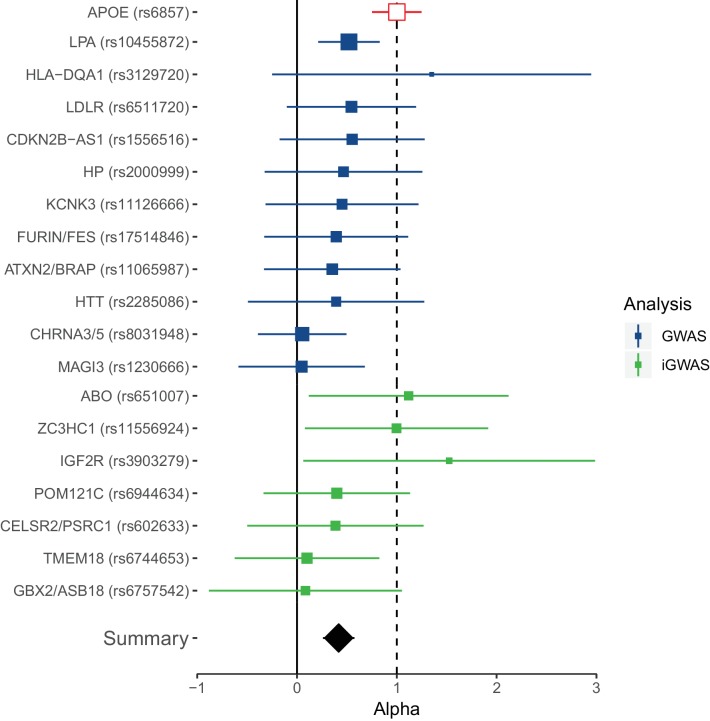
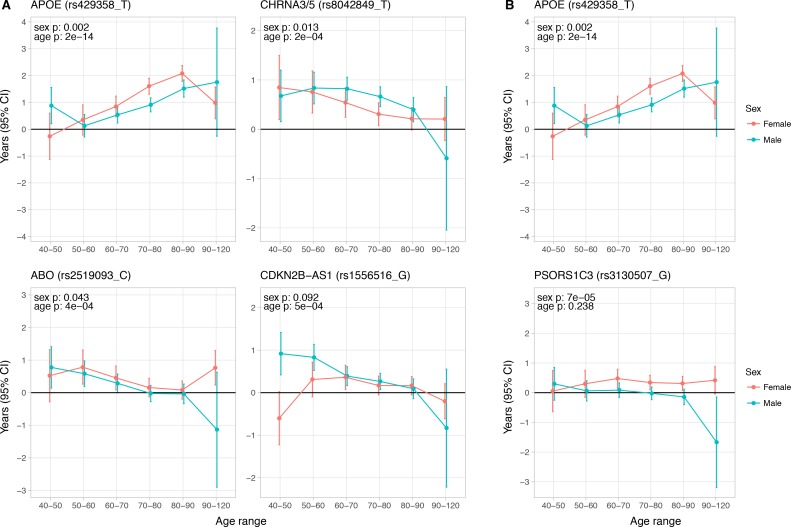
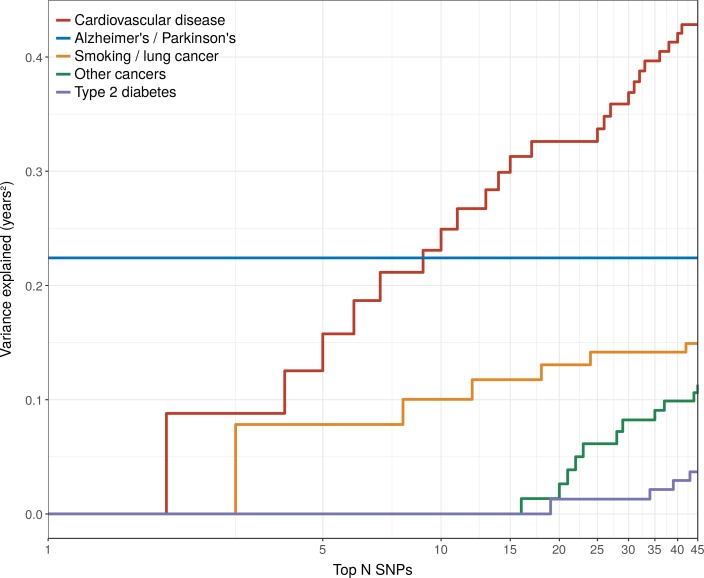
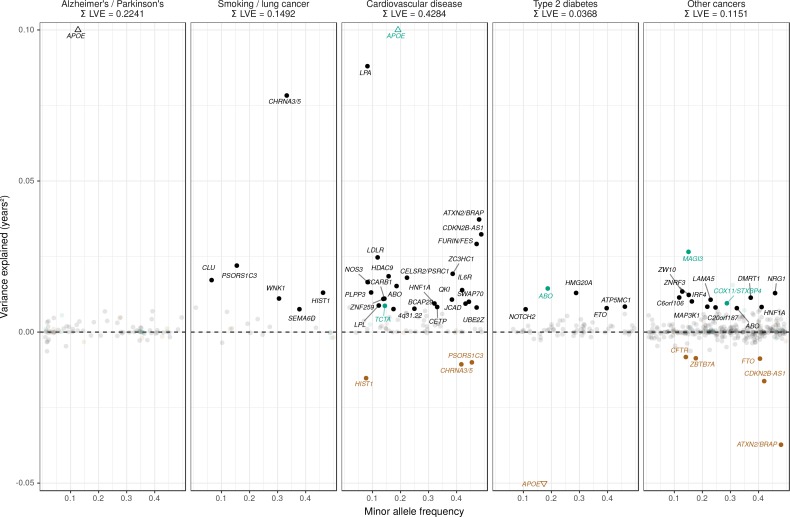
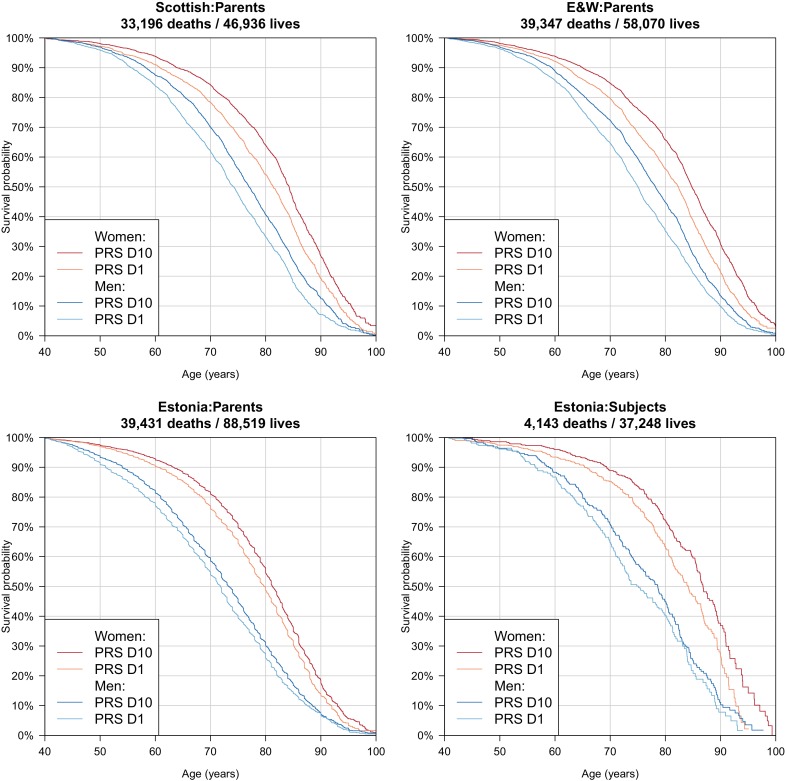
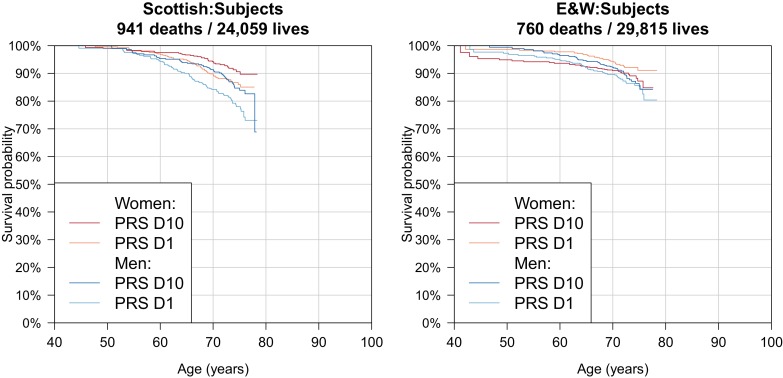
We use a genome-wide association of 1 million parental lifespans of genotyped subjects and data on mortality risk factors to validate previously unreplicated findings near CDKN2B-AS1, ATXN2/BRAP, FURIN/FES, ZW10, PSORS1C3, and 13q21.31, and identify and replicate novel findings near ABO, ZC3HC1, and IGF2R. We also validate previous findings near 5q33.3/EBF1 and FOXO3, whilst finding contradictory evidence at other loci. Gene set and cell-specific analyses show that expression in foetal brain cells and adult dorsolateral prefrontal cortex is enriched for lifespan variation, as are gene pathways involving lipid proteins and homeostasis, vesicle-mediated transport, and synaptic function. Individual genetic variants that increase dementia, cardiovascular disease, and lung cancer - but not other cancers - explain the most variance. Resulting polygenic scores show a mean lifespan difference of around five years of life across the deciles.

Editorial note: This article has been through an editorial process in which the authors decide how to respond to the issues raised during peer review. The Reviewing Editor's assessment is that all the issues have been addressed (see decision letter).

Keywords: complex trait; genetics; genomics; human; lifespan; longevity.

Plain language summary

Ageing happens to us all, and as the cabaret singer Maurice Chevalier pointed out, "old age is not that bad when you consider the alternative". Yet, the growing ageing population of most developed countries presents challenges to healthcare systems and government finances. For many older people, long periods of ill health are part of the end of life, and so a better understanding of ageing could offer the opportunity to prolong healthy living into old age. Ageing is complex and takes a long time to study – a lifetime in fact. This makes it difficult to discern its causes, among the countless possibilities based on an individual’s genes, behaviour or environment. While thousands of regions in an individual’s genetic makeup are known to influence their risk of different diseases, those that affect how long they will live have proved harder to disentangle. Timmers et al. sought to pinpoint such regions, and then use this information to predict, based on their DNA, whether someone had a better or worse chance of living longer than average. The DNA of over 500,000 people was read to reveal the specific ‘genetic fingerprints’ of each participant. Then, after asking each of the participants how long both of their parents had lived, Timmers et al. pinpointed 12 DNA regions that affect lifespan. Five of these regions were new and had not been linked to lifespan before. Across the twelve as a whole several were known to be involved in Alzheimer’s disease, smoking-related cancer or heart disease. Looking at the entire genome, Timmers et al. could then predict a lifespan score for each individual, and when they sorted participants into ten groups based on these scores they found that top group lived five years longer than the bottom, on average. Many factors beside genetics influence how long a person will live and our lifespan cannot be read from our DNA alone. Nevertheless, Timmers et al. had hoped to narrow down their search and discover specific genes that directly influence how quickly people age, beyond diseases. If such genes exist, their effects were too small to be detected in this study. The next step will be to expand the study to include more participants, which will hopefully pinpoint further genomic regions and help disentangle the biology of ageing and disease.


Conflict of interest statement

PT, NM, KL, KF, ZN, XF, AB, DC, XS, ZK, JW, PJ No competing interests declared, TE Reviewing Editor, eLife

Figures

Figure 1.
Figure 1.. SNP associations with lifespan across both parents under the assumption of common and sex-specific effect sizes.
Miami plot of genetic associations with joint parental survival. In purple are the associations under the assumption of common SNP effect sizes across sexes (CES); in green are the associations under the assumption of sex-specific effect sizes (SSE). P refers to the two-sided P values for association of allelic dosage on survival under the residualised Cox model. The red line represents our multiple testing-adjusted genome-wide significance threshold (p = 2.5 × 10−8). Annotated are the gene, set of genes, or cytogenetic band near the index SNP, marked in red. P values have been capped at –log10(p) = 15 to better visualise associations close to genome-wide significance. SNPs with P values beyond this cap (near APOE, CHRNA3/5 and LPA) are represented by triangles.
Figure 2.
Figure 2.. Validation of SNPs identified in other studies using independent samples of European descent.
Discovery – Candidate SNPs or proxies (r2 > 0.95) associated with lifespan (top panels, stratified by sex) and longevity (bottom panel) by previous studies (Zeng et al., 2016; Pilling et al., 2017; Deelen et al., 2014; Flachsbart et al., 2009; Sebastiani et al., 2017; Ben-Avraham et al., 2017). Effect sizes have been rescaled to years of life to make direct comparisons between studies (see Materials and methods and Figure 2—figure supplement 1). Replication – Independent samples, either the LifeGen meta-analysis to replicate Pilling et al. (2017), or the full dataset including UK Biobank. Gene names are as reported by discovery and have been coloured based on overlap between confidence intervals (CIs) of effect estimates. Dark blue – Nominal replication (p < 0.05, one-sided test). Light blue – CIs overlap (Phet > 0.05) and cover zero, but replication estimate is closer to discovery than zero. Yellow – CIs overlap (Phet > 0.05) and cover zero, and replication estimate is closer to zero than discovery. Red – CIs do not overlap (Phet < 0.05) and replication estimate covers zero. Black – no replication data.
Figure 2—figure supplement 1.
Figure 2—figure supplement 1.. Concordance between inferred effect sizes from Pilling et al. (2017) and our estimated effect sizes in a largely overlapping UK Biobank sample.
Effect estimates from Pilling et al. (2017) were converted to loge(protection ratio) based solely on the proportion dead in individual parental samples, or (for combined parents results) based on an empirical conversion factor from APOE (see Materials and methods). By definition, the inferred effect estimate for APOE in combined parents is identical between the studies; all other estimates provide a measure of concordance between inferred and calculated effects for each locus. Gene names are as reported by discovery. Note, rs161091095 near USP2–AS1 is a proxy (r2 = 1.00) for rs139137459, the SNP reported by Pilling et al. No proxies could be found for 13:31871514_T_G. Gene – Nearby gene(s) as reported by discovery. SNP – rsID of SNP or proxy. A1 – Longevity allele. Beta - the estimated loge(protection ratio) for one copy of the effect allele. CI – Confidence Interval.
Figure 3.
Figure 3.. SNP associations with lifespan across both parents when taking into account prior information on mortality risk factors.
Bayesian iGWAS was performed using observed associations from the lifespan GWAS and priors based on 16 traits selected by an AIC-based stepwise model. As the P values were assigned empirically using a permutation approach, the minimum P value is limited by the number of permutations; SNPs reaching this limit are represented by triangles. Annotated are the gene, cluster of genes, or cytogenetic band in close proximity to the top SNP. The red line represents the genome-wide significance threshold (p = 2.5 × 10−8). The blue line represents the 1% FDR threshold. Figure 3—figure supplement 1 shows the associations of each genome-wide significant SNP with the 16 risk factors.
Figure 3—figure supplement 1.
Figure 3—figure supplement 1.. Heat map of the effect of genome-wide significant iGWAS SNPs on the mortality risk factors.
We looked up the effects of lifespan protecting alleles identified by iGWAS in the consortium GWAMA for all risk factors significantly associated with lifespan in univariate analysis (for studies tested see Materials and methods). We kept all traits univariately associated with lifespan to allow for the presence of potentially correlated traits, not significant in the multivariate analysis. In the iGWAS analysis, Z-scores (estimated effect divided by standard error) are used, but for comparison purposes, standardised betas (Z-score divided by square root of the sample size) were calculated for each risk factor at every SNP and represented in this figure. Both SNPs and traits were clustered for similarity. For example, we can see that almost all iGWAS alleles identified as protective for lifespan are exhibiting negative standardized betas in the coronary artery disease (CAD) association study, confirming the hypothesis that CAD is negatively affecting lifespan. We can also notice that some SNPs are strongly associated with some risk factors (APOE and LDR with lipids traits or CDKN2B-AS1 with CAD) and likely influence lifespan through their effect on these traits. However, some other SNPs (KCNK3 and HTT for example) are showing moderate effects on several risk factors and are probably affecting lifespan through pleiotropic effects.
Figure 4.
Figure 4.. Collective replication of individual lifespan SNPs using GWAMAs for extreme long-livedness shows directional consistency in all cases.
Forest plot of effect size ratios between genome-wide significant lifespan variants from our study and external longevity studies (Broer et al., 2015; Deelen et al., 2014), having converted longevity effect sizes to our scale using APOE as benchmark (see Materials and methods and Figure 4—source data 1). Alpha – ratio of replication to discovery effect sizes on the common scale and 95% CI (reflecting uncertainty in the numerator and denominator; P values are for one-sided test). A true (rather than estimated) ratio of 1 indicates the relationship between SNP effect on lifetime hazard and extreme longevity is the same as that of APOE, while a ratio of zero suggests no effect on longevity. A true ratio between 0 and 1 suggests a stronger effect on lifetime hazard than longevity relative to APOE. SNPs overlapping both 0 and 1 are individually underpowered. The inverse variance meta-analysis of alpha over all SNPs, excluding APOE, is 0.42 (95% 0.23 to 0.61; p = 1.35 × 10–5) for Halpha = 0.
Figure 5.
Figure 5.. Age and sex specific effects on parent survival for 5 variants showing 5% FDR age- or sex-specificity of effect size from 23 lifespan-increasing variants.
(A) Variants showing age-specific effects; (B) Variants showing sex-specific effects. Panel titles show the gene, cluster of genes, or cytogenetic band in close proximity to the index lifespan variant, with this variant and lifespan-increasing allele in parentheses. Beta – loge(protection ratio) for 1 copy of effect allele in self in the age band (i.e. 2 x observed due to 50% kinship). Note the varying scale of y-axis across panels. Age range: the range of ages over which beta was estimated. Sex p – nominal P value for association of effect size with sex. Age p – nominal P value for association of effect size with age.
Figure 6.
Figure 6.. Disease loci explaining the most lifespan variance are protective for neurological disease, cardiovascular disease, and lung cancer.
SNPs reported as genome-wide significant for disease in European population studies, ordered by their lifespan variance explained (LVE), show the cumulative effect of disease SNPs on variation in lifespan. An FDR cut-off of 1.55% is applied simultaneously across all diseases, allowing for one false positive association with lifespan among the 45 independent loci. Note the log scale on the X axis. Cardiovascular disease – SNPs associated with cardiovascular disease or myocardial infarction. Alzheimer's/Parkinson's – SNPs associated with Alzheimer’s disease or Parkinson’s disease. Smoking/lung cancer – SNPs associated with smoking behaviour, chronic obstructive pulmonary disease and lung adenocarcinomas. Other cancers – SNPs associated with cancers other than lung cancer (see Figure 7—source data 1 for a full list). Type 2 diabetes – SNPs associated with type 2 diabetes.
Figure 7.
Figure 7.. Lifespan variance explained by individual genome-wide significant disease SNPs within disease categories.
Genome-wide significant disease SNPs from the GWAS catalog are plotted against the amount of lifespan variance explained (LVE), with disease-protective alleles signed positively when increasing lifespan and signed negatively when decreasing lifespan. SNPs with limited evidence of an effect on lifespan are greyed out: an FDR cut-off of 1.55% is applied simultaneously across all diseases, allowing for one false positive among all significant SNPs. Secondary pleiotropic SNPs (i.e. those associating more strongly with another one of the diseases, as assessed by PheWAS in UK Biobank) are coloured to indicate the main effect on increased lifespan seems to arise elsewhere. Of these, turquoise SNPs show one or more alternative disease associations in the same direction and at least twice as strong (double Z statistic – see Detailed Materials and methods) as the principal disease, while brown SNPs show one or more significant associations with alternative disease in the opposite direction that explains the negative association of the disease-protective SNP with lifespan. The variance explained by all SNPs in black is summed (∑LVE) by disease. Annotated are the gene, cluster of genes, or cytogenetic band near the lead SNPs. The Y axis has been capped to aid legibility of SNPs with smaller LVE: SNPs near APOE pass this cap and are represented by triangles. See Figure 7—source data 1 for the full list of disease SNP associations.
Figure 8.
Figure 8.. Survival curves for highest and lowest deciles of lifespan polygenic risk score.
A polygenic risk score was made for each subject using GWAS results that did not include the subject sets under consideration. Subject or parent survival information (age entry, age exit, age of death (if applicable) was used to create Kaplan-Meier curves for the top and bottom deciles of score. In this figure (only) no adjustment has been made for the dilution of observed effects due to parent imputation from cohort subjects. Effect sizes in parent, if parent genotypes had been used, are expected to be twice that shown. E and W – England and Wales; PRS – polygenic risk score.
Figure 8—figure supplement 1.
Figure 8—figure supplement 1.. Survival Curves for highest and lowest deciles of lifespan polygenic risk score in UK Biobank subjects.
A polygenic risk score was made for each subject using GWAS results that did not include the subject sets under consideration. Subject survival information (age entry, age exit, age of death (if applicable) was used to create Kaplan-Meier curves for the top and bottom deciles of score. The narrow range of ages and short time since inception means that UK Biobank subject curves are subject to greater uncertainty, particularly at each end, and only cover a shorter interval. E and W – England and Wales; PRS – polygenic risk score.
Figure 9.
Figure 9.. Sex and age specific effects of polygenic survival score (PRS) on parental lifespan in UK Biobank.
The effect of out-of-sample PRS on parental lifespan stratified by sex and age was estimated for Scottish and English/Welsh subsamples individually (see Figure 9—figure supplement 1) and subsequently meta-analysed. The estimate for the PRS on father lifespan in the highest age range has very wide confidence intervals (CI) due to the limited number of fathers surviving past 90 years of age. The beta 95% CI for this estimate is –0.15 to 0.57. Beta – loge(protection ratio) for one standard deviation of PRS for increased lifespan in self in the age band (i.e. 2 x observed due to 50% kinship), bounds shown are 95% CI; Age range – the range of ages over which beta was estimated; sex p – P value for association of effect size with sex; age p – P value for association of effect size with age.
Figure 9—figure supplement 1.
Figure 9—figure supplement 1.. Sex and age specific effects of polygenic survival score (PRS) on parental lifespan of Scottish and English/Welsh subsamples of UK Biobank.
(A) Out of sample Scottish subset of UK Biobank; (B) Out of sample English and Welsh subset of UK Biobank; Estimates for the PRS on father lifespan in the highest age range have very wide confidence intervals (CI) due to the limited number of fathers surviving past 90 years of age. The beta 95% CI for these estimates are 0.15 to 2.20 for Scottish subsamples and –1.34 to –0.16 for English and Welsh subsamples. Beta – loge(protection ratio) for one standard deviation of PRS for increased lifespan in self in the age band (i.e. 2 x observed due to 50% kinship), bounds shown are 95% CI; Age range – the range of ages over which beta was estimated; sex p – P value for association of effect size with sex; age p – P value for association of effect size with age.
Figure 10.
Figure 10.. Associations between polygenic lifespan score and diseases of UK Biobank subjects and their kin.
Logistic regression was performed on standardised polygenic survival score (all variants) and 21 disease traits reported by 24,059 Scottish and 29,815 English/Welsh out-of-sample individuals about themselves and their kin. For grouping of UK Biobank disease codes, see Figure 10—source data 1. Displayed here are inverse-variance meta-analysed estimates of the diseases for which multiple sources of data were available (i.e. parents and/or siblings; see Figure 10—figure supplement 1 for all associations). ‘Cancer’ is only in subjects, whilst the specific subtypes are analysed for kin. The left panel shows disease estimates for each kin separately; the right panel shows the combined estimate, with standard errors adjusted for correlation between family members. Diseases have been ordered by magnitude of effect size (combined estimate). Beta – log odds reduction ratio of disease per standard deviation of polygenic survival score, where a negative beta indicates a deleterious effect of score on disease prevalence (lifetime so far), and positive beta indicates a protective effect on disease. Effect sizes for first degree relatives have been doubled. Cancer – Binary cancer phenotype (any cancer, yes/no).
Figure 10—figure supplement 1.
Figure 10—figure supplement 1.. Associations between polygenic survival score and diseases of individuals and their kin from Scottish and English/Welsh subsamples of UK Biobank.
Logistic regression was performed on standardised polygenic survival score (all variants) and 21 traits reported by 24,059 Scottish and 29,815 English/Welsh out-of-sample individuals about themselves and their kin. Diseases have been ordered by magnitude of effect size (meta-analysed between cohorts and kin). Beta – log odds reduction ratio of disease per standard deviation of polygenic survival score, where a negative beta indicates a deleterious effect of score on disease prevalence (lifetime so far), and positive beta indicates a protective effect on disease. Effect sizes for first degree relative have been doubled. Cancer – Binary cancer phenotype (yes/no), FRP – Female Reproductive Problems, MS – Multiple Sclerosis, PAD – Peripheral Artery Disease.

References

    1. Association of British Insurers and UK Government . Concordat and Moratorium on Genetics and Insurance. ABI; 2014.
    1. Battle A, Brown CD, Engelhardt BE, Montgomery SB, GTEx ConsortiumLaboratory, Data Analysis &Coordinating Center (LDACC)—Analysis Working GroupStatistical Methods groups—Analysis Working GroupEnhancing GTEx (eGTEx) groupsNIH Common FundNIH/NCINIH/NHGRINIH/NIMHNIH/NIDABiospecimen Collection Source Site—NDRIBiospecimen Collection Source Site—RPCIBiospecimen Core Resource—VARIBrain Bank Repository—University of Miami Brain Endowment BankLeidos Biomedical—Project ManagementELSI StudyGenome Browser Data Integration &Visualization—EBIGenome Browser Data Integration &Visualization—UCSC Genomics Institute, University of California Santa CruzLead analysts:Laboratory, Data Analysis &Coordinating Center (LDACC):NIH program management:Biospecimen collection:Pathology:eQTL manuscript working group: Laboratory, Data Analysis &Coordinating Center (LDACC)—Analysis Working Group. Statistical Methods groups—Analysis Working Group. Enhancing GTEx (eGTEx) groups. NIH Common Fund. NIH/NCI. NIH/NHGRI. NIH/NIMH. NIH/NIDA. Biospecimen Collection Source Site—NDRI. Biospecimen Collection Source Site—RPCI. Biospecimen Core Resource—VARI. Brain Bank Repository—University of Miami Brain Endowment Bank. Leidos Biomedical—Project Management. ELSI Study. Genome Browser Data Integration &Visualization—EBI. Genome Browser Data Integration &Visualization—UCSC Genomics Institute, University of California Santa Cruz. Lead analysts: Laboratory, Data Analysis &Coordinating Center (LDACC): NIH program management: Biospecimen collection: Pathology: eQTL manuscript working group: Genetic effects on gene expression across human tissues. Nature. 2017;550:204. doi: 10.1038/nature24277. - DOI - PMC - PubMed
    1. Beekman M, Blanché H, Perola M, Hervonen A, Bezrukov V, Sikora E, Flachsbart F, Christiansen L, De Craen AJ, Kirkwood TB, Rea IM, Poulain M, Robine JM, Valensin S, Stazi MA, Passarino G, Deiana L, Gonos ES, Paternoster L, Sørensen TI, Tan Q, Helmer Q, van den Akker EB, Deelen J, Martella F, Cordell HJ, Ayers KL, Vaupel JW, Törnwall O, Johnson TE, Schreiber S, Lathrop M, Skytthe A, Westendorp RG, Christensen K, Gampe J, Nebel A, Houwing-Duistermaat JJ, Slagboom PE, Franceschi C, GEHA consortium Genome-wide linkage analysis for human longevity: genetics of healthy aging study. Aging Cell. 2013;12:184–193. doi: 10.1111/acel.12039. - DOI - PMC - PubMed
    1. Ben-Avraham D, Govindaraju DR, Budagov T, Fradin D, Durda P, Liu B, Ott S, Gutman D, Sharvit L, Kaplan R, Bougnères P, Reiner A, Shuldiner AR, Cohen P, Barzilai N, Atzmon G. The GH receptor exon 3 deletion is a marker of male-specific exceptional longevity associated with increased GH sensitivity and taller stature. Science Advances. 2017;3:e1602025. doi: 10.1126/sciadv.1602025. - DOI - PMC - PubMed
    1. Broer L, Buchman AS, Deelen J, Evans DS, Faul JD, Lunetta KL, Sebastiani P, Smith JA, Smith AV, Tanaka T, Yu L, Arnold AM, Aspelund T, Benjamin EJ, De Jager PL, Eirkisdottir G, Evans DA, Garcia ME, Hofman A, Kaplan RC, Kardia SLR, Kiel DP, Oostra BA, Orwoll ES, Parimi N, Psaty BM, Rivadeneira F, Rotter JI, Seshadri S, Singleton A, Tiemeier H, Uitterlinden AG, Zhao W, Bandinelli S, Bennett DA, Ferrucci L, Gudnason V, Harris TB, Karasik D, Launer LJ, Perls TT, Slagboom PE, Tranah GJ, Weir DR, Newman AB, van Duijn CM, Murabito JM. GWAS of longevity in CHARGE consortium confirms APOE and FOXO3 candidacy. The Journals of Gerontology: Series A. 2015;70:110–118. doi: 10.1093/gerona/glu166. - DOI - PMC - PubMed

Publication types