

Weighting Nonprobability and Probability Sample Surveys in Describing Cancer Catchment Areas
- PMID: 30642842
- PMCID: PMC6401258
- DOI: 10.1158/1055-9965.EPI-18-0797
Weighting Nonprobability and Probability Sample Surveys in Describing Cancer Catchment Areas
Abstract
Background: The Population Health Assessment initiative by NCI sought to enhance cancer centers' capacity to acquire, aggregate, and integrate data from multiple sources, as well as to plan, coordinate, and enhance catchment area analysis activities.
Methods: Key objectives of this initiative are pooling data and comparing local data with national data. A novel aspect of analyzing data from this initiative is the methodology used to weight datasets from sites that collected both probability and nonprobability samples. This article describes the methods developed to weight data, which cancer centers collected with combinations of probability, and nonprobability sampling designs.
Results: We compare alternative weighting methods in particular for the hybrid probability and nonprobability sampling designs employed by different cancer centers. We also include comparisons of local center data with national survey data from large probability samples.
Conclusions: This hybrid approach to calculating statistical weights can be implemented both within cancer centers that collect both probability and nonprobability samples with common measures. Aggregation can also apply to cancer centers that share common data elements, and target similar populations, but differ in survey sampling designs.
Impact: Researchers interested in local versus national comparisons for cancer surveillance and control outcomes should consider various weighting approaches, including hybrid approaches, when analyzing their data.
©2019 American Association for Cancer Research.
Conflict of interest statement
Conflict of Interest: The authors declare no potential conflicts of interest.
Figures
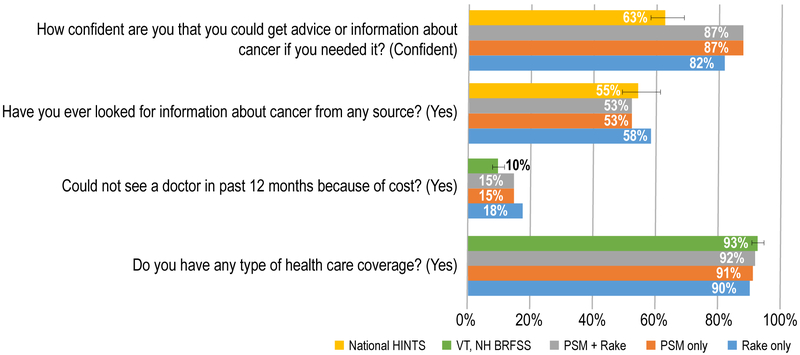
National HINTS: Gold: 255/192/0
PSM+ Rake: Gray: 165/165/165
PSM Only: Orange: 237/125/49
Rake Only: Light Blue: 91/155/213
VT, NH BRFSS: Green: 112/173/71
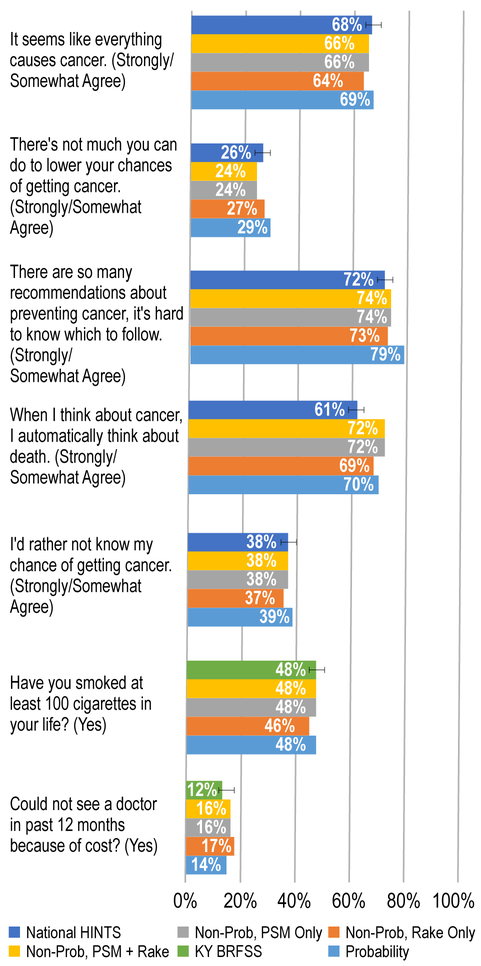
National HINTS: Dark Blue: 68/114/196
NonProb, PSM + Rake: Gold: 255/192/0
NonProb, PSM Only: Gray: 165/165/165
NonProb, Rake Only: Orange: 237/125/49
Probability: Light Blue: 91/155/213
KY BRFSS: Green: 112/173/71
References
-
- Observational Health Data Sciences and Informatics (2018). “Data Standardization”. https://www.ohdsi.org/data-standardization/. Last accessed on July 14, 2018.
-
- University of Michigan (2018). “Data Sharing for Demographic Research.” https://www.icpsr.umich.edu/icpsrweb/content/DSDR/harmonization.html. Last accessed on July 14, 2018.
-
- Angrisani M, Lee J (2012). Harmonization of Cross-National Studies of Aging to the Health and Retirement Study: Income Measures. RAND Corporation Working Papers.
-
- Iachan R, Lu B, & Duffy T (2009, August). A comparison of imputation methods used in the Ohio Family Health Survey. Paper presented at the American Statistical Association meeting, Denver, CO.
Publication types
MeSH terms
Grants and funding
LinkOut - more resources
Full Text Sources
