. 2019 Jan 14;8(1):bio038299.
doi: 10.1242/bio.038299.

Local deformation and stiffness distribution in fly wings

Affiliations

Local deformation and stiffness distribution in fly wings

Henja-Niniane Wehmann et al. Biol Open. .

Abstract

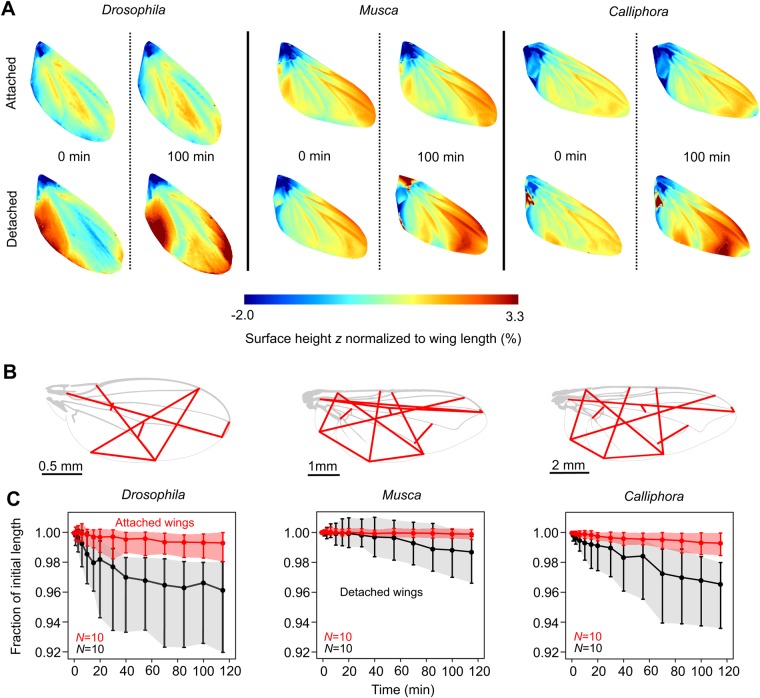
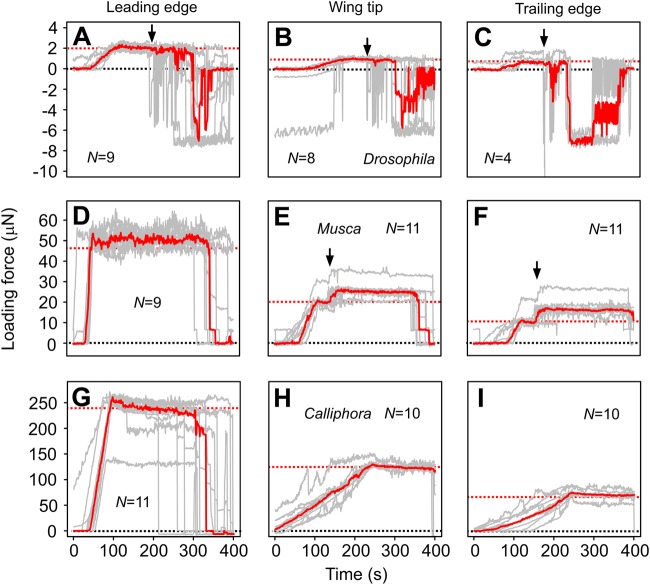
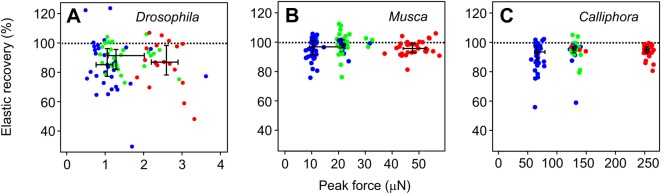
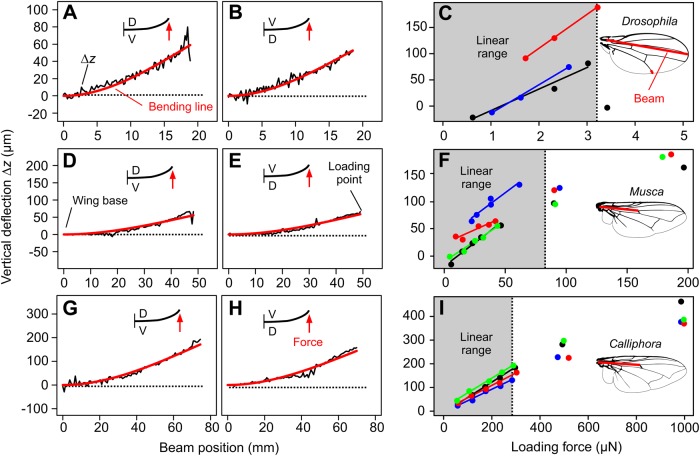
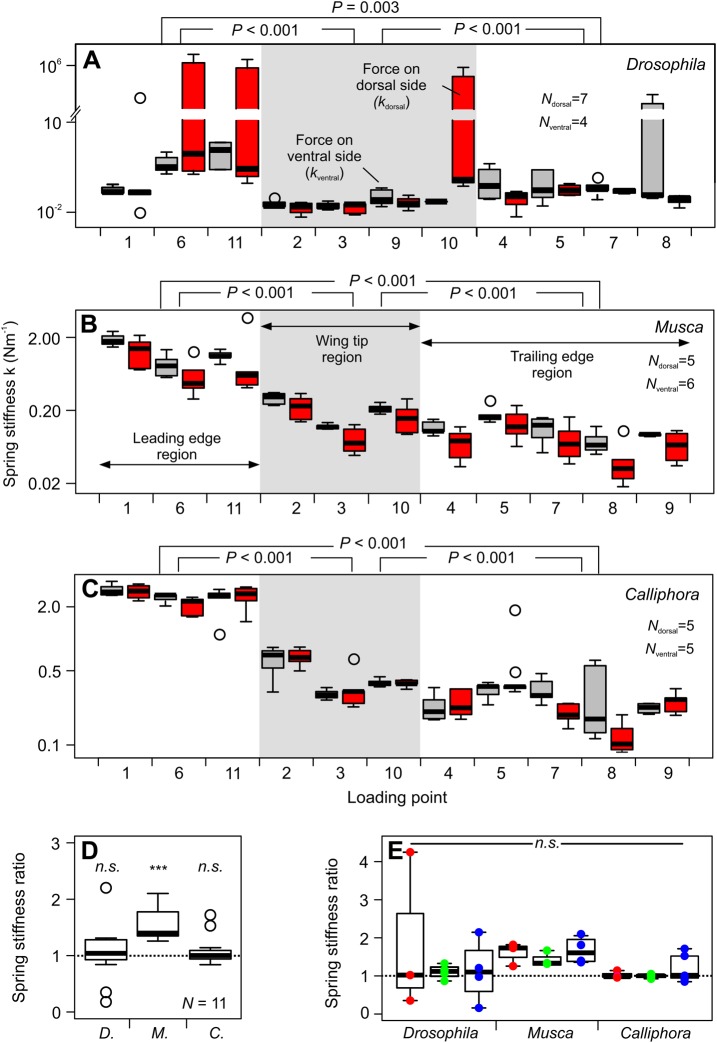
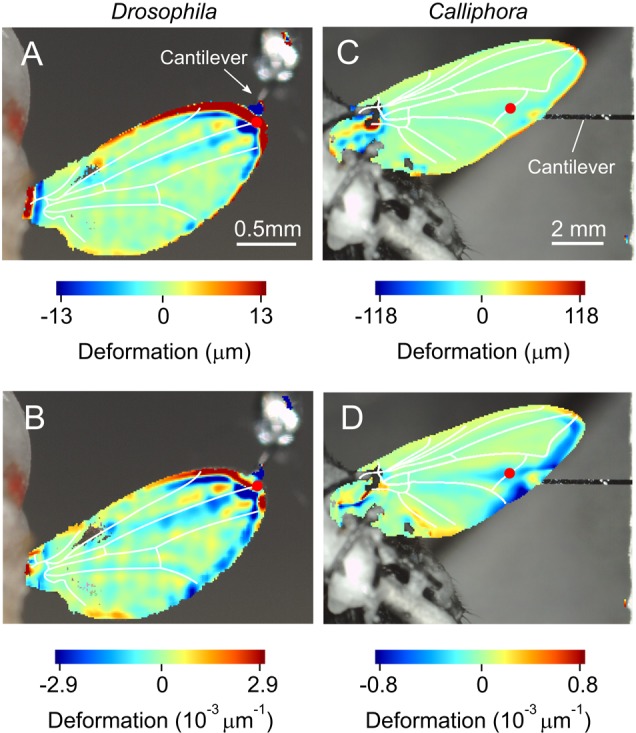
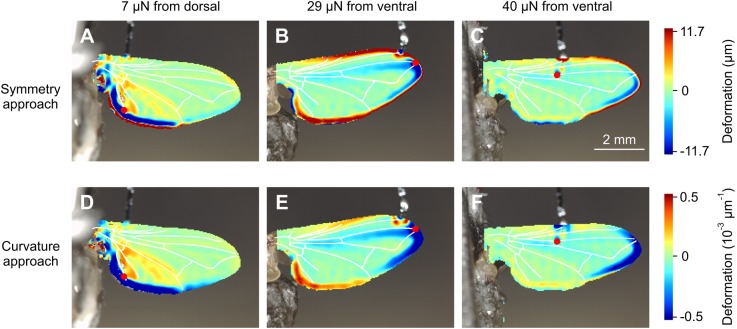
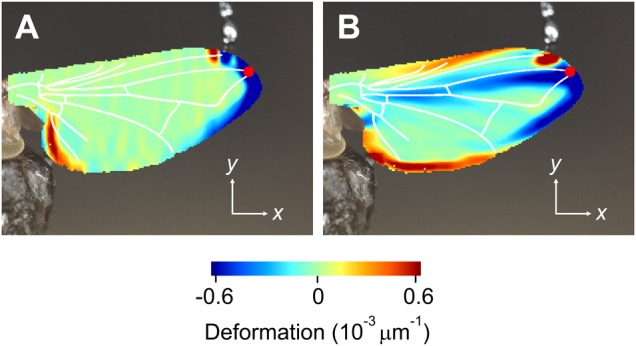
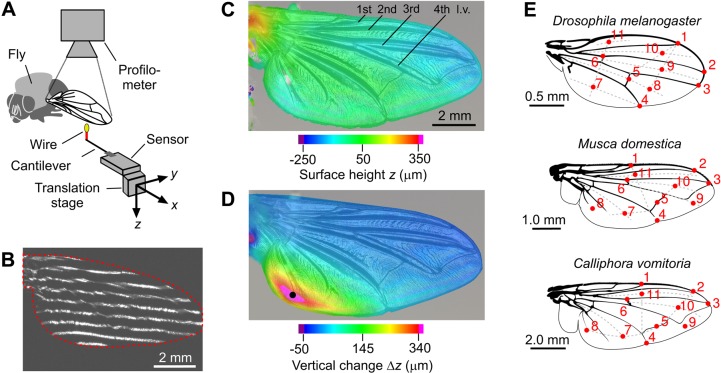
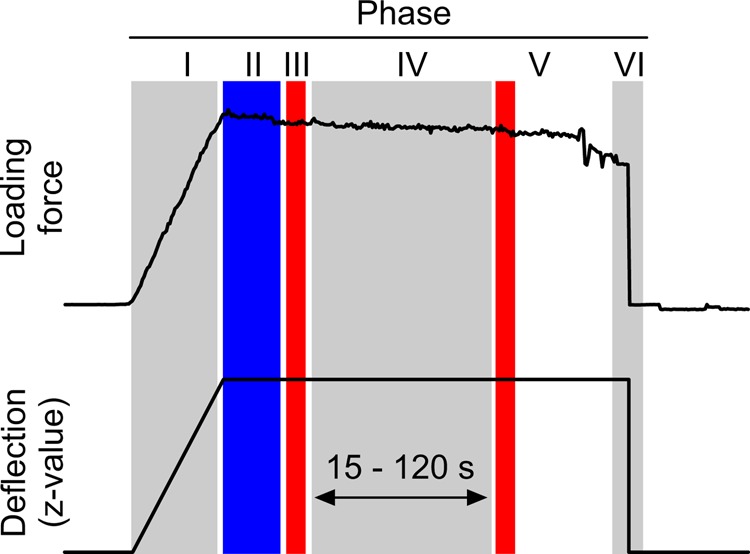
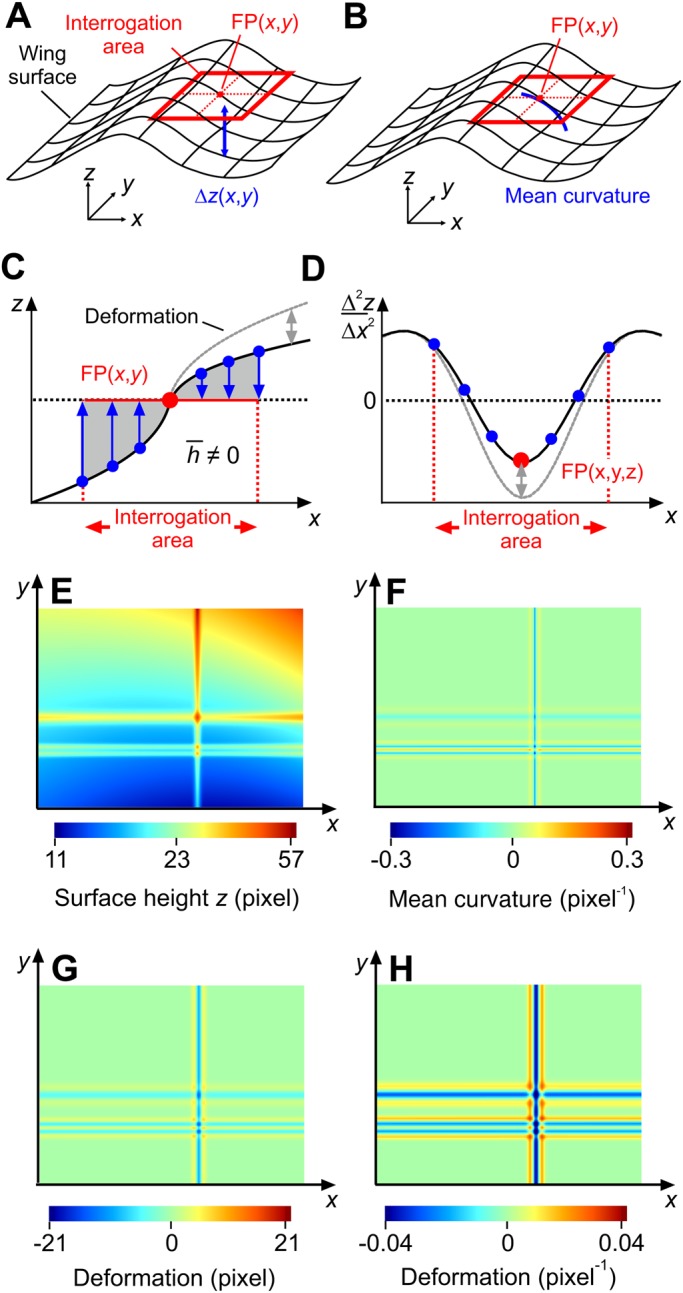
Mechanical properties of insect wings are essential for insect flight aerodynamics. During wing flapping, wings may undergo tremendous deformations, depending on the wings' spatial stiffness distribution. We here show an experimental evaluation of wing stiffness in three species of flies using a micro-force probe and an imaging method for wing surface reconstruction. Vertical deflection in response to point loads at 11 characteristic points on the wing surface reveals that average spring stiffness of bending lines between wing hinge and point loads varies ∼77-fold in small fruit flies and up to ∼28-fold in large blowflies. The latter result suggests that local wing deformation depends to a considerable degree on how inertial and aerodynamic forces are distributed on the wing surface during wing flapping. Stiffness increases with an increasing body mass, amounting to ∼0.6 Nm-1 in fruit flies, ∼0.7 Nm-1 in house flies and ∼2.6 Nm-1 in blowflies for bending lines, running from the wing base to areas near the center of aerodynamic pressure. Wings of house flies have a ∼1.4-fold anisotropy in mean stiffness for ventral versus dorsal loading, while anisotropy is absent in fruit flies and blowflies. We present two numerical methods for calculation of local surface deformation based on surface symmetry and wing curvature. These data demonstrate spatial deformation patterns under load and highlight how veins subdivide wings into functional areas. Our results on wings of living animals differ from previous experiments on detached, desiccated wings and help to construct more realistic mechanical models for testing the aerodynamic consequences of specific wing deformations.

Keywords: Calliphora; Drosophila; Flight; Insect; Musca; Stiffness scaling; Wing mechanics; Wing stiffness.


Conflict of interest statement

Competing interestsThe authors declare no competing or financial interests.

Figures

Fig. 1.
Fig. 1.
Wing surface changes during desiccation. (A) Initial surface height values (z-values) and after 100 min in wings attached to intact, living animals (upper row) and detached wings (lower row). Surface values are normalized to wing length i.e. ∼2.15 mm in Drosophila, ∼6.28 mm in Musca and ∼9.29 mm in Calliphora (Table 1). (B) Lines (red) for estimation of wing deformation during desiccation. Wing images are captured by a photo camera from the top. (C) Mean relative length change of lines in B in detached wings (black) and wings of intact animals (red). Data are medians and shaded areas indicate lower and upper quartiles. N, number of tested flies.
Fig. 2.
Fig. 2.
Dynamics of the wing deformation in response to force loading and unloading. Force-time curves during dynamic loading experiments in Drosophila (A–C), Musca (D–F) and Calliphora wings (G–I). Wings are loaded at point 1 (wing leading edge; A,D,G), point 3 (wing tip; B,E,H) and point 7 (all species, wing trailing edge; C,F,I). Single runs are shown in gray, medians of all runs in red. Red dashed lines indicate desired load at which sensor movement approximately stops. Arrows indicate onset of visual patterns projected on the wing during profilometer measurements. Under the latter conditions, force may increase presumably owing to some thermal drift of the sensor during the surface scan. N, number of tested flies.
Fig. 3.
Fig. 3.
Recovery of elastic potential energy (elastic recovery) during wing loading. The measure was calculated from the ratio between maximum forces at stimulus phase I and mean force of phase II (see Materials and Methods) in the three tested species. Colors indicate measurements in three regions of the wing. Red, leading wing edge area (N=18 in A, N=29 in B, N=31 in C); green, wing tip area (N=24 in A, N=33 in B, N=27 in C); blue, trailing wing edge area (N=36 in A, N=54 in B, N=48 in C). N, number of tested animals. Medians, lower- and upper quartiles are shown in black.
Fig. 4.
Fig. 4.
Determination of spring stiffness using beam theory. (A,B,D,E,G,H) Difference in vertical wing deflection Δz (loaded-minus-unloaded condition) along a bending line from the wing base to wing tip in Drosophila (A–C) and wing base to anterior cross vein in Musca (D–F) and Calliphora (G–I). Best fit bending line from beam theory is shown in red. Insets show direction of force application. D, dorsal; V, ventral wing side. (C,F,I) Vertical deflection in the dorsal direction during wing loading at the end of the third longitudinal vein (load point 2) in C and at the anterior cross vein (load point 6) in F and I. Dashed line indicates 25% body weight in Drosophila and 50% weight in Musca and Calliphora (cf. Table 1). Colored data are single animals and insets show beam in red.
Fig. 5.
Fig. 5.
Wing spring stiffness along various bending lines and anisotropy. (A–C) Stiffness was calculated along bending lines from the wing base to the various load points. See Table 2 for site-specific target force. Loading forces are applied on the wing’s ventral (gray) and dorsal (red) side. Load points are grouped into three major wing regions (see Materials and Methods). (D) Anisotropy for all loaded points calculated from the ratio in spring stiffness (kventral/kdorsal) derived from loading the ventral (kventral) and dorsal wing side (kdorsal, N=11 load points). (E) Anisotropy of three wing regions (red, leading wing edge region, N=3 flies, all species); green, wing tip region, N=4 Drosophila, N=3 Musca, N=3 Calliphora; blue, trailing edge region, N=4 Drosophila, N=5 Musca, N=5 Calliphora, see Materials and Methods. All data are boxplots with medians and upper and lower quartiles. Open circles are outliers. ***P<0.001; n.s., not significant. D., Drosophila; M., Musca; C., Calliphora.
Fig. 6.
Fig. 6.
Local wing deformation derived from two types of analyses (top view on ventral wing surface). (A,B) Wing is deformed by application of 1.0 μN on the dorsal wing surface at the end of the third longitudinal vein in a single Drosophila. (C,D) Images show wing deformation in response to a 138 μN load on the dorsal anterior cross vein in a single Calliphora. Deformation was estimated using spatial symmetry approach in A and C and spatial curvature approach in B and D. Forces of 1.0 μN and 138 μN correspond to ∼6% and ∼24% mean body mass, respectively (Table 1). Note the different units of the two methods. Red dots show force load points. Wing veins (white) are superimposed for clarity.
Fig. 7.
Fig. 7.
Local wing deformation at various forces and load points in Musca. Data show local wing deformation in response to (A,D) 7.0 μN load on the dorsal wing side, (B,E) 29 μN on the ventral side and (C,F) 40 μN on the ventral side (top view on ventral side in A,D and dorsal side in B,E,C,F). The latter values correspond to ∼4%, ∼18% and ∼25% mean body weight of this species. Deformation has been calculated using spatial symmetry (upper row) and spatial curvature approach (lower row). Wing veins are superimposed in white. Load points are shown in red.
Fig. 8.
Fig. 8.
Wing deformation in Musca. Data show deformation in (A) x-direction (along span) and (B) y-direction (along chord) of the wing in Fig. 7E. Colors show deformation (spatial curvature approach) at the dorsal wing side. See legend of Fig. 7 for more details.
Fig. 9.
Fig. 9.
Experimental setup and load points. (A) Fly wings of intact animals are positioned below an optical profilometer. A force sensor is mounted to micro-translation stage. A wire (red) is attached to the sensor's cantilever and painted with fluorescent dye (yellow). (B) Example of a video image showing a visual line pattern of the profilometer on the wing during surface scanning (wing shape, red). (C) Surface scan result of an unloaded wing and (D) the changes in vertical deflection (Δz) in response to a 7.0 μN point load at point 8 (black dot, Musca, top view on ventral side). Positive (red, higher) and negative (blue, lower) z-values indicate vertical positions with respect to a horizontal mean. (E) Load sites during force application. Dots indicate load sites on both dorsal and ventral wing surfaces. When loading the dorsal surface, the ventral side of the wing was up and vice versa. Location of points at membrane areas are supported by imaginary auxiliary lines (dotted). l.v., longitudinal vein.
Fig. 10.
Fig. 10.
Force-time and deflection-time curves obtained from force measurements and motor motion, respectively. The sensor exerts a load while moving against the wing surface (phase I). During phase II, the sensor does not move and at phase III five force values are measured. At phase IV, the profilometer light is switched on and the wing surface is scanned. Profilometer readings stop and post-measurement forces are recorded at phase V. Sensor moves back and releases the wing surface at phase VI. Typical measurement time for the entire procedure was 90–120 s.
Fig. 11.
Fig. 11.
Deformation analyses of wing surface. 3-dimensional schematics of (A,C) spatial symmetry and (B,D) spatial curvature approach. Image size is 768×1024 pixels. z, vertical deflection; FP, focal point. See text for more information. Deformation (gray) is shown in 2 dimensions in C and D for clarity. (E) Color-coded surface height (z-values) produced by the test function that is specified in the Supplementary methods (Table S1). (F) Deformation is calculated as mean surface curvature from derivatives (Eqn 7) of the test function (not the data). Deformation estimates using the test data in E (not the function) are shown in (G) based on the spatial symmetry approach and in (H) the spatial curvature approach.

References

    1. Appel E. and Gorb S. N. (2011). Resilin-bearing wing vein joints in the dragonfly Epiophlebia superstes. Bioinspir. Biomim. 6, 046006 10.1088/1748-3182/6/4/046006 - DOI - PubMed
    1. Appel E., Heepe L., Lin C.-P. and Gorb S. N. (2015). Ultrastructure of dragonfly wing veins: composite structure of fibrous material supplemented by resilin. J. Anat. 227, 561-582. 10.1111/joa.12362 - DOI - PMC - PubMed
    1. Bontemps A., Vanneste T., Paquet J.-B., Dietsch T., Grondel S. and Cattan E. (2012). Design and performance of an insect-inspired nano air vehicle. Smart Mat. Struct. 22, 014008 10.1088/0964-1726/22/1/014008 - DOI
    1. Brodsky A. K. (1994). The Evolution of Insect Flight. New York: Oxford University Press.
    1. Chakroborty N. K., Menzel R. and Schubert M. (2016). Environment-specific modulation of odorant representations in the honeybee brain. Eur. J. Neurosci. 44, 3080-3093. 10.1111/ejn.13438 - DOI - PubMed

LinkOut - more resources