. 2019 Feb 4;216(2):294-303.
doi: 10.1084/jem.20181040. Epub 2019 Jan 14.

Gene therapy targeting SARM1 blocks pathological axon degeneration in mice

Affiliations

Gene therapy targeting SARM1 blocks pathological axon degeneration in mice

Stefanie Geisler et al. J Exp Med. .

Abstract

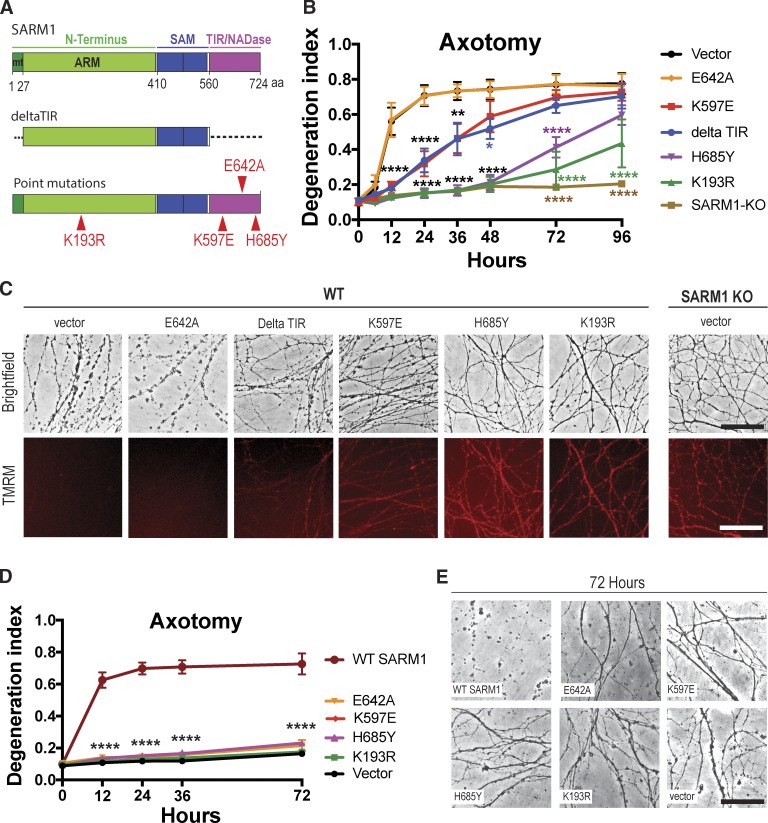
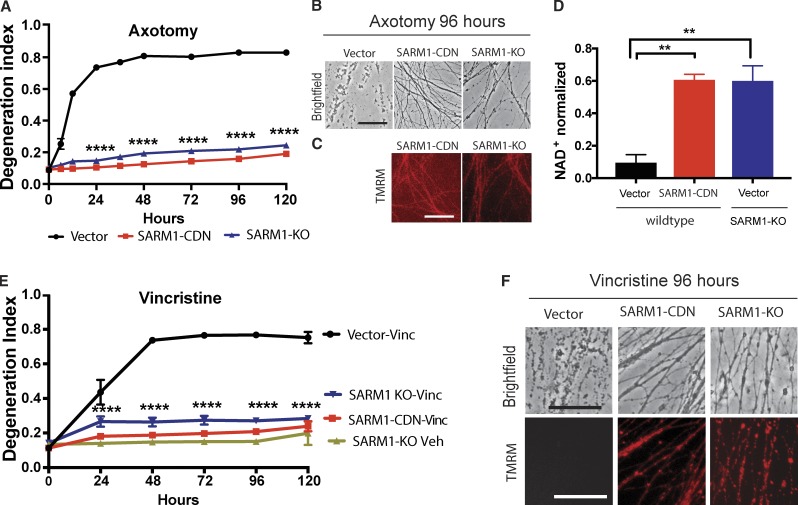
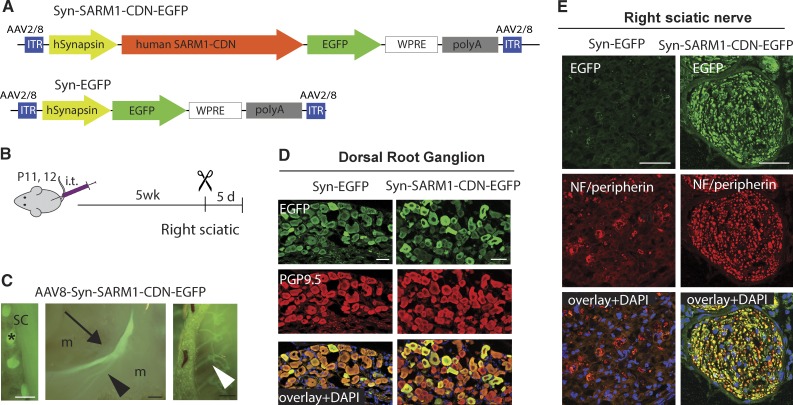
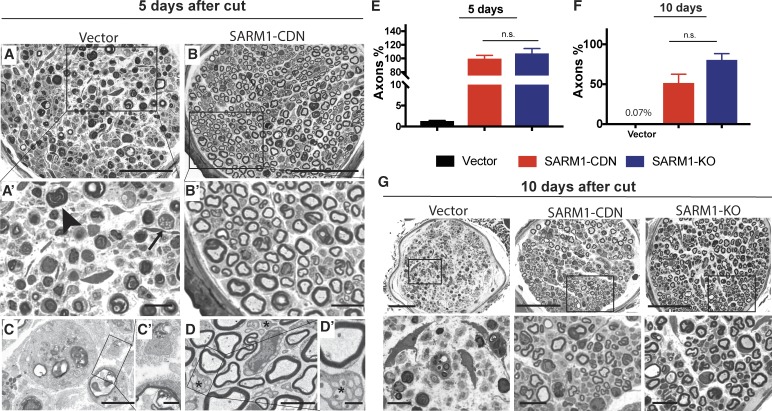
Axonal degeneration (AxD) following nerve injury, chemotherapy, and in several neurological disorders is an active process driven by SARM1, an injury-activated NADase. Axons of SARM1-null mice exhibit greatly delayed AxD after transection and in models of neurological disease, suggesting that inhibiting SARM1 is a promising strategy to reduce pathological AxD. Unfortunately, no drugs exist to target SARM1. We, therefore, developed SARM1 dominant-negatives that potently block AxD in cellular models of axotomy and neuropathy. To assess efficacy in vivo, we used adeno-associated virus-mediated expression of the most potent SARM1 dominant-negative and nerve transection as a model of severe AxD. While axons of vehicle-treated mice degenerate rapidly, axons of mice expressing SARM1 dominant-negative can remain intact for >10 d after transection, similar to the protection observed in SARM1-null mice. We thus developed a novel in vivo gene therapeutic to block pathological axon degeneration by inhibiting SARM1, an approach that may be applied clinically to treat manifold neurodegenerative diseases characterized by axon loss.


Figures

Figure 1.
Figure 1.
Identification of SARM1 dominant-negative transgenes. (A) Schematic representation of the domain structure of human SARM1. Individual point mutations are indicated by red triangles. Dotted segments indicate deleted regions. deltaTIR, aa 1–27 and 560–724 deleted; mt, mitochondrial binding sequence; ARM, HEAT/Armadillo motif; SAM, sterile α motif. (B) Axons of wild-type DRG neurons expressing the indicated constructs or axons of SARM1-KO DRG neurons expressing EGFP vector were transected and imaged using high-throughput automated imaging at indicated time points. AxD was quantified using a DI, which ranges from 0 (perfectly intact) to 1 (perfectly fragmented). Shown are means ± SE (SEM) of three independent experiments. Data were tested with a two-way ANOVA showing significant main effects of groups F(6,14) = 25.57; P < 0.0001; time, F(7,98) = 138, P < 0.0001; and interaction F(42, 98) = 8.809; P < 0.0001; post hoc Dunnett’s multiple comparison test; ****, P = 0.0001; vector versus deltaTIR, **, P = 0.0013; *, P = 0.0122; vector versus K597E, **, P = 0.0015. (C) Top: Representative brightfield micrographs of wild-type axons expressing indicated constructs or SARM1-KO axons taken 24 h after transection. Bottom: The mitochondrial potential was monitored with red fluorescent TMRM in the same axons as shown in the row above. Upon loss of mitochondrial membrane potential, the red fluorescent signal disappears. (D) Axons of SARM1-KO neurons expressing either enzymatically active, wild-type SARM1 or indicated constructs were transected, and AxD was determined over time. Data are presented as mean ± SEM. Two-way ANOVA shows significant main effect of groups F(5,12) = 122.5, P < 0.0001; time (F4,48) = 124, P < 0.001, and interaction F(20,48) = 38.94, P < 0.0001; Dunnett’s multiple comparison; ****, P = 0.0001; n = 3 independent experiments; four wells averaged per experiment. (E) Representative brightfield images of SARM1-KO axons expressing constructs indicated in D, at 72 h after cut. Bars, 50 µm (C and E).
Figure 2.
Figure 2.
SARM1-CDN potently inhibits wild-type SARM1 function. (A) Degeneration of wild-type DRG neurons expressing EGFP vector or the SARM1-CDN and of SARM1 KO neurons expressing EGFP vector after transection. DI ranges from 0 (completely intact) to 1 (completely fragmented). Data are presented as mean ± SEM, tested with a two-way ANOVA, which shows significant main effects of group F(2,9) = 2,710, P < 0.0001; time (F8,72) = 298.7, P < 0.0001, and interaction F(16,72) = 154, P < 0.0001. Dunnett’s multiple comparison test vector versus SARM1-CDN and SARM1-KO, ****, P = 0.0001. (B and C) Representative brightfield (B) and TMRM (C) images of axons expressing constructs indicated in A, at 96 h after axotomy. (D) HPLC was used to measure NAD+ levels in wild-type and SARM1-KO neurons expressing EGFP vector or SARM1-CDN from axon extracts 4 h after transection and normalized to baseline (immediately after cut). A one-way ANOVA shows a significant main effect F(2,6) = 20.01, P = 0.0022; post hoc Tukey’s multiple comparison test shows vector versus SARM1-CDN, **, P = 0.0036; vector versus SARM1-KO, **, P = 0.0039; SARM1-KO versus SARM1-CDN, P = 0.9969. n = 3 independent experiments. (E) Wild-type DRG neurons expressing EGFP vector or SARM1-CDN and SARM1-KO neurons were treated with 40 nM vincristine or vehicle and AxD determined using the DI. Data are represented as means ± SEM; two-way ANOVA shows significant main effect of groups F(3,8) = 259.6; P < 0.0001; time F(5,40) = 89.28, P < 0.0001; and interaction F(15,40) = 38.59; P < 0.0001; post hoc Dunnett’s multiple comparison test shows wild-type vector vincristine versus SARM1-CDN vincristine, SARM1-KO vincristine, and SARM1-KO vehicle, ****, P = 0.0001; n = 3 independent experiments. (F) Representative brightfield (top row) and TMRM (bottom row) images of the constructs indicated in D, at 96 h after vincristine administration. Bars, 50 µm.
Figure 3.
Figure 3.
SARM1-CDN efficiently transduces DRGs in vivo and protects from AxD. (A) Top: Schematic of the AAV vector expressing human SARM1-CDN under control of the neuron-specific human synapsin promoter (Syn-SARM1-CDN-EGFP). Bottom: Schematic of the EGFP vector (Syn-EGFP) used for control experiments. WPRE, woodchuck hepatitis virus posttranscriptional regulatory element; ITR, inverted terminal repeats. (B) AAV8-Syn-SARM1-CDN-EGFP or EGFP vector (AAV8-Syn-EGFP) were injected intrathecally (i.t.) into mice at postnatal day 11 or 12 (P11/12). 5 wk later, the right sciatic nerve was transected, and 5 d later, tissue was collected for analysis. (C) Representative micrographs taken in situ of (from left to right) DRGs (asterisk) attached to the spinal cord (SC), the left (uninjured) sciatic nerve (arrow) with its branches (arrowheads), and intercostal nerves (white arrowhead) expressing GFP 5.5 wk after injection with AAV8-Syn-SARM1-CDN-EGFP; m, muscle. Bars, 2 mm. (D) Representative confocal image of a 6-µm-thick section of a DRG after injecting EGFP vector (left column; Syn-EGFP) or SARM1-CDN (right column; Syn-SARM1-DN-EGFP). Sections were stained with PGP9.5 (red; DRG neurons) and anti-GFP (green; construct expression) and coverslipped with Vectamount containing DAPI (blue; nuclear marker). (E) Representative confocal image of a 6-µm-thick section of the right (transected) sciatic nerve taken 5 d after cut in mice injected with the EGFP vector (left column; Syn-EGFP) or SARM1-CDN (right column; Syn-SARM1-CDN-EGFP). Sections were stained with antibodies to Neurofilament 200 (NF) and peripherin (red; axonal markers) and green fluorescent protein (green; construct expression) and mounted with Vectashield containing DAPI (blue; nuclear marker). Bars, 50 µm (D and E).
Figure 4.
Figure 4.
SARM1-CDN protects from AxD in vivo with efficacy similar to SARM1-KO. (A and B) Representative photomicrographs of toluidine blue–stained semithin cross sections of the right sural nerve 5 d after transection of the sciatic nerve in mice injected with vector (A; n = 4) or SARM1-CDN (B; n = 5). A′ and B′ show enlargements of areas indicated by rectangles in A and B. The arrow and arrowhead indicate lipid-laden histiocytes and myelin debris, respectively. (C and D) Representative electron micrographs of the right sural nerve of a mouse injected with EGFP vector showing complete loss of internal nerve architecture (C) whereas unmyelinated (asterisks) and myelinated axons are preserved after SARM1-CDN injection (D). C′ and D′ show enlargements of areas indicated by rectangles in C and D. (E and F) All axons in cross sections of the entire sural nerve were counted in wild-type mice injected with vector (n = 4 in E; n = 3 in F) or SARM1-CDN (n = 5 in E, n = 3 in F) or in SARM1-KO mice (n = 5 in E and F) and expressed as percentage of axon numbers of the respective intact contralateral sides at 5 (E) and 10 (F) d after transection. Data are presented as mean ± SE (SEM), tested with a one-way ANOVA, which shows significant main effects in E (F(2,11) = 97.13, P < 0.0001; post hoc Tukey’s multiple comparison test shows vector versus SARM1-SARM1-CDN, ****, P < 0.0001; vector versus SARM1-KO, ****, P < 0.0001; SARM1-CDN versus SARM1-KO, P = 0.5953) and F (F(2,8) = 20.73; P = 0.0007; Tukey’s multiple comparison test shows vector versus SARM1-CDN, **, P = 0.0077; vector versus SARM1-KO, ***, P = 0.0005; SARM1-CDN versus SARM1-KO, P = 0.2543). n.s., not significant. (G) Representative micrographs of toluidine blue–stained sections of the sural nerve 10 d after cut. Bottom row displays enlargements of indicated areas in the images above. Bars, 50 µm (A and B), 10 µm (A′ and B′), 5 µm (C and D), 1 µm (C′ and D′), 50 µm (G, top), and 10 µm (G, bottom).

References

    1. Araki T., Sasaki Y., and Milbrandt J.. 2004. Increased nuclear NAD biosynthesis and SIRT1 activation prevent axonal degeneration. Science. 305:1010–1013. 10.1126/science.1098014 - DOI - PubMed
    1. Burke R.E., and O’Malley K.. 2013. Axon degeneration in Parkinson’s disease. Exp. Neurol. 246:72–83. 10.1016/j.expneurol.2012.01.011 - DOI - PMC - PubMed
    1. Caminiti S.P., Presotto L., Baroncini D., Garibotto V., Moresco R.M., Gianolli L., Volonté M.A., Antonini A., and Perani D.. 2017. Axonal damage and loss of connectivity in nigrostriatal and mesolimbic dopamine pathways in early Parkinson’s disease. Neuroimage Clin. 14:734–740. 10.1016/j.nicl.2017.03.011 - DOI - PMC - PubMed
    1. Cashman C.R., and Höke A.. 2015. Mechanisms of distal axonal degeneration in peripheral neuropathies. Neurosci. Lett. 596:33–50. 10.1016/j.neulet.2015.01.048 - DOI - PMC - PubMed
    1. Conforti L., Gilley J., and Coleman M.P.. 2014. Wallerian degeneration: an emerging axon death pathway linking injury and disease. Nat. Rev. Neurosci. 15:394–409. 10.1038/nrn3680 - DOI - PubMed

Publication types

MeSH terms