. 2019 Mar;179(3):1001-1012.
doi: 10.1104/pp.18.01218. Epub 2019 Jan 14.

Split-TALE: A TALE-Based Two-Component System for Synthetic Biology Applications in Planta

Affiliations

Split-TALE: A TALE-Based Two-Component System for Synthetic Biology Applications in Planta

Tom Schreiber et al. Plant Physiol. 2019 Mar.

Abstract

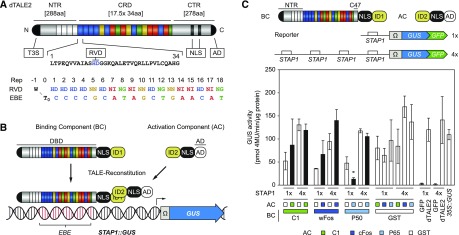
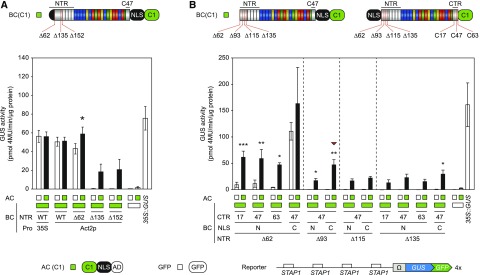
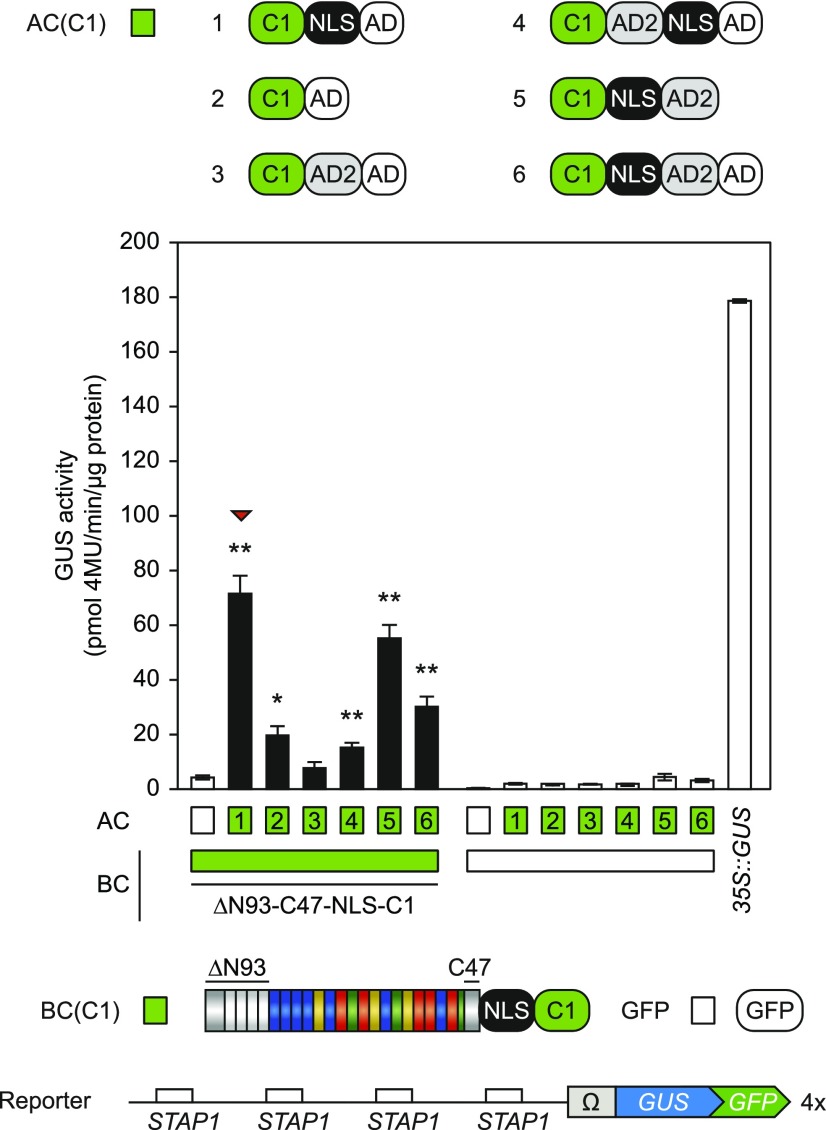
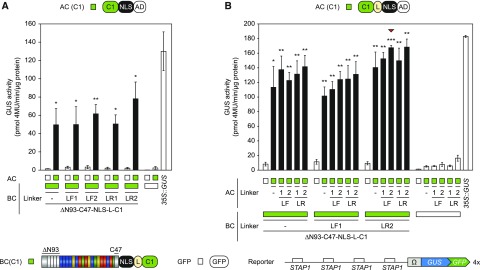
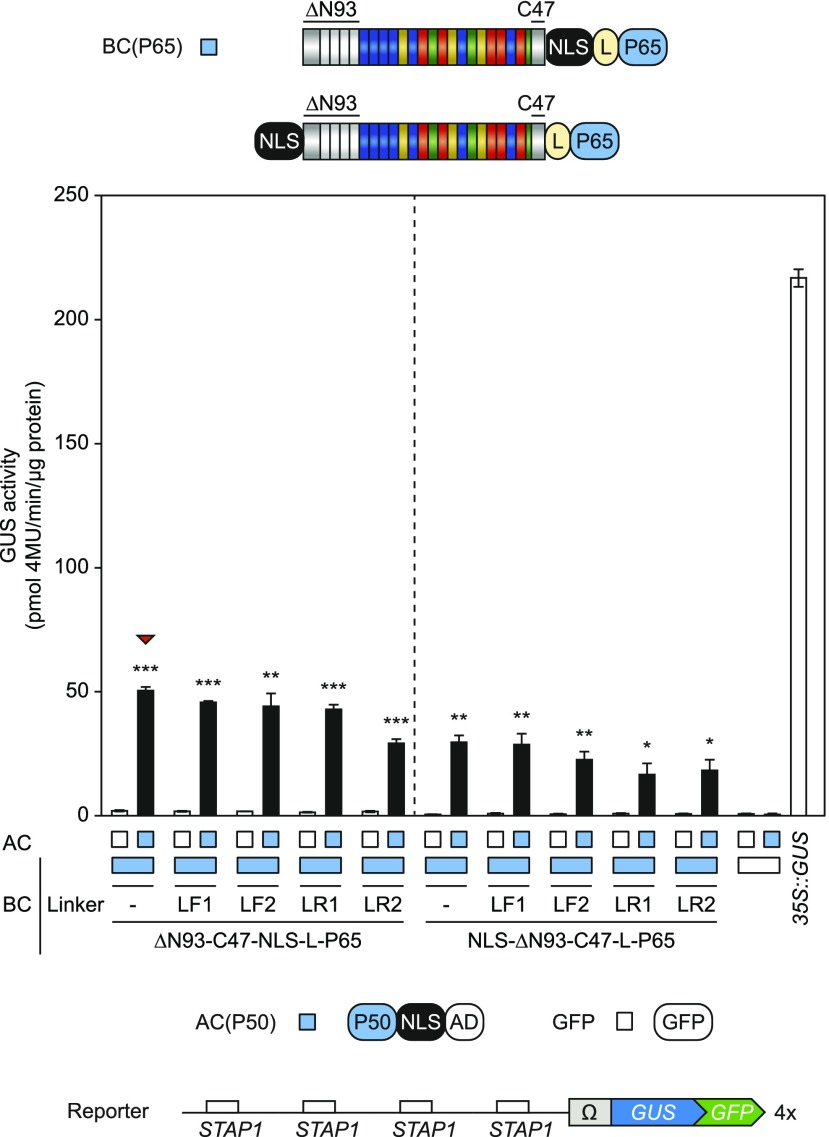
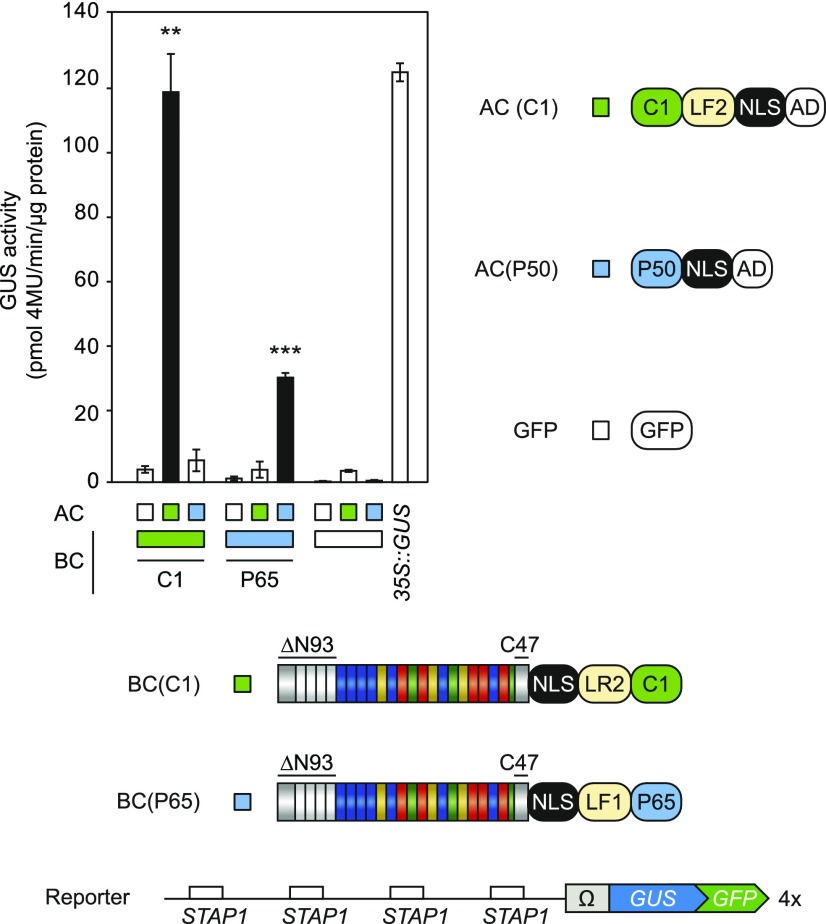
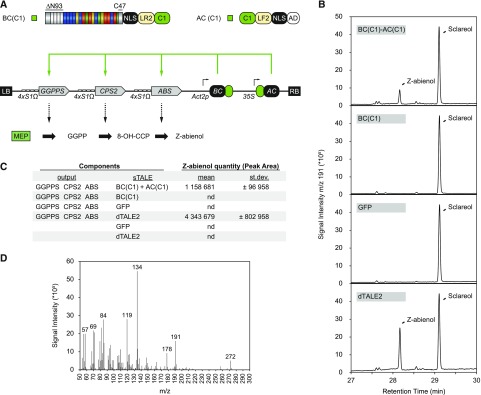
Transcription activator-like effectors (TALEs) are bacterial Type-III effector proteins from phytopathogenic Xanthomonas species that act as transcription factors in plants. The modular DNA-binding domain of TALEs can be reprogrammed to target nearly any DNA sequence. Here, we designed and optimized a two-component AND-gate system for synthetic circuits in plants based on TALEs. In this system, named split-TALE (sTALE), the TALE DNA binding domain and the transcription activation domain are separated and each fused to protein interacting domains. Physical interaction of interacting domains leads to TALE-reconstitution and can be monitored by reporter gene induction. This setup was used for optimization of the sTALE scaffolds, which result in an AND-gate system with an improved signal-to-noise ratio. We also provide a toolkit of ready-to-use vectors and single modules compatible with Golden Gate cloning and MoClo syntax. In addition to its implementation in synthetic regulatory circuits, the sTALE system allows the analysis of protein-protein interactions in planta.


Figures

Figure 1.
Figure 1.
Design of the split-TALE and preliminary tests. A, Schematic representation of dTALE2 (NTR; central repeat region [CRD]; CTR; type 3 secretion signal [T3S]; RVD; NLS; AD; repeat [Rep]; EBE; invariant thymine flanking the 5` end of the RVD-defined target sequence [T0]. B, Schematic representation of the split-TALE system (BC; AC; DBD; ID; STAP). C, GUS-assay after Agrobacterium-mediated transient expression of indicated split-TALE components (BC, AC) and the reporter construct (1×STAP-Ω-GUS-GFP, 4×STAP-Ω-GUS-GFP) in N. benthamiana leaves. The BC contains the full-length NTR and 47 amino acids of the CTR. Color codes indicate corresponding IDs (C1, green; wFos/cFos, dark blue; P50/P65, blue; GST, white). White bars, except for the positive controls on the right side (dTALE2 and 35S::GUS), are for assays where only one component of the sTALE with an ID, either BC or AC, was expressed. In that case, the other component was fused to GST, which should not interact with the ID, and therefore served as a negative control. Black bars are for assays where both functional components were expressed. The identity of the expressed component is indicated below the graph by green boxes or squares. Free GFP (35S::GFP) and dTALE2 were used to monitor background activity of the STAPs (1x or 4x) and TALE-mediated transcriptional induction of the reporter, respectively. 35S::GUS serves as a positive control. Error bars represent sd (sd) of three biological replicates. Asterisks indicate a significant difference in activity of the same BC tested with control AC (ID = GST; Student’s t test; *P-value ≤ 0.05).
Figure 2.
Figure 2.
Optimization of the BC-scaffold. Modifications are visualized by schematic representations above the diagrams. The position of the N-terminal deletions is indicated by Δx, where x represents the position of the amino acid. The position of the C-terminal deletions is indicated by Cx, where x represents the number of amino acids after the repeat region. The diagrams show the results of GUS-assays after Agrobacterium-mediated transient expression of indicated split-TALE components (BC, AC) and the reporter construct (4xSTAP-Ω-GUS-GFP) in N. benthamiana leaves. The color code indicates corresponding split-TALE constructs (C1, green boxes) or free GFP (35S::GFP, white boxes). Free GFP was used as a control to monitor the background activity of the single BC and AC. 35S::GUS serves as the positive control. White bars are for assays where only one component of the sTALE, either BC or AC, was expressed. Black bars are for assays where both functional components were expressed. The identity of the expressed component is indicated below the graph by green boxes or squares. A, The BC was either expressed under the control of 35S or Actin2 (Act2p) promoters with no change in background activity. Truncation of the NTR up to 135 amino acids significantly reduced the background activity of the BC. Activity was significantly increased in the presence of the corresponding AC. B, Positioning of the NLS to the N terminus of the BC further reduces its background activity, which was accompanied with a loss of overall activity in the presence of the matching AC. The BC-scaffold with a deletion of 93 amino acids of the NTR, 47 amino acids of the CTR, and a C-terminal NLS possessed the best signal-to-noise ratio (indicated by a red triangle). Error bars represent sd (sd) of three biological replicates. Asterisks indicate a significant difference in activity of the same BC tested with free GFP (white box; Student’s t test; *P-value ≤ 0.05, **P-value ≤ 0.01, ***P-value ≤ 0.001). Experiments were performed two times with similar results. All raw data are available in the Supplemental Data.
Figure 3.
Figure 3.
Optimization of the AC-scaffold. Modifications are visualized by schematic representations above the diagram (AD, TALE AD; AD2, modified AD from AtERF2). The diagram shows the GUS-assay after Agrobacterium-mediated transient expression of indicated split-TALE components (BC, AC) and the reporter construct (4×STAP-Ω-GUS-GFP) in N. benthamiana leaves. The color code indicates corresponding split TALE constructs (C1, green boxes) or free GFP (35S::GFP, white boxes). Free GFP was used to monitor background activity of the single BC and AC, respectively. 35S::GUS serves as the positive control. White bars are for assays where only one component of the sTALE, either BC or AC, was expressed. Black bars are for assays where both functional components were expressed. The identity of the expressed component is indicated below the graph by green boxes or squares. Deletion of the NLS within the AC-scaffold (2) strongly reduces split TALE activity. Stacking of AD and AD2 (6) negatively affects the activity of the AD. AC-scaffolds with AD (1) and AD2 (5) showed comparable activities, but the AC-scaffold with the TALE AD possessed the best signal-to-noise ratio (indicated by a red triangle). Error bars represent sd (sd) of three biological replicates. Asterisks indicate a significant difference in activity of the same BC tested with free GFP (white box; Student’s t test; *P-value ≤ 0.05, **P-value ≤ 0.01). Experiments were performed three times with similar results. All raw data are available in the Supplemental Data.
Figure 4.
Figure 4.
Integration of linkers within the AC- and BC-scaffold. Modifications are visualized by schematic representations above and below the diagrams (Linkers: F, flexible, R, rigid). The diagrams show the results of the GUS assays after Agrobacterium-mediated transient expression of indicated split-TALE components (BC, AC) and the reporter construct (4×STAP-Ω-GUS-GFP) in N. benthamiana leaves. The color code indicates corresponding split-TALE constructs (C1, green boxes) or free GFP (35S::GFP, white boxes). Free GFP was used to monitor background activity of the single BC and AC, respectively. 35S::GUS serves as the positive control. White bars are for assays where only one component of the sTALE, either BC or AC, was expressed. Black bars are for assays where both functional components were expressed. The identity of the expressed component is indicated below the graph by green boxes or squares. A, Linker-containing BCs were combined with ACs without linkers. Flexible linkers within the BC-scaffold showed no clear effect, whereas the rigid linker 2 (LR2) led to slightly increased split TALE activity. B, Linker-containing BCs were combined with linker-containing ACs. Rigid linkers within the AC-scaffold showed a trend to positive effects on split-TALE activity. The combination of BC(LR2) and AC(LF2) possessed the best signal-to-noise ratio (indicated by a red triangle). Error bars represent sd (sd) of three biological replicates. Asterisks indicate a significant difference in activity of the same BC tested with free GFP (white box; Student’s t test; *P-value ≤ 0.05, **P-value ≤ 0.01, ***P-value ≤ 0.001). Experiments were performed three times with similar results. All raw data are available in the Supplemental Data.
Figure 5.
Figure 5.
Optimized AC- and BC-scaffold with P65-P50 IDs. Modifications are visualized by schematic representations above the diagram (Linkers: F, flexible, R, rigid). Diagram shows GUS-assay after Agrobacterium-mediated transient expression of indicated split-TALE components (BC, AC) and the reporter construct (4×STAP-Ω-GUS-GFP) in N. benthamiana leaves. The color code indicates corresponding split TALE constructs (P65/P50, blue boxes) or free GFP (35S::GFP, white boxes). Free GFP was used to monitor background activity of the single BC and AC, respectively. 35S::GUS serves as the positive control. White bars are for assays where only one component of the sTALE, either BC or AC, was expressed. Black bars are for assays where both functional components were expressed. The identity of the expressed component is indicated below the graph by green boxes or squares. A C-terminal NLS is beneficial for sTALE activity using the ID pair P65/P50 (left). Flexible linkers showed no clear effect, whereas rigid linkers showed negative effects on split-TALE activity. The combination of BC and AC without linkers possessed the best signal-to-noise ratio (indicated by a red triangle). Error bars represent sd (sd) of three biological replicates. Asterisks indicate a significant difference in activity of the same BC tested with free GFP (white box; Student’s t test; *P-value ≤ 0.05, **P-value ≤ 0.01, ***P-value ≤ 0.001). Experiments were performed two times with similar results. All raw data are available in the Supplemental Data.
Figure 6.
Figure 6.
Cross test of C1 and P65/P50 split TALE scaffolds. The constructs used are visualized by schematic representations. The diagram shows the results of the GUS-assay after Agrobacterium-mediated transient expression of indicated split-TALE components (BC, AC) and the reporter construct (4×STAP-Ω-GUS-GFP) in N. benthamiana leaves. The color code indicates corresponding split-TALE constructs (C1, green boxes; P65/P50, blue boxes) or free GFP (35S::GFP, white boxes). Free GFP was used to monitor background activity of the single BCs and ACs, respectively. 35S::GUS serves as the positive control. White bars are for assays where only one component of the sTALE, either BC or AC, was expressed. Black bars are for assays where both functional components were expressed. The identity of the expressed component is indicated below the graph by green boxes or squares. Split-TALE activity was only measurable in the presence of the matching IDs. Error bars represent sd (sd) of three biological replicates. Asterisks indicate a significant difference in activity of the same BC tested with free GFP (white box; Student’s t test; **P-value ≤ 0.01, ***P-value ≤ 0.001). Experiments were performed two times with similar results. All raw data are available in the Supplemental Data.
Figure 7.
Figure 7.
sTALE-regulated Z-abienol production. A, Schematic representation of the constructs used for Z-abienol production. BC and AC are constitutively expressed with Act2 and 35S promoters, respectively. Genes for the production of Z-abienol are fused to 4×STAP1-Ω and induced by TALE-reconstitution [geranylgeranyl diphosphate synthase (NtGGPPS2), 8-hydroxycopalyl diphoshate (8-OH-CPP) synthase (NtCPS2), Z-abienol synthase (NtABS)]. B, GC-MS chromatogram (m/z 191) of hexane leaf surface extracts after transient expression in N. benthamiana leaves. Only the portion of the chromatogram between retention times from 27 to 30 min is shown. Sclareol serves as internal standard for normalization. Z-abienol elutes at 28.20 min. Z-Abienol is produced only in the presence of the two sTALE components or the full-length dTALE2. C, Peak areas of Z-abienol normalized to sclareol. nd, Not detected. D, Mass spectrum of Z-abienol.

References

    1. Barrero AF, Alvarez-Manzaneda EJ, Altarejos J, Salido S, Ramos JM (1993) Synthesis of Ambrox(R) from (-)-Sclareol and (+)-Cis-Abienol. Tetrahedron 49: 10405–10412
    1. Bedell VM, Wang Y, Campbell JM, Poshusta TL, Starker CG, Krug RG II, Tan W, Penheiter SG, Ma AC, Leung AY, et al. (2012) In vivo genome editing using a high-efficiency TALEN system. Nature 491: 114–118 - PMC - PubMed
    1. Bell CE, Frescura P, Hochschild A, Lewis M (2000) Crystal structure of the lambda repressor C-terminal domain provides a model for cooperative operator binding. Cell 101: 801–811 - PubMed
    1. Boch J, Bonas U (2010) Xanthomonas AvrBs3 family-type III effectors: Discovery and function. Annu Rev Phytopathol 48: 419–436 - PubMed
    1. Boch J, Scholze H, Schornack S, Landgraf A, Hahn S, Kay S, Lahaye T, Nickstadt A, Bonas U (2009) Breaking the code of DNA binding specificity of TAL-type III effectors. Science 326: 1509–1512 - PubMed

Publication types

MeSH terms

LinkOut - more resources