

Long-term expanding human airway organoids for disease modeling
- PMID: 30643021
- PMCID: PMC6376275
- DOI: 10.15252/embj.2018100300
Long-term expanding human airway organoids for disease modeling
Abstract
Organoids are self-organizing 3D structures grown from stem cells that recapitulate essential aspects of organ structure and function. Here, we describe a method to establish long-term-expanding human airway organoids from broncho-alveolar resections or lavage material. The pseudostratified airway organoids consist of basal cells, functional multi-ciliated cells, mucus-producing secretory cells, and CC10-secreting club cells. Airway organoids derived from cystic fibrosis (CF) patients allow assessment of CFTR function in an organoid swelling assay. Organoids established from lung cancer resections and metastasis biopsies retain tumor histopathology as well as cancer gene mutations and are amenable to drug screening. Respiratory syncytial virus (RSV) infection recapitulates central disease features, dramatically increases organoid cell motility via the non-structural viral NS2 protein, and preferentially recruits neutrophils upon co-culturing. We conclude that human airway organoids represent versatile models for the in vitro study of hereditary, malignant, and infectious pulmonary disease.
Keywords: 3D culture; airway organoids; cystic fibrosis; lung cancer; respiratory syncytial virus.
© 2019 The Authors. Published under the terms of the CC BY NC ND 4.0 license.
Figures
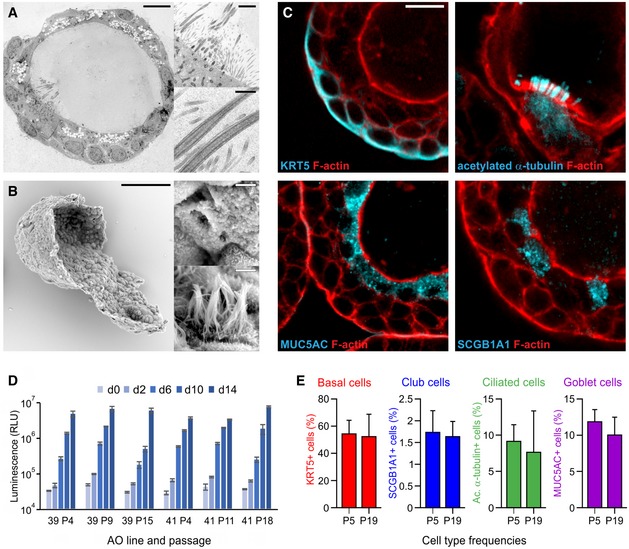
Transmission electron micrograph of an AO cross section showing the polarized, pseudostratified epithelium containing basal, secretory, brush, and multi‐ciliated cells. Details display apical microvilli and cilia with their characteristic microtubule structure. Scale bars equal 10 μm, 2 μm, and 500 nm. See also Appendix Fig S1A and [Link], [Link], [Link].
Scanning electron micrograph of a partially opened AO visualizing its 3D architecture, as well as basal and apical ultrastructure. Details display apical surfaces of secretory and multi‐ciliated cells. Scale bars equal 50 μm (overview) and 2 μm (details).
Immunofluorescent sections of AOs showing markers for basal cells (KRT5), cilia (acetylated α‐tubulin), secretory cells (MUC5AC), and club cells (SCGB1A1). KRT5 is present exclusively in basally localized cells, while cilia, MUC5AC, and SCGB1A1 localize luminally. Counterstained is the actin cytoskeleton (red). Scale bar equals 10 μm. See Appendix Fig S1B for IHC images.
Luminescent cell viability assay comparing proliferative capacity of two independently generated AO lines at early, mid‐, and late passage numbers. Per group, 3,000 cells were seeded and their expansion was measured at the indicated time points. Error bars represent standard deviations of technical triplicates.
Quantification of cell types in AO lines at early and late passage (P5 vs. P19) as determined by immunofluorescence using the indicated markers. The number of basal cells, club cells, ciliated cells, and secretory cells does not differ significantly between early and late passage AOs. Data shown are representatives of at least three independent experiments. Error bars indicate s.e.m.
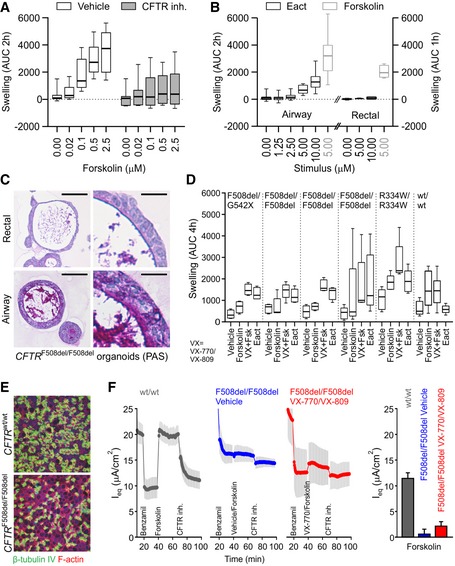
Box‐and‐whisker plot showing concentration‐dependent forskolin‐induced swelling of AOs in the absence and presence of CFTR inhibitors CFTRinh‐172 and GlyH101. Upon CFTR inhibition, swelling is noticeably decreased but not absent. Shown are pooled data from three different AO lines used in each of three independent experiments. Whiskers indicate smallest and largest values, boxes indicate 25th to 75th percentile, and horizontal solid line indicates median. AUC, area under the curve.
Box‐and‐whisker plot showing concentration‐dependent Eact‐induced swelling of AOs, but not rectal organoids (black outlines). Forskolin causes swelling in both organoid types (gray outlines). Shown are pooled data from three different AO and two different rectal organoid lines used in three to four independent experiments. Whiskers indicate smallest and largest values, boxes indicate 25th to 75th percentile, and horizontal solid line indicates median. Swelling was linear for 2 h for AOs, but only 1 h for rectal organoids. See Appendix Fig S3A for respective time course plots.
Representative histological sections of periodic acid–Schiff (PAS)‐stained organoids from a CF patient with CFTR F508del/F508del mutation. Note the thick layer of PAS‐positive polysaccharides apically lining the airway epithelium. Rectal organoids were generated from rectal biopsies; AOs were generated from broncho‐alveolar lavages (BALs). Scale bars equal 50 μm. See Appendix Fig S3B for PAS‐stained wild‐type and CFTR R334W/R334W organoid sections.
Box‐and‐whisker plot showing swelling assays of several CF patient AO lines carrying the indicated CFTR mutations (G542X is a premature stop associated with severe disease and no functional CFTR protein; F508del is the most common CFTR mutation in subjects with CF and severely reduces apical trafficking and function, leading to severe disease (high sweat chloride, high pancreas insufficiency, high pseudomonas infection rate); R334W is a milder CFTR mutation associated as indicated by lower pseudomonas infection rates and pancreas sufficiency with reduced ion channel conductivity, normal apical expression, and some residual function). Forskolin‐induced swelling rarely exceeds vehicle controls in CF AOs, but increases in the presence of the CFTR modulating drugs VX‐770 and VX‐809. Eact‐induced swelling exceeds forskolin‐induced swelling to a similar extent as pre‐treatment with VX‐770 and VX‐809 in four out of five CF AO lines. In contrast, BAL‐derived WT AOs swell following forskolin stimulation independent of the presence of VX‐770 and VX‐809. Of note, Eact‐induced swelling is not observed in this AO line. Shown are pooled data of four to five independent experiments (CF AOs) or two independent experiments (WT AOs). Whiskers indicate smallest and largest values, boxes indicate 25th to 75th percentile, and horizontal solid line indicates median. See Appendix Fig S3C for selected time course plots.
Whole‐mounted immunofluorescence analysis of BAL AO‐derived ALI cultures. After 3 weeks of differentiation, ALI cultures show ciliated airway epithelium (green, β‐tubulin). Counterstained are the actin cytoskeleton (red) and nuclei (blue).
Transepithelial electrical measurements of BAL AO‐derived ALI cultures. Shown are equivalent current (I eq) traces of a CFTR wt/wt (gray) and CFTR F508del/F508del donor, treated with vehicle (blue) or VX‐809 and VX‐770 (red). Inhibition of the epithelial sodium channel (ENaC) with benzamil was observed in all traces (declining I eq). Forskolin increased the current in CFTR wt/wt and CFTR F508del/F50del donor treated with VX‐809 and VX‐770, but not in the vehicle treated. A decline was observed with CFTRinh‐172 in all examined conditions. The bar graphs quantify the peak forskolin activated‐ and CFTRinh‐172 inhibited‐currents. Shown are pooled data of four independent measurements for each donor. Results are shown as mean ± s.d.
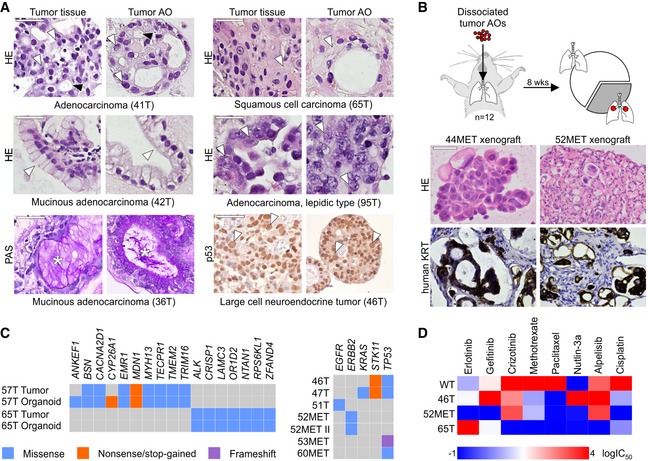
Tumor AOs derived from different resected primary lung cancer types recapitulate their respective histopathological features. Examples include adenocarcinoma (41T, white arrowheads: multiple nucleoli, black arrowheads: tubule formation), mucinous adenocarcinoma (42T/36T, arrowheads: mucinous glands, stars: PAS‐positive mucus), adenocarcinoma lepidic type (previously known as broncho‐alveolar carcinoma, 95T, arrowheads: distinct large nuclei), squamous cell carcinoma (65T, arrowheads: multi‐layered, keratinization), and large cell neuroendocrine tumor (46T, arrowheads: large nuclei, p53 immunolabeling). Scale bars equal 50 μm.
Tumor AOs derived from metastatic adenocarcinomas give rise to lung cancer in vivo following intratracheal instillation into immunocompromised mice. 30% of injected mice (n = 12) developed visible tumors 8 weeks after instillation. Tumors show features of adenocarcinomas (HE stainings) and are integrated within murine stroma (human keratin immunolabeling). Scale bars equal 50 μm.
WGS reveals largely conserved mutation status of lung cancer genes between matched tumor–organoid pairs (left plot, Appendix Table S1). The right plot shows mutation status of selected lung cancer genes in several additional tumor AO lines derived from primary as well as metastatic lung cancer. Of note, ERBB2 mutation frequencies in 52MET and 52MET II tumor AOs were almost identical (67 and 70%) despite originating from independent biopsies taken 3 months apart. See Appendix Table S2.
Heat map of IC50 values of selected anti‐cancer drugs indicating differential responses of tumor AOs. For example, 46T (mutant TP53) is resistant to Nutlin‐3a treatment, 65T (mutant ALK1) is resistant to treatment with crizotinib, and 52MET (mutant ERBB2) is sensitive to treatment with erlotinib and gefitinib. See Appendix Fig S4F for individual dose–response curves.
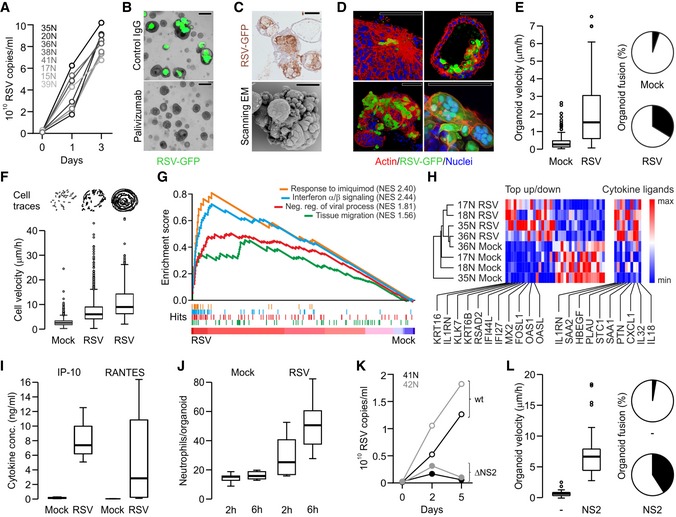
Quantitative PCR showing RSV replication kinetics in the indicated AO lines.
Representative phase‐contrast/GFP overlays of RSV‐infected AOs (5 days post‐infection). GFP signal is absent following pre‐incubation with palivizumab (fusion blocking antibody) but not control IgG. Scale bars equal 100 μm.
Immunohistochemical RSV staining (top) and scanning electron micrograph (bottom) of RSV‐infected AOs (5 days post‐infection) show organoid fusion and blebbing. Scale bars equal 50 μm.
3D reconstructions of immunolabeled AOs 3 days after RSV infection showing (clockwise) cytoskeletal rearrangements, apical extrusion of infected cells, syncytia formation, and organoid fusion. Scale bars equal 50 μm.
RSV infection causes increased organoid velocity (Tukey boxplot) and organoid fusion (pie chart). Shown are data from three independent experiments. Horizontal solid line indicates median, box indicate 25th to 75th percentile, whiskers indicate 25th percentile minus 1.5 times inter‐quartile distance (IQR) or 75th percentile plus 1.5 times IQR, and circles indicate individual values greater than 1.5 times IQR. See also Movie EV4.
Cells within RSV‐infected organoids are more motile than cells in control organoids irrespective of induced organoid rotation. Cell traces above individual Tukey boxplots are from representative organoids. Shown are data from two to three independent experiments. Horizontal solid line indicates median, box indicates 25th to 75th percentile, whiskers indicate 25th percentile minus 1.5 times inter‐quartile distance (IQR) or 75th percentile plus 1.5 times IQR, and circles indicate individual values greater than 1.5 times IQR. See also Appendix Fig S5A and B, and Movies EV5 and EV6.
GSEA plots showing strong enrichment of indicated gene signatures in transcriptomes of four independently RSV‐ vs. mock‐infected AO lines. NES, normalized enrichment score. See Table EV4 for signatures and leading‐edge genes.
Hierarchical clustering of the indicated AO lines displaying the 36 most differentially expressed genes of RSV‐ vs. mock‐infected AO transcripts as well as selected cytokines (see Table EV4). Gradients depict the relative maximum and minimum values per transcript. Names and ranks of selected genes involved in migration (KRT16, KRT6B), interferon signaling (IL1RN, IFI44L), and viral response (MX2, OAS1) are indicated.
ELISA‐based quantification of cytokines secreted by mock‐ vs. RSV‐infected AOs. Shown are data from two independent experiments. Whiskers indicate smallest and largest values, boxes indicate 25th to 75th percentile, and horizontal solid line indicates median.
Box‐and‐whisker plot showing increased numbers of primary human neutrophils populating RSV‐ compared to mock‐infected AOs. Shown are data from two independent experiments. Whiskers indicate smallest and largest values, boxes indicate 25th to 75th percentile, and horizontal solid line indicates median. See also Movies EV8 and EV9.
Quantitative PCR showing replication kinetics of wild‐type (wt) and mutant RSV lacking NS2 (ΔNS2) in the indicated AO lines. See also Movie EV10.
Inducible overexpression of NS2 causes increased organoid velocity (box‐and‐whisker plot) and fusion (pie chart). Shown are data from three independent experiments. Horizontal solid line indicates median, box indicates 25th to 75th percentile, whiskers indicate 25th percentile minus 1.5 times inter‐quartile distance (IQR) or 75th percentile plus 1.5 times IQR, and circles indicate individual values greater than 1.5 times IQR. See Appendix Fig S6, Movie EV11.
Comment in
-
An airway organoid is forever.EMBO J. 2019 Feb 15;38(4):e101526. doi: 10.15252/embj.2019101526. Epub 2019 Feb 4. EMBO J. 2019. PMID: 30718273 Free PMC article.
References
-
- Amatngalim GD, van Wijck Y, de Mooij‐Eijk Y, Verhoosel RM, Harder J, Lekkerkerker AN, Janssen RA, Hiemstra PS (2015) Basal cells contribute to innate immunity of the airway epithelium through production of the antimicrobial protein RNase 7. J Immunol 194: 3340–3350 - PubMed
-
- Benali R, Tournier JM, Chevillard M, Zahm JM, Klossek JM, Hinnrasky J, Gaillard D, Maquart FX, Puchelle E (1993) Tubule formation by human surface respiratory epithelial cells cultured in a three‐dimensional collagen lattice. Am J Physiol 264: L183–L192 - PubMed
-
- Boj SF, Hwang CI, Baker LA, Chio II, Engle DD, Corbo V, Jager M, Ponz‐Sarvise M, Tiriac H, Spector MS, Gracanin A, Oni T, Yu KH, van Boxtel R, Huch M, Rivera KD, Wilson JP, Feigin ME, Ohlund D, Handly‐Santana A et al (2015) Organoid models of human and mouse ductal pancreatic cancer. Cell 160: 324–338 - PMC - PubMed
Publication types
MeSH terms
Substances
LinkOut - more resources
Full Text Sources
Other Literature Sources
Medical
Research Materials
Miscellaneous
