. 2019 Jan 14;10(1):196.
doi: 10.1038/s41467-018-07956-7.

Expression of novel long noncoding RNAs defines virus-specific effector and memory CD8+ T cells

Affiliations

Expression of novel long noncoding RNAs defines virus-specific effector and memory CD8+ T cells

William H Hudson et al. Nat Commun. .

Abstract

In response to viral infection, CD8+ T cells undergo expansion and differentiate into distinct classes of effector cells. After clearance of the virus, a small population of long-lived memory cells persists. Comprehensive studies have defined the protein-coding transcriptional changes associated with this process. Here we expand on this prior work by performing RNA-sequencing to identify changes in long noncoding RNA (lncRNA) expression in human and mouse CD8+ T cells responding to viral infection. We identify hundreds of unannotated lncRNAs and show that expression profiles of both known and novel lncRNAs are sufficient to define naive, effector, and memory CD8+ T cell subsets, implying that they may be involved in fate decisions during antigen-driven differentiation. Additionally, in comparing mouse and human lncRNA expression, we find that lncRNAs with conserved sequence undergo similar changes in expression in the two species, suggesting an evolutionarily conserved role for lncRNAs during CD8+ T cell differentiation.


Conflict of interest statement

The authors declare no competing interests.

Figures

Fig. 1
Fig. 1
Transcriptomic analysis of antigen-specific mouse CD8+ T cells during acute infection. a 2000 naive CD45.1+ P14 cells were transferred to WT C57BL/6J mice that were subsequently infected with LCMV Armstrong. Eight and 48 days post-infection, indicated cell populations were isolated from splenocytes via FACS. At day 8, three pools of each cell type were isolated with three mice in each pool. At day 48, three pools of each cell type were isolated with five mice in each pool. Separately, naive cells were isolated from three uninfected CD45.1+ P14 mice. b From these cell populations, RNA-sequencing libraries were generated and sequenced. Resulting sequences were aligned and analyzed for the expression of both reference and novel genes. c Types of genes expressed in antigen-specific CD8+ T cells. d Average expression levels of types of genes from (c). e, f Protein-coding potential and exonic structure of the 1291 novel genes detected by de novo transcriptome assembly. g Heatmap of differentially expressed novel gene expression across all 15 samples. FPM, fragments per million. In panel (d), bars indicate minimum and maximum values and box indicates 25th percentile, median, and 75th percentile. FPM, fragments per million; SD, standard deviation
Fig. 2
Fig. 2
Mouse CD8+ T cell differentiation is marked by large changes in lncRNA gene expression. a Heatmap showing expression of all differentially expressed genes in CD8+ T cells during the response to LCMV Armstrong. b MA plot of noncoding genes in day 8 terminal effector (TE) and day 48 central memory (CM) CD8+ T cells compared to naive cells. c 40.2% of expressed, known protein-coding genes are differentially expressed throughout CD8+ T cell differentiation, compared to 15.7% of previously-annotated lncRNA genes. However, 44.4% of lncRNA genes discovered in this study are differentially expressed throughout CD8+ T cell differentiation. d At day 8 and 48, two subsets of CD8+ T cells were sorted. Differences in noncoding gene expression between these subsets are shown in (e) and (f). Colored points indicate significant expression differences between the two cell subsets. FC, fold change
Fig. 3
Fig. 3
Unique lncRNA expression patterns define antigen-specific mouse CD8+ T cell subsets. a Principal component analysis (PCA) of all 15 LCMV-specific CD8+ T cell samples, using only protein-coding genes. b PCA of all 15 LCMV-specific CD8+ T cell subsets, using only noncoding genes, recapitulates the PCA of protein-coding genes. c Expression of novel lncRNAs is likewise sufficient to discriminate among CD8+ T cell subsets. d Unsupervised clustering revealed distinct expression patterns of lncRNA genes; lncRNA genes (red) and an exemplar protein-coding gene (blue) are shown for selected clusters. e Heatmap of noncoding genes from selected clusters that show large differences in expression between MP and TE cells at day 8. f log-transformed fold change (compared to naive) is shown for noncoding genes expressed in MP and TE cells. Clusters 4 and 8—which contain genes that discriminate between TE and MP cells—are shown with colored circles. g Clusters 6 and 13 contain genes differentially expressed between MP and TE cells
Fig. 4
Fig. 4
Transcriptomic analysis of antigen-specific human CD8+ T cells during acute infection. a Antigen-specific CD8+ T cells were isolated from healthy volunteers at indicated time points following administration of the live attenuated yellow fever-17D (YF-17D) vaccine. b From these cell populations, RNA-sequencing libraries were generated and sequenced. Resulting sequences were aligned and analyzed for the expression of both reference and novel genes. c Types of genes expressed in human antigen-specific CD8+ T cells. d Average expression levels of types of genes from (c). e, f Protein-coding potential and exonic structure of the novel genes detected by de novo transcriptome assembly. g Expression of differentially expressed novel genes across all samples. In panel (d), bars indicate minimum and maximum values and box indicates 25th percentile, median, and 75th percentile. FPM, fragments per million; SD, standard deviation
Fig. 5
Fig. 5
Human CD8+ T cell differentiation is marked by large changes in lncRNA gene expression. a Heatmap showing expression of all differentially expressed genes in human CD8+ T cells during the response to yellow fever vaccination. b MA plot of noncoding genes in day 14 and memory yellow fever virus-specific CD8+ T cells, compared to naive. c In humans, 28.3% of expressed protein-coding genes are differentially expressed throughout CD8+ T cell differentiation, compared to 16.7% of previously annotated lncRNA genes. In line with results from mice, a higher proportion of novel lncRNA genes (28.3%) are differentially expressed during CD8+ T cell differentiation compared to known lncRNA genes. d, e Changes in noncoding gene expression between day 14 and day 28 antigen-specific CD8+ T cells. Colored points indicate significant expression differences between the two cell subsets. FC, fold change
Fig. 6
Fig. 6
Unique lncRNA expression patterns define time points of human CD8+ T cell differentiation. a Principal component analysis (PCA) of all human yellow fever-specific CD8+ T cell samples, using only protein-coding genes. b PCA of human yellow fever-specific CD8+ T cell subsets, using only noncoding genes, recapitulates the PCA of protein-coding genes. c Likewise, expression of novel lncRNAs is sufficient to discriminate CD8+ T cell subsets. d Unsupervised clustering revealed distinct expression patterns of lncRNA genes; lncRNA genes (red) and an exemplar protein-coding gene (blue) are shown for selected clusters
Fig. 7
Fig. 7
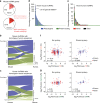
lncRNAs with conserved sequence and shared synteny exhibit similar expression patterns in human and mouse CD8+ T cell differentiation. a Number of novel and previously annotated mouse lncRNA genes with detectable sequence homology to a human transcript. b, c Composition of noncoding RNA with any homolog in the opposite species. d Number and biotype of homologs of novel mouse genes with significant sequence similarity to human genes (210). e Number and biotype of homologs of novel human genes with significant sequence similarity to mouse genes (96). f, g Correlation of expression changes in homologous lncRNAs with or without shared synteny. In panels (f) and (g), Pearson’s r is shown, with p-value calculated using a t distribution

Similar articles

Cited by

References

    1. Kaech SM, Hemby S, Kersh E, Ahmed R. Molecular and functional profiling of memory CD8 T. Cell Differ. Cell. 2002;111:837–851. - PubMed
    1. Best JA, et al. Transcriptional insights into the CD8+ T cell response to infection and memory T cell formation. Nat. Immunol. 2013;14:404–412. doi: 10.1038/ni.2536. - DOI - PMC - PubMed
    1. Wherry EJ, et al. Molecular signature of CD8+ T cell exhaustion during chronic viral infection. Immunity. 2007;27:670–684. doi: 10.1016/j.immuni.2007.09.006. - DOI - PubMed
    1. Haining WN, et al. Identification of an evolutionarily conserved transcriptional signature of CD8 memory differentiation that is shared by T and B cells. J. Immunol. 2008;181:1859–1868. doi: 10.4049/jimmunol.181.3.1859. - DOI - PMC - PubMed
    1. Akondy RS, et al. Origin and differentiation of human memory CD8 T cells after vaccination. Nature. 2017;552:362. doi: 10.1038/nature24633. - DOI - PMC - PubMed

Publication types

MeSH terms

Substances