. 2019 Jan 14;10(1):197.
doi: 10.1038/s41467-018-08190-x.

A macrophage-based screen identifies antibacterial compounds selective for intracellular Salmonella Typhimurium

Affiliations

A macrophage-based screen identifies antibacterial compounds selective for intracellular Salmonella Typhimurium

Michael J Ellis et al. Nat Commun. .

Abstract

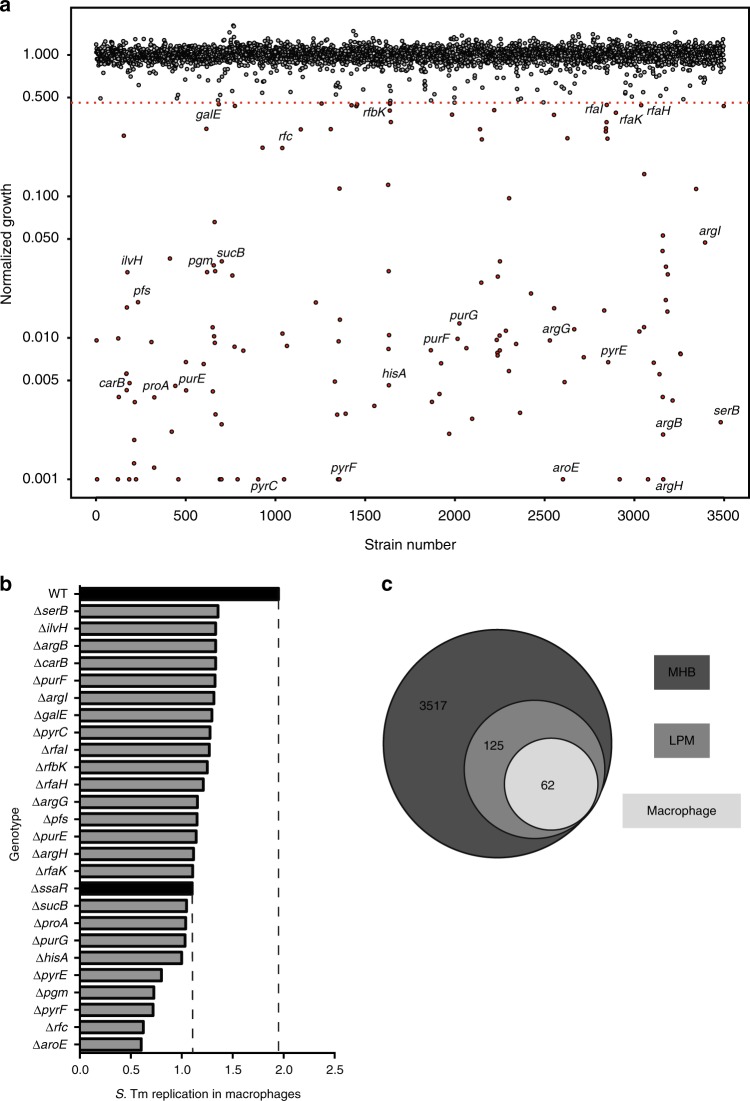
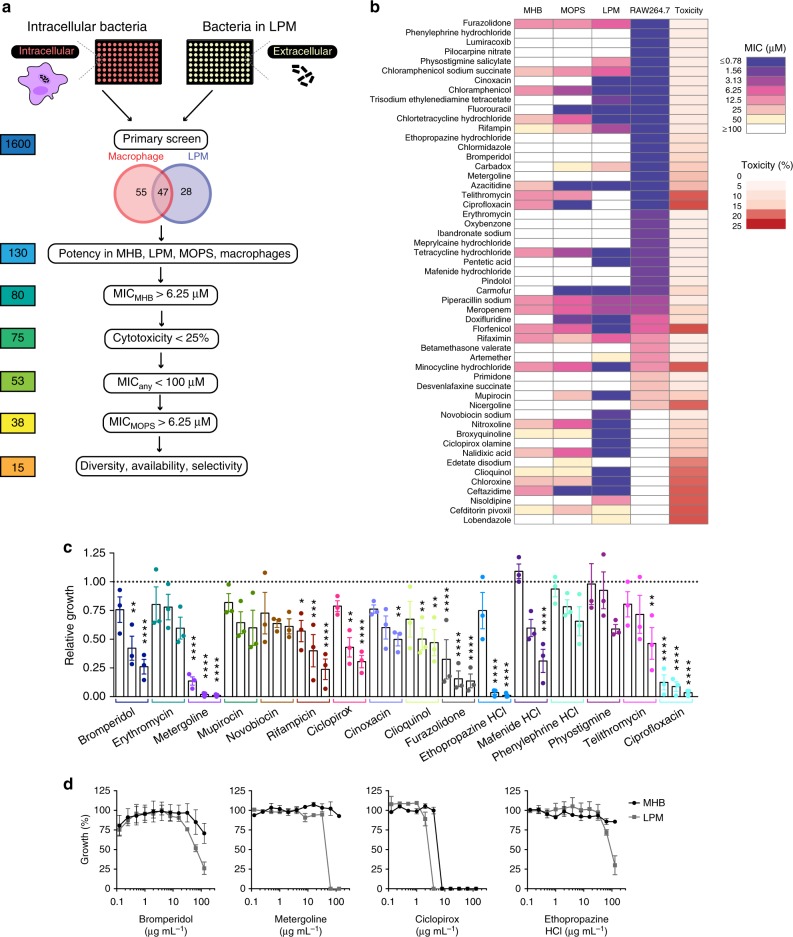
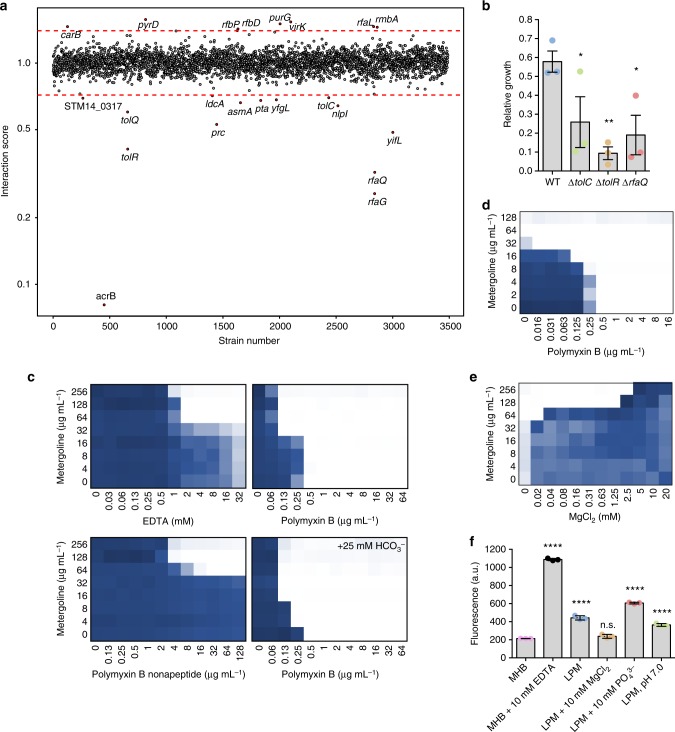
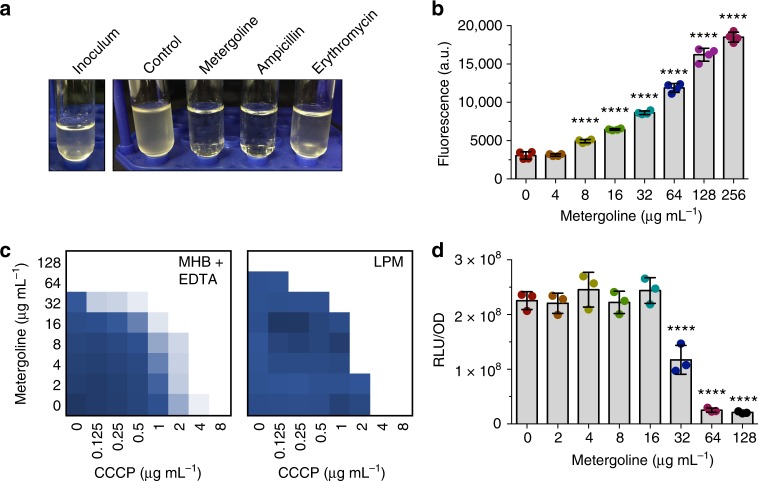
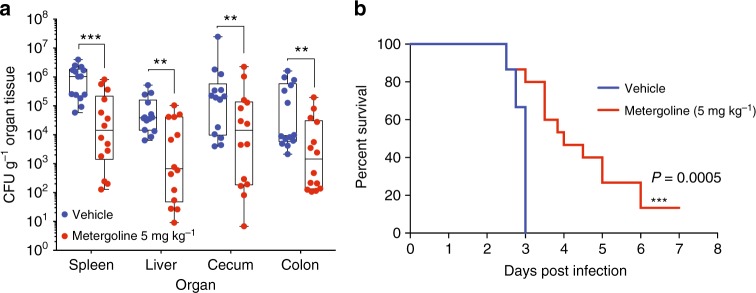
Salmonella Typhimurium (S. Tm) establishes systemic infection in susceptible hosts by evading the innate immune response and replicating within host phagocytes. Here, we sought to identify inhibitors of intracellular S. Tm replication by conducting parallel chemical screens against S. Tm growing in macrophage-mimicking media and within macrophages. We identify several compounds that inhibit Salmonella growth in the intracellular environment and in acidic, ion-limited media. We report on the antimicrobial activity of the psychoactive drug metergoline, which is specific against intracellular S. Tm. Screening an S. Tm deletion library in the presence of metergoline reveals hypersensitization of outer membrane mutants to metergoline activity. Metergoline disrupts the proton motive force at the bacterial cytoplasmic membrane and extends animal survival during a systemic S. Tm infection. This work highlights the predictive nature of intracellular screens for in vivo efficacy, and identifies metergoline as a novel antimicrobial active against Salmonella.


Conflict of interest statement

The authors declare no competing interests.

Figures

Fig. 1
Fig. 1
Genetic requirements for S. Tm growth in host-mimicking media and macrophages. a Index plot showing normalized growth of mutant strains from the Salmonella single-gene deletion (SGD) collection in LPM media, sorted in order of chromosomal position of deleted genes. Values shown per strain represent the calculated mean growth of three replicate screens, normalized to account for plate and positional effects. Points below the red dotted line represent genes with growth values less than 3.5 s.d. from the mean of the dataset. Strains that exhibited low growth and were used in follow-up experiments are labeled. b Replication of selected mutant strains from the SGD collection in RAW264.7 macrophages over 7 h. Wildtype (WT) and ∆ssaR strains (black bars) were used as controls for high and low replication, respectively. Bar plots depict the mean fold-change in bacterial burden between 0 and 7 h of intracellular infection, measured from two technical replicates. c Cartoon representing the overlap between genes essential for growth in LPM or within RAW264.7 macrophages, and dispensable genes in S. Tm represented in the SGD
Fig. 2
Fig. 2
Chemical screen identifies novel compound activities against intracellular S. Tm. a Screening workflow to identify compounds with intracellular antimicrobial activity against S. Tm grown in acidic LPM media and internalized in RAW264.7 macrophages. Secondary screening pipeline is shown below with the number of compounds remaining at each step to the left. b Potency and toxicity analysis of all primary screen actives represented as a heat map. Shown are the minimum inhibitory concentrations (MIC) for all compounds against S. Tm grown in MHB, LPM, MOPS (OD600), and inside RAW264.7 macrophages (luminescence, RLU); the final column (toxicity) reports lactate dehydrogenase release from RAW264.7 macrophages after 2 h of exposure to 50 μM compound. All values shown reflect the mean of duplicate measurements. c Intracellular S. Tm replication measured in primary bone marrow-derived macrophages (BMMs) isolated from C57BL/6 mice. Relative growth reflects replication over 4 h, normalized to bacterial growth in BMMs treated with DMSO. Compounds were added at 8, 64, and 128 μg mL−1, as shown in increasing concentrations for each. Bar plots depict the mean of three independent biological replicates, error bars indicate s.e.m. Groups were compared via two-way ANOVA with Bonferroni correction for multiple testing. *P < 0.05, **P < 0.01, ***P < 0.001, ****P < 0.0001. d Potency analysis of S. Tm growth inhibition for bromperidol, metergoline, ciclopirox, ethopropazine HCl in MHB (black) and LPM (gray). Growth is normalized to a DMSO control (set to 100%), error bars indicate s.e.m. for two biological replicates
Fig. 3
Fig. 3
Impact of OM integrity and efflux on metergoline activity in MHB and LPM. a Index plot showing sensitivity of SGD collection mutant strains grown in MHB with 100 µg mL−1 metergoline. Strains are sorted based on chromosomal position of the deleted gene. The chemical-genetic interaction score was calculated by dividing normalized growth of each mutant in the presence of metergoline divided by normalized growth in MHB. Red lines indicate 3 s.d. from the mean of the dataset and values represent the mean of duplicate screens. The deleted genes within sensitive (below red) or resistant (above red) mutant strains are indicated. b Intracellular S. Tm (WT str. 14028s and indicated SGD mutants) replication measured in bone marrow-derived macrophages isolated from C57BL/6 mice, treated with 8 µg mL−1 metergoline. Relative growth reflects replication over 4 h, normalized to bacterial growth in macrophages treated with DMSO. Bar plots depict the mean of three independent infections, error bars indicate s.e.m. SGD mutant groups were compared to WT S. Tm with a Kruskal–Wallis test with Dunn’s multiple test correction. *P < 0.05, **P < 0.01. c Chequerboard broth microdilution assay showing dose-dependent potentiation of metergoline by membrane-perturbing agents against S. Tm grown in MHB. Where indicated, sodium bicarbonate (HCO3) was added to media at a final concentration of 25 mM. d As in c but with a ∆tolC strain of S. Tm. e Chequerboard assay showing antagonism between Mg2+ and metergoline in LPM. In ce, higher growth is indicated in dark blue and no detectable growth in white. Results are representative of at least two independent experiments. f NPN uptake assay for WT S. Tm grown in variants of LPM, MHB, or MHB with 10 mM EDTA. Values were normalized to account for background fluorescence prior to plotting. Bar plots depict the mean of triplicate experiments, error bars indicate s.d. All groups were compared to MHB via one-way ANOVA with Holm–Sidak’s multiple test correction. ****P < 0.0001
Fig. 4
Fig. 4
Atomic force microscopy (AFM) on S. Tm grown in MHB, LPM, or bone marrow-derived macrophages. Images taken at increasing resolution as well as a 3D surface projection are shown for bacteria grown in a MHB, b LPM, or c immediately following lysis of infected macrophages (see Methods). Two-dimensional surface roughness projections (far right) show the surface topology of each sample. Scale bars from left to right show the following distance: a 2, 0.1, 0.4 µM; b 1, 0.1, 0.4 µM; c 4, 1, 0.1, 0.4 µM
Fig. 5
Fig. 5
Metergoline is bacteriolytic and perturbs the S. Tm cytoplasmic membrane. a Turbidity of cultures of S. Tm ∆tolC in MHB after growth to mid-log phase (left, inoculum) then 2.5 h of growth at 37 °C in the presence of metergoline (200 µg mL−1), ampicillin (16 µg mL−1), erythromycin (16 µg mL−1), or a DMSO control. Note that erythromycin is bacteriostatic and culture turbidity did not change relative to the inoculum; ampicillin (bactericidal) and metergoline both cleared culture turbidity. b DiSC3(5) assay on late-log phase S. Tm grown in MHB supplemented with 10 mM EDTA to enable DiSC3(5) binding to the cytoplasmic membrane. Cells were loaded with DiSC3(5) prior to a 1 min incubation with increasing concentrations of metergoline. Bar plots depict the mean of two biological replicates, error bars indicate s.d. All groups were compared against 0 µg mL−1 metergoline via one-way ANOVA with Holm–Sidak’s multiple test correction. ****P < 0.0001. c Chequerboard broth microdilution assay showing synergy between metergoline and CCCP against S. Tm grown in MHB with 10 mM EDTA or LPM. d S. Tm grown in MHB with 1 mM EDTA to early-log phase, then exposed to metergoline for 30 min. Cellular ATP levels were estimated by luciferase activity (relative light units, RLU) normalized to optical density (OD600). Bar plots depict the mean of two biological replicates, error bars indicate s.d. Groups were compared against 0 µg mL−1 metergoline via one-way ANOVA with Holm–Sidak’s multiple test correction. ****P < 0.0001
Fig. 6
Fig. 6
In vivo efficacy of metergoline in a murine model of systemic S. Tm infection. C57BL/6 mice were infected intraperitoneally (i.p.) with ~105 CFU S. Tm. a Groups of mice were treated twice daily (every 12 h) with metergoline (5 mg kg−1, red bars) or DMSO (5% in DMEM, blue bars) by i.p. injection. Treatments were administered beginning at the time of infection. Mice were euthanized at experimental endpoint (60 h post infection). Bacterial load in the spleen, liver, cecum, and colon was determined by selective plating on streptomycin. Data shown are the means of three separate experiments (n = 5 per group). Box plot whiskers show the minimum to maximum values per group, lines in box plots show the median of each group. Groups were analyzed with a two-way ANOVA and corrected for multiple comparisons with a Holm–Sidak test. b For survival experiments, groups of mice were treated twice daily (every 12 h) beginning at the time of infection with metergoline (5 mg kg−1, red) or DMSO (5% in DMEM, blue) by i.p. injection, and were euthanized at clinical endpoint. Survival curves shown are from three separate experiments (n = 5 per group). Groups were analyzed with a Gehan–Breslow–Wilcoxon test for survival curve differences. **P<0.01, ***P<0.001

Similar articles

Cited by

References

    1. Helaine S, et al. Internalization of Salmonella by macrophages induces formation of nonreplicating persisters. Science. 2014;343:204–208. doi: 10.1126/science.1244705. - DOI - PMC - PubMed
    1. Rycroft JA, et al. Activity of acetyltransferase toxins involved in Salmonella persister formation during macrophage infection. Nat. Commun. 2018;9:1993. doi: 10.1038/s41467-018-04472-6. - DOI - PMC - PubMed
    1. Mitchell G, Isberg RR. Innate immunity to intracellular pathogens: balancing microbial elimination and inflammation. Cell Host Microbe. 2017;22:166–175. doi: 10.1016/j.chom.2017.07.005. - DOI - PMC - PubMed
    1. Ercoli, G. et al. Intracellular replication of Streptococcus pneumoniae inside splenic macrophages serves as a reservoir for septicaemia. Nat. Microbiol.3, 600–610 (2018). - PMC - PubMed
    1. Lehar SM, et al. Novel antibody–antibiotic conjugate eliminates intracellular S. aureus. Nature. 2015;527:323–328. doi: 10.1038/nature16057. - DOI - PubMed

Publication types

MeSH terms