. 2019 Jan 14;10(1):205.
doi: 10.1038/s41467-018-08066-0.

A recent increase in global wave power as a consequence of oceanic warming

Affiliations

A recent increase in global wave power as a consequence of oceanic warming

Borja G Reguero et al. Nat Commun. .

Abstract

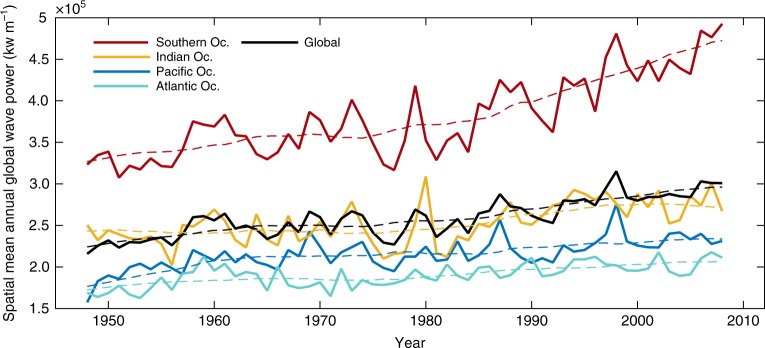
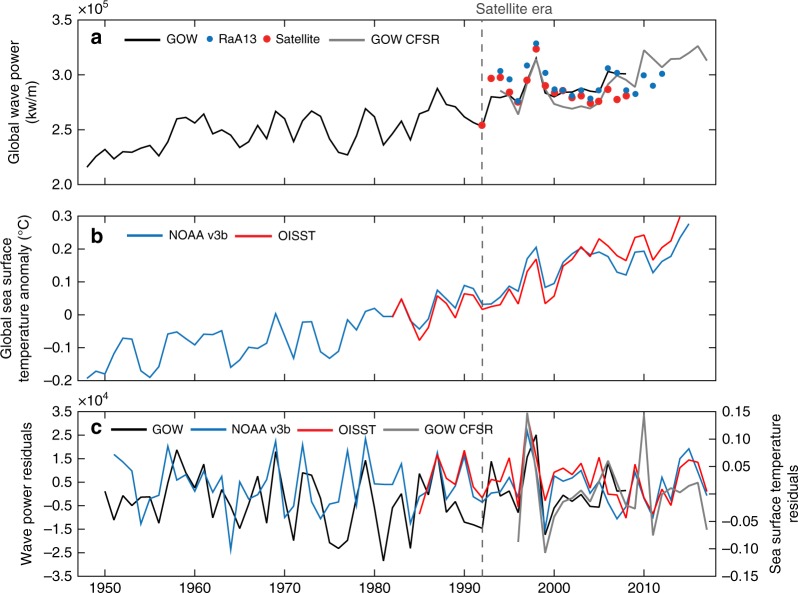
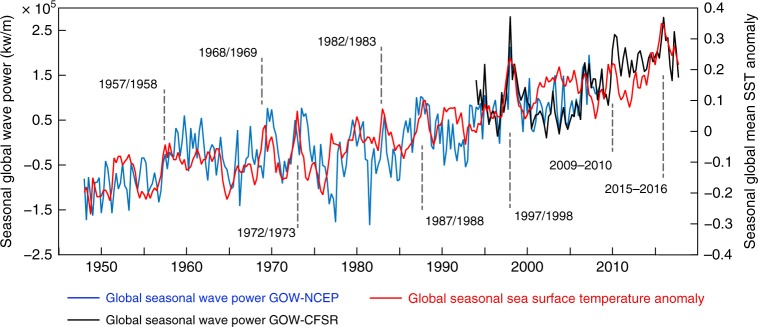
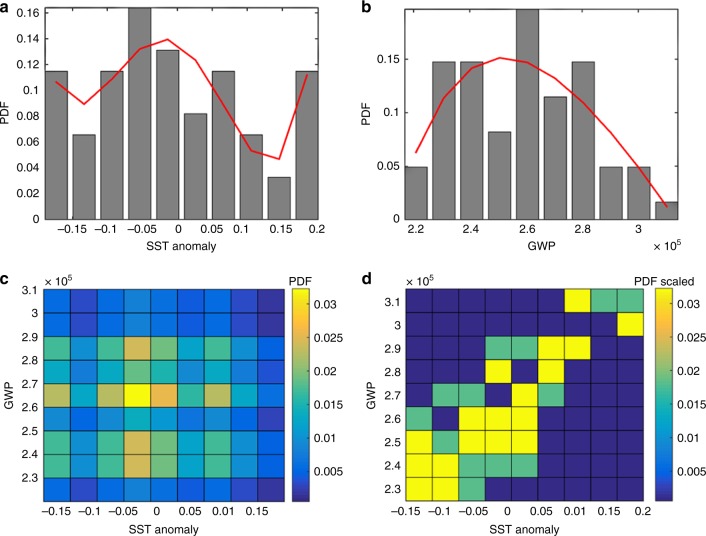
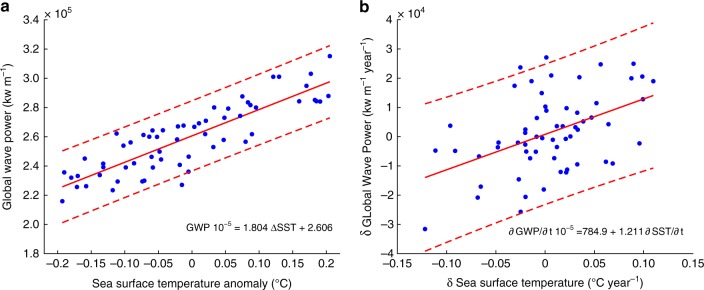
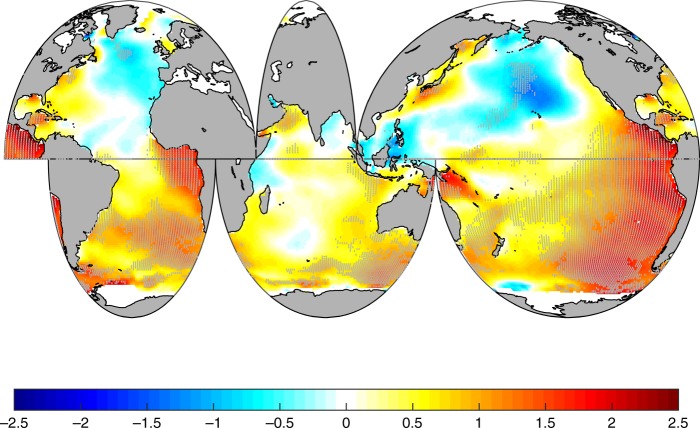
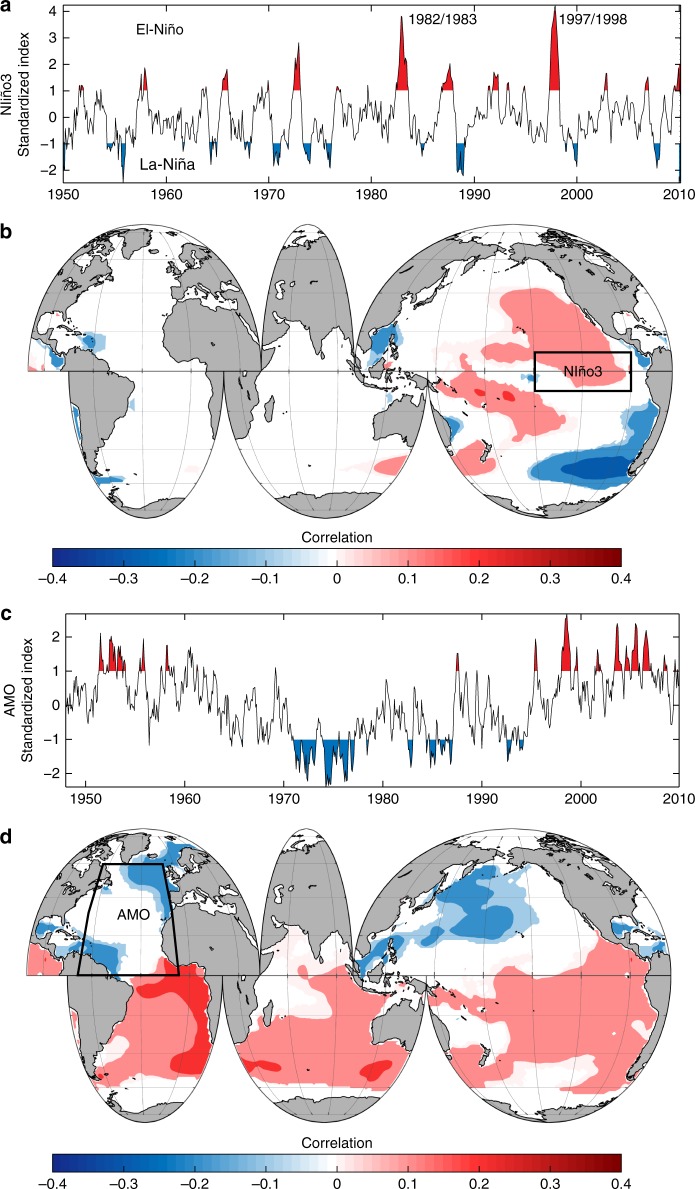
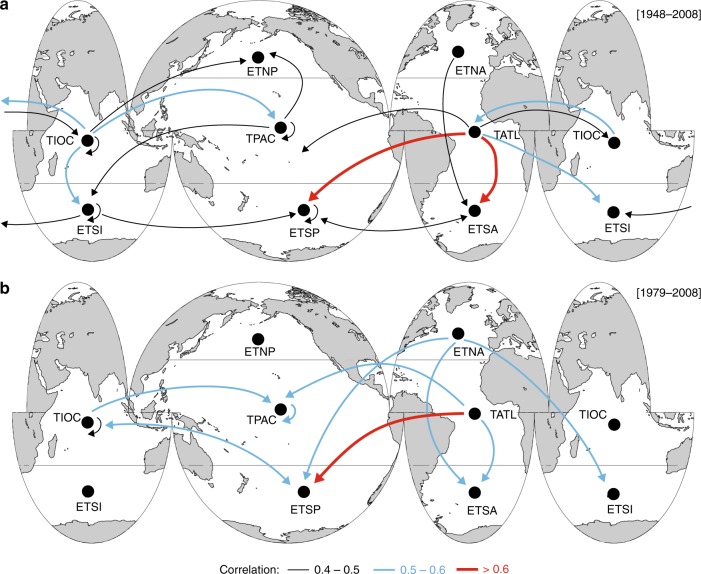
Wind-generated ocean waves drive important coastal processes that determine flooding and erosion. Ocean warming has been one factor affecting waves globally. Most studies have focused on studying parameters such as wave heights, but a systematic, global and long-term signal of climate change in global wave behavior remains undetermined. Here we show that the global wave power, which is the transport of the energy transferred from the wind into sea-surface motion, has increased globally (0.4% per year) and by ocean basins since 1948. We also find long-term correlations and statistical dependency with sea surface temperatures, globally and by ocean sub-basins, particularly between the tropical Atlantic temperatures and the wave power in high south latitudes, the most energetic region globally. Results indicate the upper-ocean warming, a consequence of anthropogenic global warming, is changing the global wave climate, making waves stronger. This identifies wave power as a potentially valuable climate change indicator.


Conflict of interest statement

The authors declare no competing interests.

Figures

Fig. 1
Fig. 1
Spatial mean annual Wave Power calculated globally and by ocean basin. The dashed lines represent the 10-year moving averages. The Southern Ocean is defined between latitudes of 40°S and 80°S. The mean regional Wave Power is calculated as the spatial average of each historical wave power time series (see Methods). The solid lines indicate each time series. The dashed lines correspond to the 10-year moving average. The time series calculated by latitudinal bands can be found in Supplementary Figure 1
Fig. 2
Fig. 2
Historical variability in oceanographic forcing. a Global Wave Power time series from GOW (black: GOW-NCEP, presented in Fig. 1; and gray: GOW-CFSR), RaA13 (blue points) and satellite altimetry (red points); b global Sea Surface Temperature time series from ERSSTv3b (blue) and OISST (red); and c non-autocorrelated residuals of Wave Power from GOW (black and gray) on left vertical axis) and Sea Surface Temperature from ERSSTv3b (blue) and OISST (red) on right vertical axis. The vertical dashed lines indicate the beginning of the era in which wave height has been measured with satellites
Fig. 3
Fig. 3
Historical seasonal variability in oceanographic forcing Global variability in the seasonal Global Wave Power (blue: GOW-NCEP; black: GOW-CFSR; left vertical axis) and Sea Surface Temperature anomalies (red line; right vertical axis). Years corresponding to strong El Niño events, that is, ones with an Oceanic Niño Index value exceeding 1.5, are annotated and overlaid on the graph
Fig. 4
Fig. 4
Analysis of the statistical dependency of Global Wave Power on the Sea Surface Temperature anomaly. Probability density functions (PDFs) of a Sea Surface Temperature (SST) anomaly and b Global Wave Power (GWP); c the product of their marginal distributions; and d their joint distribution (scaled to the values in c). The bar plots in a and b represent the empirical PDF, while the red lines represent a PDF fitted to the data
Fig. 5
Fig. 5
Regression between the Sea Surface Temperature anomaly and Global Wave Power. a Regression between the global time series of Sea Surface Temperature anomalies (ºC) and Global Wave Power (kw/m); b regression between the annual rates of change in Sea Surface Temperature (ºCyear-1) and Global Wave Power (kw m−1 year−1). The solid red lines represent the linear regression lines (equations are noted in each plot). The red dashed lines represent the 95% confidence intervals for each regression line. Both regression lines are statistically significant at the 95% level. The blue dots represent the data for the period 1948–2008
Fig. 6
Fig. 6
Spatial trend (percent change per year) in mean Wave Power from 1985 to 2008. Hatched areas represent points that are statistically significant at the 95% confidence level according to the Mann–Kendall test and the Wang and Swail method for autocorrelation (see Methods). The trends are calculated for the period 1985–2008 (period with satellite-derived wave data) for comparison with. Supplementary Figure 5 shows the spatial trends for other periods in the historical record
Fig. 7
Fig. 7
Influence of Sea Surface Temperature climate indices on Wave Power. a Time series of Niño3 standardized index; b spatial correlation pattern of Niño3 with Wave Power; c time series of the AMO standardized index; and d spatial correlation pattern of the Atlantic Multidecadal Oscillation (AMO) with Wave Power. The Niño3 index registers Sea Surface Temperature anomalies in the tropical Pacific (90°-150ºW, 5ºS-5ºN). The red and blue colored areas in a and c represent moderate or above events (with absolute value of index of 1 or above) for each corresponding climate index. For the correlation maps b and d, only the linear correlations that are significant at the 95% level are shown. The polygons represented in the maps in b and d identify the areas in which each index is calculated based on Sea Surface Temperature anomalies (see Methods)
Fig. 8
Fig. 8
Maps of the inter-regional correlations between Sea Surface Temperature and Wave Power. Spatial map of the correlations between the regionally-averaged seasonal time series of Sea Surface Temperature and Wave Power for the periods a 1948–2008 and b 1979–2008. The arrows size and color indicate the maximum correlation coefficient between the regional Sea Surface Temperature in the origin region (from) with the seasonal Wave Power in the target region (to). Only the correlations that are significant at the 95% level are shown. The correlation coefficients correspond to the maximum values in Table 1. The ocean sub-basins correspond to: extratropical North Pacific (ETNP), tropical Pacific (TPAC), extratropical South Pacific (ETSP), extratropical North Atlantic (ETNA), tropical Atlantic (TATL), extratropical South Atlantic (ETSA), tropical Indian Ocean (TIOC) and extratropical South Indian Ocean (ETSI). Equivalent results for the time series during the satellite era (1979–2008) and the non-autocorrelated residuals can be found in the Supplementary Tables 3 to 6

References

    1. IPCC. Climate Change 2013: The Physical Science Basis. Contribution of Working Group I to the Fifth Assessment Report of the Intergovernmental Panel on Climate Change. (Cambridge University Press, Cambridge, 2013).
    1. Wong, P. P. et al. Coastal systems and low-lying areas. Climate Change 2014: Impacts, Adaptation, and Vulnerability. Part B: Regional Aspects. Contribution of Working Group II to the Fifth Assessment Report of the Intergovernmental Panel on Climate Change. 361–409 (Cambridge University Press, Cambridge, 2014).
    1. Storlazzi, C. D. et al. Most atolls will be uninhabitable by the mid-21st century because of sea-level rise exacerbating wave-driven flooding. Sci. Adv. 4, (2018). - PMC - PubMed
    1. Melet A, Meyssignac B, Almar R, Le Cozannet G. Under-estimated wave contribution to coastal sea-level rise. Nat. Clim. Chang. 2018;8:234–239. doi: 10.1038/s41558-018-0088-y. - DOI
    1. Fan Y, Held IM, Lin SJ, Wang XL. Ocean warming effect on surface gravity wave climate change for the end of the twenty-first century. J. Clim. 2013;26:6046–6066. doi: 10.1175/JCLI-D-12-00410.1. - DOI

Publication types