. 2019 Jan 14;10(1):206.
doi: 10.1038/s41467-018-08214-6.

Controlling the fluorescence and room-temperature phosphorescence behaviour of carbon nanodots with inorganic crystalline nanocomposites

Affiliations

Controlling the fluorescence and room-temperature phosphorescence behaviour of carbon nanodots with inorganic crystalline nanocomposites

David C Green et al. Nat Commun. .

Abstract

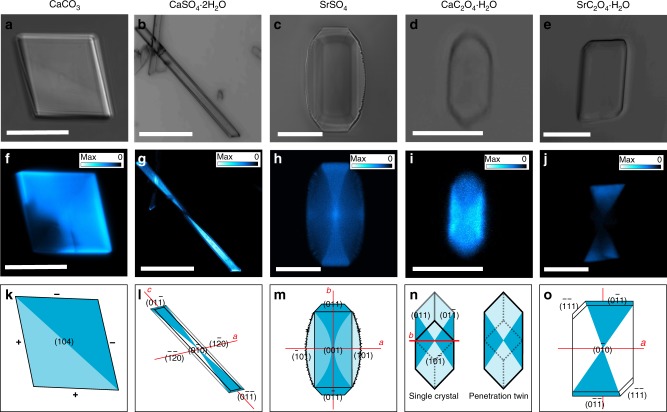
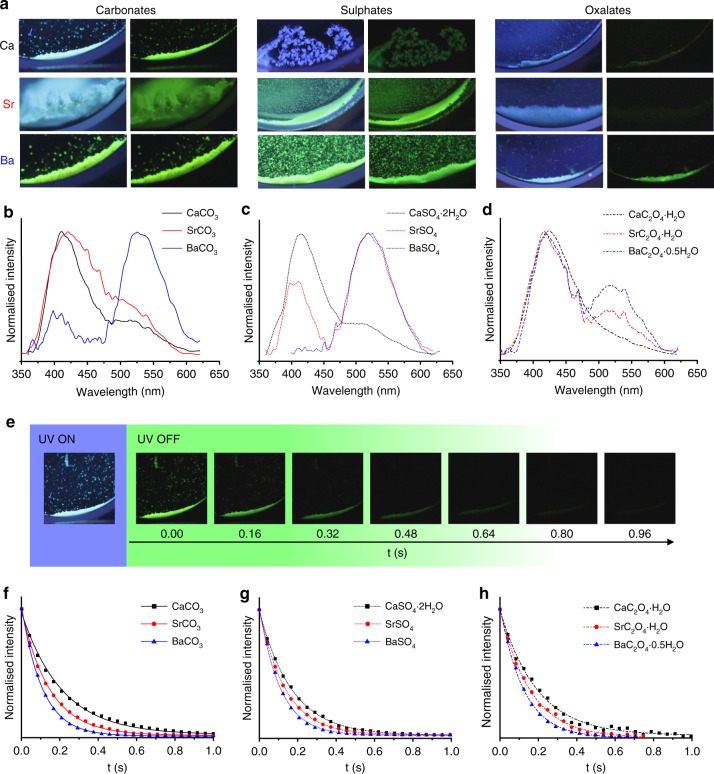
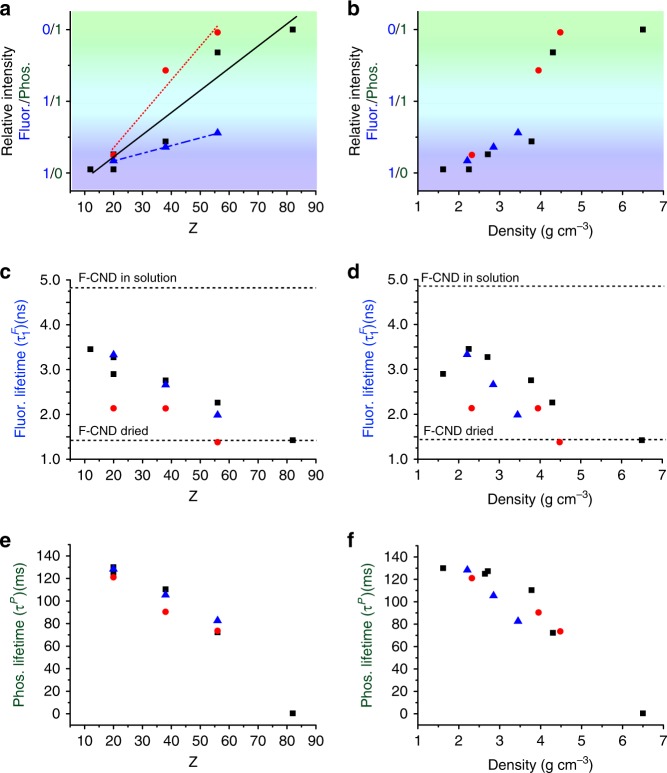
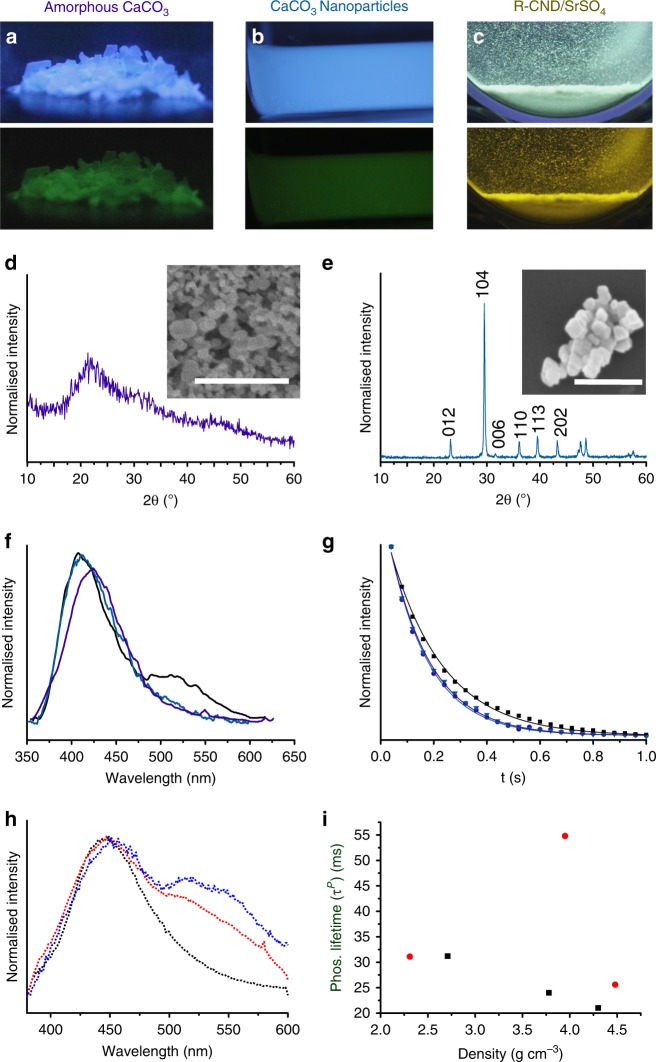
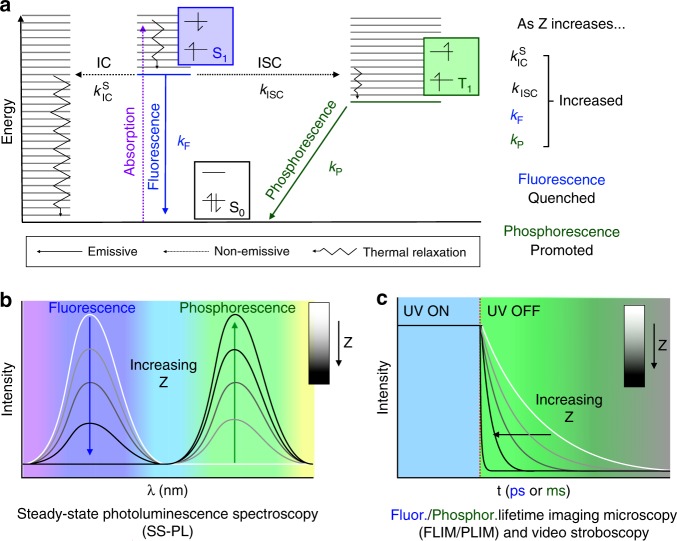
There is a significant drive to identify alternative materials that exhibit room temperature phosphorescence for technologies including bio-imaging, photodynamic therapy and organic light-emitting diodes. Ideally, these materials should be non-toxic and cheap, and it will be possible to control their photoluminescent properties. This was achieved here by embedding carbon nanodots within crystalline particles of alkaline earth carbonates, sulphates and oxalates. The resultant nanocomposites are luminescent and exhibit a bright, sub-second lifetime afterglow. Importantly, the excited state lifetimes, and steady-state and afterglow colours can all be systematically controlled by varying the cations and anions in the host inorganic phase, due to the influence of the cation size and material density on emissive and non-emissive electronic transitions. This simple strategy provides a flexible route for generating materials with specific, phosphorescent properties and is an exciting alternative to approaches relying on the synthesis of custom-made luminescent organic molecules.


Conflict of interest statement

The authors declare no competing interests.

Figures

Fig. 1
Fig. 1
Visualising the integration of folic acid-derived carbon nanodots (F-CNDs) in inorganic single crystals. Optical microscopy images (a-e), confocal fluorescence microscopy (CFM) images (f-j), and distribution models (k-o) of CaCO3 (a,f, k), CaSO4·2H2O (b, g, l), SrSO4 (c, h, l), CaC2O4·H2O (d, i, n), and SrC2O4·H2O (e, j, o). All CFM images have accompanying look-up table (LUT) scales signifying PL intensity, from white (max) to cyan to blue to black (zero). Scale bars: 20 µm (a,c, f, h), 150 µm (b, g), 5 µm (d, i) and 10 µm (e, j)
Fig. 2
Fig. 2
Characterisation of the photoluminescent (PL) behaviour of folic acid-derived carbon nanodot (FF-CND)/host composites. Photographs of the nine F-CND/host nanocomposites with, and immediately after the removal of, UV (365 nm) excitation (a). Steady-state photoluminescence (SS-PL) emission spectra (λex = 320 nm) of Ca (black) Sr (red) and Ba (blue) carbonates (b, solid line), sulphates (c, dotted line), and oxalates (d, dashed line) F-CND/host nanocomposites. Images obtained during video stroboscopy experiments of afterglow from F-CND/CaCO3 nanocomposite (e). UV ON: Nanocomposite under UV (365 nm) excitation showing steady-state luminescence. UV OFF: Photographs of the afterglow at different times (160 ms intervals) showing a decay in afterglow intensity with time. Decay curves obtained from video stroboscopy for Ca (black square), Sr (red circle), and Ba (blue triangle) carbonates (f, solid line), sulphates (g, dotted line), and oxalates (h, dashed line) F-CND/host nanocomposites
Fig. 3
Fig. 3
The relationship between host structure and photoluminescent (PL) behaviour in folic acid-derived carbon nanodot (FF-CND)/host nanocomposites. Plots of relative room temperature phosphorescence (RTP) intensity values (a, b), fluorescence (τ1F) lifetimes derived from fluorescence lifetime imaging microscopy (FLIM) decay curves (c, d) and phosphorescence (τP) lifetimes derived from video stroboscopy decay curves (e, f) of F-CND-rich carbonates (black square/solid line), sulphates (red circle/dotted line), and oxalates (blue triangle/dashed line) against cation Z (a, c, e) and density (b, d, f) of the host mineral phase. The background colour in a and b represents approximately the steady-state PL (SS-PL) observed from photographs obtained from composites under UV (365 nm) excitation. Values for τ1F for F-CND aqueous solution and dried F-CND are given on c and d
Fig. 4
Fig. 4
Exploring the impact of host phase synthesis and carbon nanodot (CND) precursors on photoluminescent (PL) behaviour. Photographs with, and immediately after the removal of, UV (365 nm) excitation of folic acid-derived CND (F-CND) nanocomposites with a amorphous CaCO3 (amorphous calcium carbonate (ACC)) and b calcite (CaCO3) nanoparticles, and c riboflavin–derived CND (R-CND) nanocomposites with SrSO4. Powder X-ray diffraction (pXRD) patterns of d ACC and e CaCO3 nanoparticles, where the peaks are indexed to calcite. Scanning electron microscopy (SEM) micrographs of nanocomposites are given as insets. (f) Steady-state photoluminescence (SS-PL) emission spectra (λex = 320 nm) for ACC (purple) and CaCO3 nanoparticles (cyan) (Calcite (λex = 320 nm, black), where the SS-PL spectrum is given for comparison. g Video stroboscopy decay plots for F-CND/ACC (purple circle) and F-CND/CaCO3 nanoparticles (cyan inverted triangle)(F-CND/calcite (black square) given for comparison). h SS-PL emission spectra (λex = 380 nm) of R-CND/CaSO4 2H2O (dotted black), R-CND/SrSO4 (dotted red) and R-CND/BaSO4 (dotted blue). i Time-resolved phosphorescence microscopy (TRPM) lifetime measurements for R-CND/inorganic host nanocomposites compared with host density (carbonates (black squares) and sulphates (red circles)). The outlier is R-CND/SrSO4. Scale bars: 500 nm (d) and 300 nm (e)
Fig. 5
Fig. 5
The mechanism for PL behaviour modification in carbon nanodot (CND)/host nanocomposites. Modified Jablonski diagram indicating electronic states (S0 (black), S1 (blue), and T1 (green) and their relative energy levels; electronic transitions (non-emissive absorption (dotted purple), intersystem crossed (ISC, dotted black), internal conversion (IC, dotted black), and thermal relaxations (jagged black); and emissive fluorescence (solid blue) and phosphorescence (solid green)) and associated rate constants; and electronic spin states (a). The effect of increasing Z on rate constants is summarised in a. The implications of increasing Z on fluorescence and phosphorescence intensities (b) and lifetimes (c) are summarised with photoluminescent (PL) spectra (b) and decay curves (c). PL spectra and decay curves are given in greyscale, from low Z (white) to high Z (black)
Fig. 6
Fig. 6
Dependence of room temperature phosphorescence activation on the crystal phase. Time-resolved phosphorescence microscopy images with UV excitation (a) on and (b) 5 ms after the removal of UV excitation, and (c) intensity vs time plots for calcite (black square) and vaterite (brown triangle)-based RTP nanocomposites. The plot in (c) shows the intensity with UV light on and off, and the point at which the light is removed is shown with a vertical red line at t = 0. The normalised decay curves for calcite and vaterite overlap, indicating identical phosphorescent lifetimes (inset; scale bar 50 μm)
Fig. 7
Fig. 7
Fine control over folic acid-derived carbon nanodot (F-CND) photoluminescent (PL) properties by changing the composition of the host crystal. a Photographs with, and immediately after the removal of, UV (365 nm) excitation of F-CND nanocomposites with different Ca/Sr/BaCO3 solid solutions as labelled. b X-ray diffraction (XRD) patterns in the range 2θ = 23–27° of samples, where the peak centre for [111] reflection is shown to move to a smaller angle with an increasing average Z of the host. c Relative room temperature phosphorescence (RTP) intensity values obtained from background-subtracted normalised SS-PL spectra showing the progressive activation of RTP with increasing Z. d Lifetime measurements obtained by video stroboscopy showing shorter lifetimes as Z increases. e Fluorescence quantum yields decrease with Z, whereas phosphorescence/RTP quantum yields increase with Z. Overall, the total quantum yield falls.

References

    1. Matsuzawa T, Aoki Y, Takeuchi N, Murayama Y. New long phosphorescent phosphor with high brightness, SrAl2O4:Eu2+,Dy3+ J. Electrochem. Soc. 1996;143:2670–2673. doi: 10.1149/1.1837067. - DOI
    1. Hirata S. Recent advances in materials with room temperature phosphorescence: photophysics for triplet exciton stabilization. Adv. Opt. Mater. 2017;5:1700116. doi: 10.1002/adom.201700116. - DOI
    1. Mukherjee S, Thilagar P. Recent advances in purely organic phosphorescent materials. Chem. Commun. 2015;51:10988–11003. doi: 10.1039/C5CC03114A. - DOI - PubMed
    1. Bolton O, Lee K, Kim HJ, Lin KY, Kim J. Activating efficient phosphorescence from purely organic materials by crystal design. Nat. Chem. 2011;3:205–210. doi: 10.1038/nchem.984. - DOI - PubMed
    1. An ZF, et al. Stabilizing triplet excited states for ultralong organic phosphorescence. Nat. Mater. 2015;14:685–690. doi: 10.1038/nmat4259. - DOI - PubMed

Publication types