. 2019 Jan 14;10(1):181.
doi: 10.1038/s41467-018-08097-7.

Prostaglandin E2 mediates sensory nerve regulation of bone homeostasis

Affiliations

Prostaglandin E2 mediates sensory nerve regulation of bone homeostasis

Hao Chen et al. Nat Commun. .

Abstract

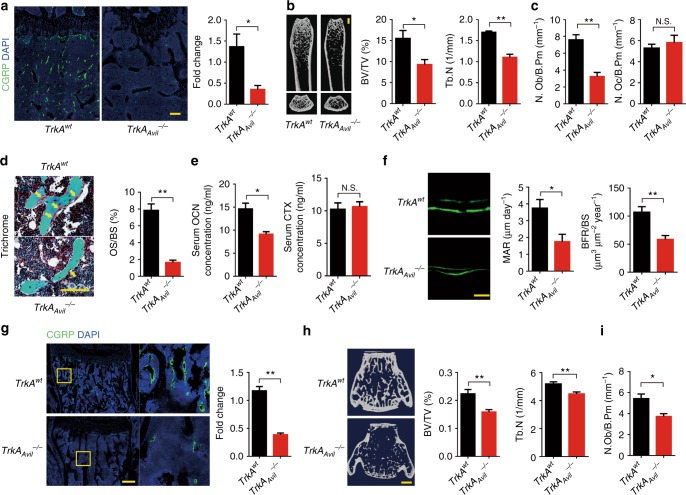
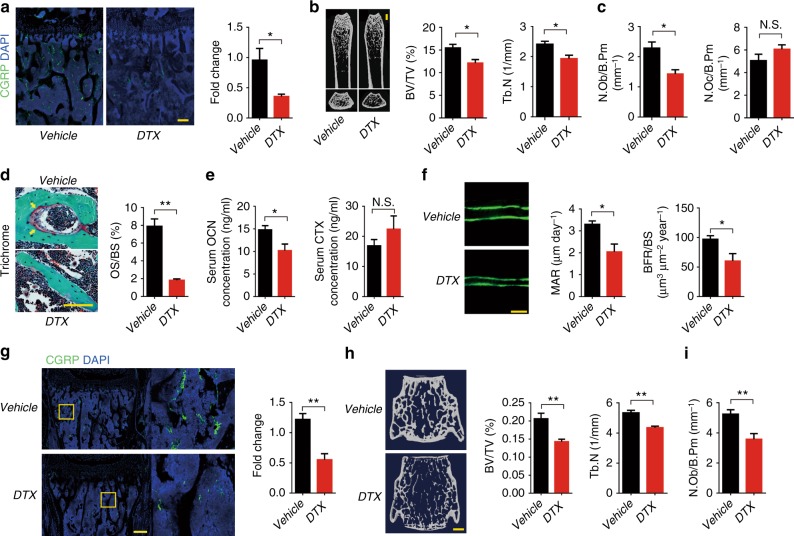
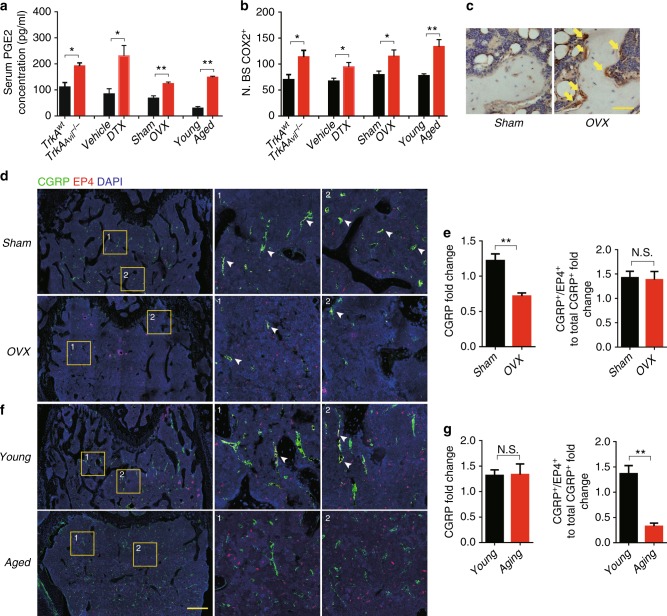
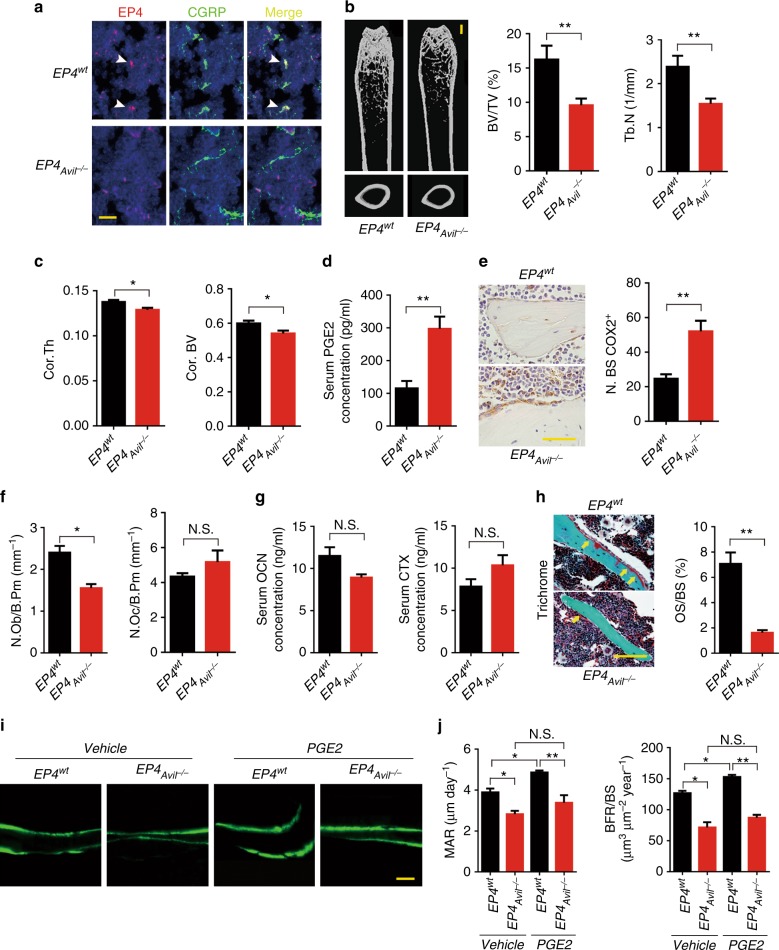
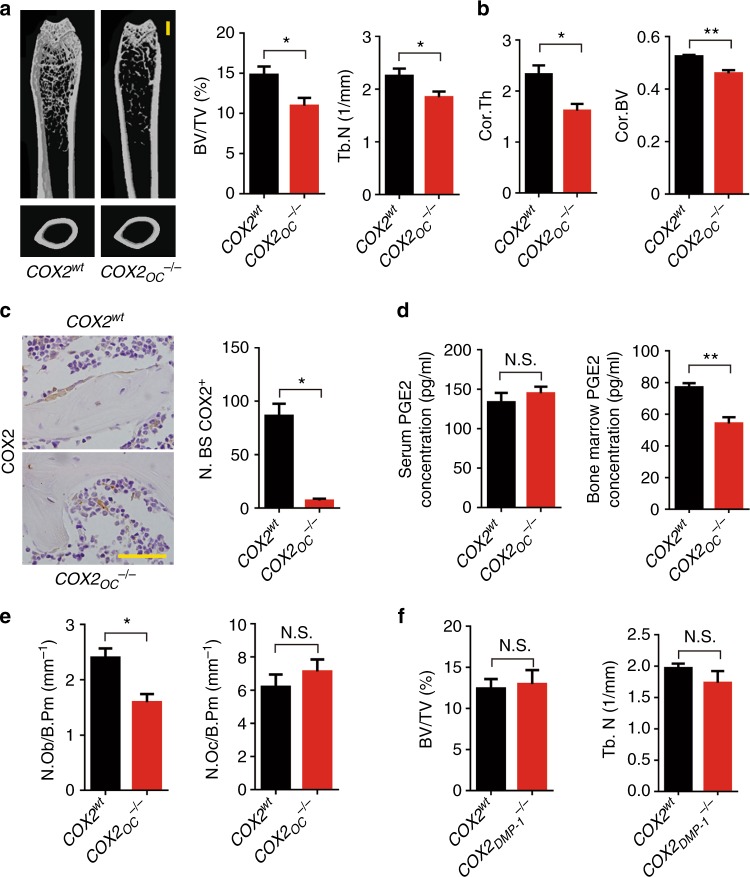
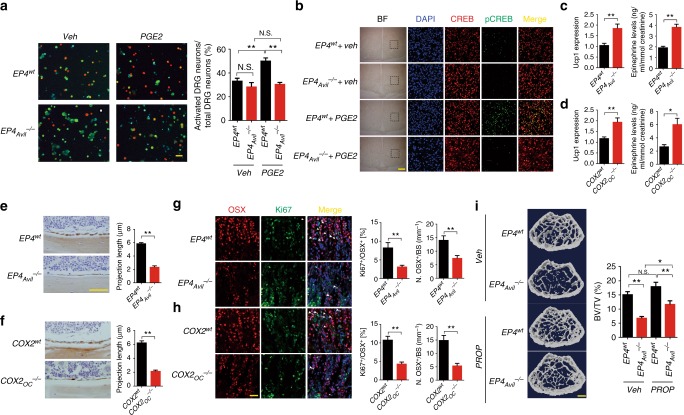
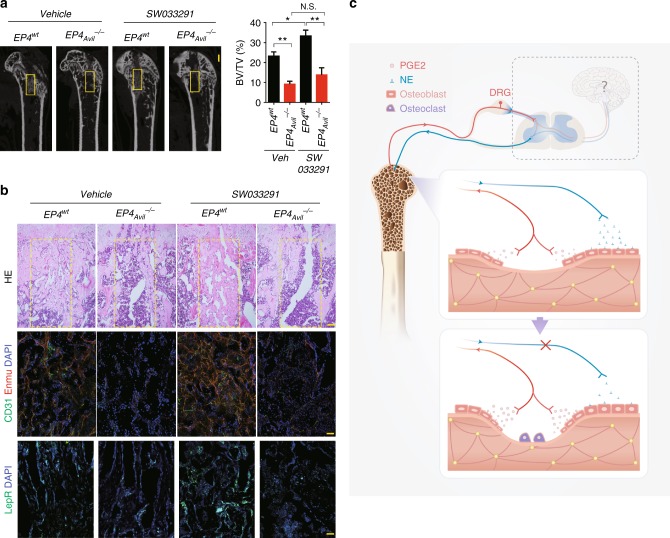
Whether sensory nerve can sense bone density or metabolic activity to control bone homeostasis is unknown. Here we found prostaglandin E2 (PGE2) secreted by osteoblastic cells activates PGE2 receptor 4 (EP4) in sensory nerves to regulate bone formation by inhibiting sympathetic activity through the central nervous system. PGE2 secreted by osteoblasts increases when bone density decreases as demonstrated in osteoporotic animal models. Ablation of sensory nerves erodes the skeletal integrity. Specifically, knockout of the EP4 gene in the sensory nerves or cyclooxygenase-2 (COX2) in the osteoblastic cells significantly reduces bone volume in adult mice. Sympathetic tone is increased in sensory denervation models, and propranolol, a β2-adrenergic antagonist, rescues bone loss. Furthermore, injection of SW033291, a small molecule to increase PGE2 level locally, significantly boostes bone formation, whereas the effect is obstructed in EP4 knockout mice. Thus, we show that PGE2 mediates sensory nerve to control bone homeostasis and promote regeneration.


Conflict of interest statement

The authors declare no competing interests.

Figures

Fig. 1
Fig. 1
Osteoblastic bone formation is reduced without sensory nerve innervation. a Representative images of immunofluorescence staining and quantitative analysis of the CGRP+ sensory nerves (green) in the femurs of 12-week-old TrkAwt and TrkAAvil−/− mice. DAPI stains nuclei blue. Scale bar: 100 μm. b Representative micro-computed tomography (μCT) images of femurs from 12-week-old male TrkAwt and TrkAAvil−/− mice. Quantitative analysis of trabecular bone fraction (Tb. BV/TV) and trabecular number (Tb. N). Scale bar: 1 mm. c Histomorphological analysis of osteoblast (N.Ob/B.Pm) and osteoclast (N.Oc/B.Pm) numbers on the trabecular bone surface of femurs of 12-week-old TrkAwt and TrkAAvil−/− mice. d Trichrome staining and quantitative analysis of osteoid surface per bone surface (OS/BS) in femoral bone tissue from 12-week-old TrkAwt and TrkAAvil−/− mice. Scale bar, 50 μm. e ELISA analysis of serum OCN and CTX levels in 12-week-old TrkAwt and TrkAAvil−/− mice. f Representative images of calcein double labeling of trabecular bone of femurs with quantification of mineral apposition rate and bone formation rate in 12-week-old TrkAwt and TrkAAvil−/− mice. Scale bar, 20 μm. g Representative images of immunofluorescence staining and quantitative analysis of the CGRP+ sensory nerves (green) in the vertebrae of 12-week-old TrkAwt and TrkAAvil−/− mice. DAPI stains nuclei blue. Scale bar: 100 μm. h Representative μCT images of vertebra from 12-week-old TrkAwt and TrkAAvil−/− mice. Quantitative analysis of trabecular bone fraction (Tb. BV/TV) and trabecular number (Tb. N). Scale bar: 1 mm. i Histomorphological analysis of osteoblast (N.Ob/B.Pm) numbers on the trabecular bone surface of 12-week-old TrkAwt and TrkAAvil−/− mice vertebra. N ≥ 5 per group. *P < 0.05, **P < 0.01 and N.S. means not significant. (Student t-test)
Fig. 2
Fig. 2
Osteoblastic bone formation is blunted after sensory denervation. a Representative images of immunofluorescence staining and quantitative analysis of the CGRP+ sensory nerves in the femurs of 8-week-old iDTRAvil+/− mice injected with vehicle or 1 ug per kg per day DTX 3 time a week for four consecutive weeks. Scale bar: 100 μm. b Representative μCT images of femurs from iDTRAvil+/− mice injected with vehicle or DTX. Quantitative analysis of trabecular bone fraction and trabecular number. Scale bar: 1 mm. c Histomorphological analysis of the osteoblast (N.Ob/B.Pm) and osteoclast (N.Oc/B.Pm) numbers on the trabecular bone surface of femurs of iDTRAvil+/− mice injected with vehicle or DTX. d Representative trichrome staining and quantitative analysis of OS/BS in femoral bone tissue from iDTRAvil+/− mice injected with vehicle or DTX. Scale bar, 50 μm. e ELISA analysis of serum OCN and CTX levels in iDTRAvil+/− mice injected with vehicle or DTX. f Representative images of calcein double labeling of femoral trabecular bone with quantification of MAR and BFR in iDTRAvil+/− mice injected with vehicle or DTX. Scale bar, 20 μm. g Representative images of immunofluorescence staining and quantitative analysis of the CGRP+ sensory nerves (green) in the vertebra of iDTRAvil+/− mice injected with vehicle or DTX. DAPI stains nuclei blue. Scale bar: 100 μm. h Representative μCT images of vertebrae from iDTRAvil+/− mice injected with vehicle or DTX. Quantitative analysis of trabecular bone fraction (Tb. BV/TV) and trabecular number (Tb. N). Scale bar: 1 mm. i Histomorphological analysis of osteoblast (N.Ob/B.Pm) numbers on the trabecular bone surface of 12-week-old TrkAwt and TrkAAvil−/− mice vertebra. N ≥ 5 per group. *P < 0.05, **P < 0.01 and N.S. means not significant. (Student t-test)
Fig. 3
Fig. 3
Elevated PGE2 secretion from osteoblasts with sensory nerve dysfunction. a ELISA analysis of serum PGE2 levels in mice with different treatments, including TrkAwt and TrkAAvil−/− mice; iDTRAvil+/− mice injected with vehicle or DTX; young (2-month-old) and aged (12-month-old) mice; mice with sham or ovariectomy surgery (OVX) for 8 weeks. b Quantitative analysis of the COX2+ cells (brown) on trabecular surface of femoral bone from different mice models, including TrkAwt and TrkAAvil−/− mice; iDTRAvil+/− mice injected with vehicle or DTX; young (2-month-old) and aged (12-month-old) mice; and mice with sham or ovariectomy surgery (OVX) for 8 weeks. c Representative images of immunostaining of the COX2+ cells (brown) on trabecular surface of femoral bone from mice with sham or OVX for 8 weeks. Scale bar, 20 μm. d, e Representative double-immunofluorescent staining imaged and quantitative analysis of EP4 (red) and CGRP (green) in femurs from mice underwent sham or OVX surgery. Scale bar: 100 μm. f, g Representative double-immunofluorescent staining images and quantitative analysis of EP4 (red) and CGRP (green) in femurs from young and aged mice. Scale bar: 100 μm. N ≥ 5 per group. *P < 0.05, **P < 0.01 and N.S. means not significant. (Student t-test)
Fig. 4
Fig. 4
Deletion of PGE2 receptor EP4 in sensory nerve results in bone loss. a Double-immunofluorescence images of femoral bone sections from 12-week-old EP4wt or EP4Avil−/− mice using antibodies against EP4 (red) and CGRP (green). DAPI stains nuclei blue. Scale bar, 50 μm. b, c Representative μCT images of femurs from 12-week-old EP4wt and EP4Avil−/− mice. Quantitative analysis of trabecular bone fraction (Tb. BV/TV), trabecular number (Tb. N), cortical thickness (Ct. Th), and cortical bone volume (Cor. BV). d ELISA analysis of serum PGE2 level in 12-week-old EP4wt and EP4Avil−/− mice. e Representative images of immunostaining and quantitative analysis of the COX2+ cells (in brown) on trabecular bone surface of femoral bone from 12-week-old EP4wt and EP4Avil−/− mice. Scale bar, 20 μm. f Histomorphological analysis of osteoblast (N.Ob/B.Pm) and osteoclast (N.Oc/B.Pm) numbers on the trabecular bone surface of femurs of 12-week-old EP4wt and EP4Avil−/− mice. g ELISA analysis of serum OCN and CTX levels in 12-week-old EP4wt and EP4Avil−/− mice. h Representative trichrome staining and quantitative analysis of osteoid surface per bone surface (OS/BS) in femoral bone tissue of 12-week-old EP4wt and EP4Avil−/− mice. Scale bar, 50 μm. i, j Ten-week-old EP4wt and EP4Avil−/− mice were injected with vehicle or 3 mg per kg per day PGE2 for 3 consecutive days, and bone samples were harvested 12 days after injection. Calcein was injected 5 days and 1 day before sacrifice. Representative images of calcein double labeling of femoral trabecular bone with quantification of mineral apposition rate (MAR) and bone formation rate (BFR). Scale bar, 20 μm. N ≥ 5 per group. *P < 0.05, **P < 0.01 and N.S. means not significant. (Student t-test, except j with ANOVA)
Fig. 5
Fig. 5
Ablation of COX2 in osteoblasts leads to reduced bone formation. a Representative μCT images of the femurs of 12-week-old COX2wt and COX2OC−/− mice. Quantitative analysis of the trabecular bone fraction (Tb. BV/TV) and trabecular number (Tb. N). Scale bar: 1 mm. b Quantitative analysis of cortical thickness (Ct. Th) and cortical bone volume (Cor. BV). c Representative images of immunostaining and quantitative analysis of the COX2+ cells (brown) on trabecular bone surface of femoral bone from 12-week-old COX2wt and COX2OC−/− mice. Scale bar, 20 μm. d ELISA analysis of the serum and bone marrow PGE2 in 12-week-old COX2wt and COX2OC−/− mice. e Histomorphological analysis of osteoblast (N.Ob/B.Pm) and osteoclast (N.Oc/B.Pm) numbers on the trabecular bone surface of 12-week-old COX2wt and COX2OC−/− mice. f Quantitative analysis of the trabecular bone fraction (Tb. BV/TV) and trabecular number (Tb. N) of the femurs from COX2wt and COXDMP-1−/− mice. N ≥ 5 per group. *P < 0.05, **P < 0.01 and N.S. means not significant. (Student t-test)
Fig. 6
Fig. 6
PGE2 stimulates hypothalamic CREB signaling through sensory nerve. a Representative images of DRG neurons isolated from EP4wt and EP4Avil−/− mice pre-incubated with vehicle or 10 μM PGE2 for 5 min, and subsequently treated with calcium imaging buffer (with calcium loaded). The red dots represent activated DRG neurons, and the green dots represent resting DRG neurons. Scale bar, 50 μm. Quantitative analysis was performed with results from three independent assays. b Double-immunofluorescence images of hypothalamus tissue sections from 12-week-old EP4wt or EP4Avil−/− mice with vehicle or 3 mg per kg PGE2 treatment for 6 h using antibodies against CREB (red) and p-CREB (green). DAPI stains nuclei blue. Scale bar, 20 μm. c qRT-PCR analysis of UCP1 expression in adipose tissue and ELISA evaluation of epinephrine level of the serum from EP4wt and EP4Avil−/− mice. d qRT-PCR analysis of UCP1 expression in adipose tissue and ELISA evaluation of epinephrine level of the serum from COX2wt and COX2OC−/− mice. e, f Representative images of immunostaining of the femoral bone tissue sections from EP4wt and EP4Avil−/− and COX2wt and COX2OC−/− mice with antibody against OCN. Scale bar, 50 μm. Projection length of the OCN+ lining cells was measured. g, h Double-immunofluorescence images of femoral bone tissue sections from 12-week-old COX2wt and COX2OC−/− and EP4wt and EP4Avil−/− mice using antibodies against OSX (red) and Ki67 (green). DAPI stains nuclei blue. Scale bar, 20 μm. Percentage of Osx- and Ki67-double positive cells and the number of OSX positive cells per trabecular bone surface were quantified. i 8-week-old male EP4wt and EP4Avil−/− mice were injected with low dose (0.5 mg per kg per day) propranolol for 6 weeks. Representative images and quantitative analysis of the μCT images of femurs. Scale bar: 1 mm. N ≥ 5 per group. *P < 0.05, **P < 0.01 and N.S. means not significant. (Student t-test for bh, ANOVA for ai)
Fig. 7
Fig. 7
PGE2 promotes regeneration through sensory nerve. a μCT analysis of bone regeneration after femoral bone marrow ablation in 12-week-old EP4wt and EP4Avil−/− mice treated with 10 mg per kg per day SW033291 or vehicle. Scale bar: 1 mm. Selected areas for the measurements of bone volume (BV)/tissue volume (TV) were indicated with a yellow square. b Representative images of hematoxylin-eosin staining, double immunofluorescence analysis of CD31+ Emcn+ cells, and immunofluorescence analysis of Leptin receptor (LepR)+ cells in the regeneration area. Scale bar, 100 μm. c Graphic illustration of this study. When bone density decreases by osteoclast bone resorption, PGE2 secretion by osteoblastic cells increases at bone remodeling sites. PGE2 activates EP4 receptor at sensory nerve to tune down sympathetic tones for osteoblast differentiation at the bone remodeling microenvironment. The sensory nerve controlling process is likely a temporal-spatial precision action. N ≥ 5 per group. *P < 0.05, **P < 0.01 and N.S. means not significant. (ANOVA)

Comment in

  • Sensing bone mass.
    Bernard NJ. Bernard NJ. Nat Rev Rheumatol. 2019 Mar;15(3):128. doi: 10.1038/s41584-019-0181-2. Nat Rev Rheumatol. 2019. PMID: 30728449 No abstract available.

Similar articles

Cited by

References

    1. Pinho-Ribeiro FA, Verri WA, Jr., Chiu IM. Nociceptor sensory neuron-immune interactions in pain and inflammation. Trends Immunol. 2017;38:5–19. doi: 10.1016/j.it.2016.10.001. - DOI - PMC - PubMed
    1. Snyder DJ, Bartoshuk LM. Oral sensory nerve damage: causes and consequences. Rev. Endocr. Metab. Disord. 2016;17:149–158. doi: 10.1007/s11154-016-9377-9. - DOI - PMC - PubMed
    1. Engblom, C. et al. Osteoblasts remotely supply lung tumors with cancer-promoting SiglecF(high) neutrophils. Science358, 10.1126/science.aal5081 (2017). - PMC - PubMed
    1. Karner, C. M. & Long, F. Glucose metabolism in bone. Bone, 10.1016/j.bone.2017.08.008 (2017). - PMC - PubMed
    1. Kushwaha, P., Wolfgang, M. J. & Riddle, R. C. Fatty acid metabolism by the osteoblast. Bone, 10.1016/j.bone.2017.08.024 (2017). - PMC - PubMed

Publication types

MeSH terms