. 2019 Jan 14;10(1):190.
doi: 10.1038/s41467-018-08122-9.

Mature IgDlow/- B cells maintain tolerance by promoting regulatory T cell homeostasis

Affiliations

Mature IgDlow/- B cells maintain tolerance by promoting regulatory T cell homeostasis

Avijit Ray et al. Nat Commun. .

Abstract

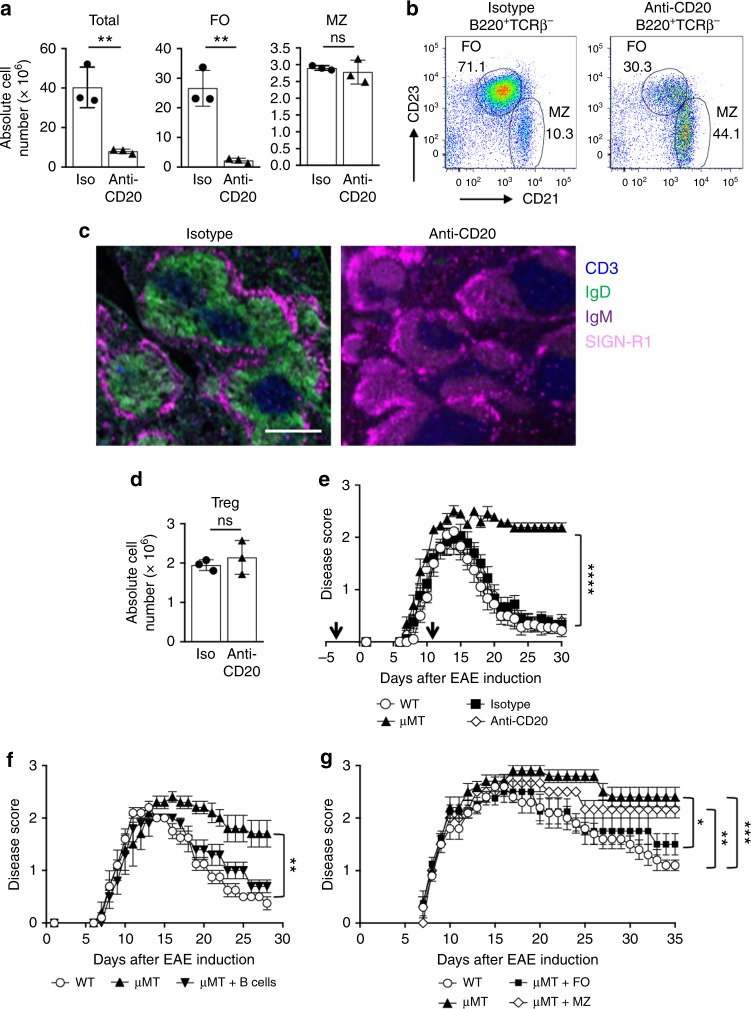
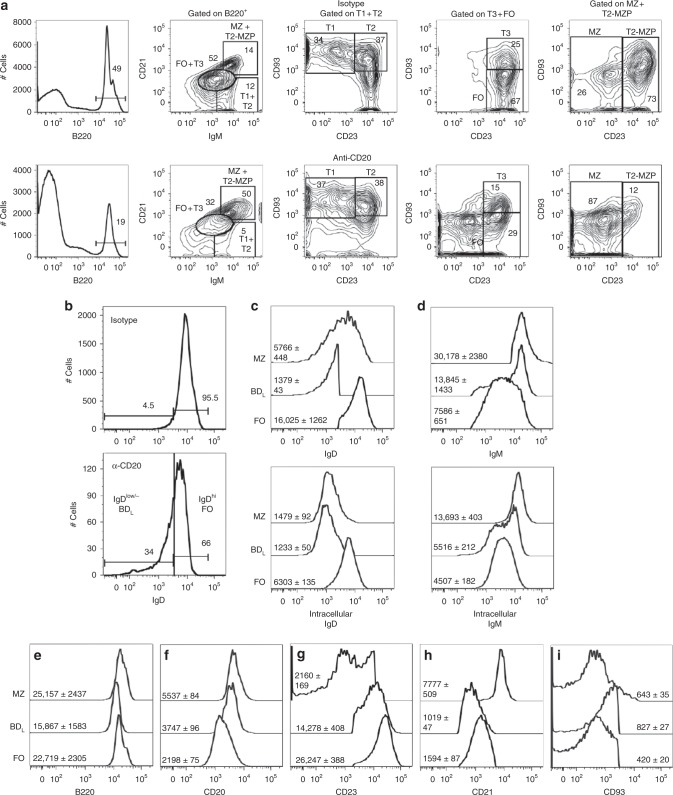
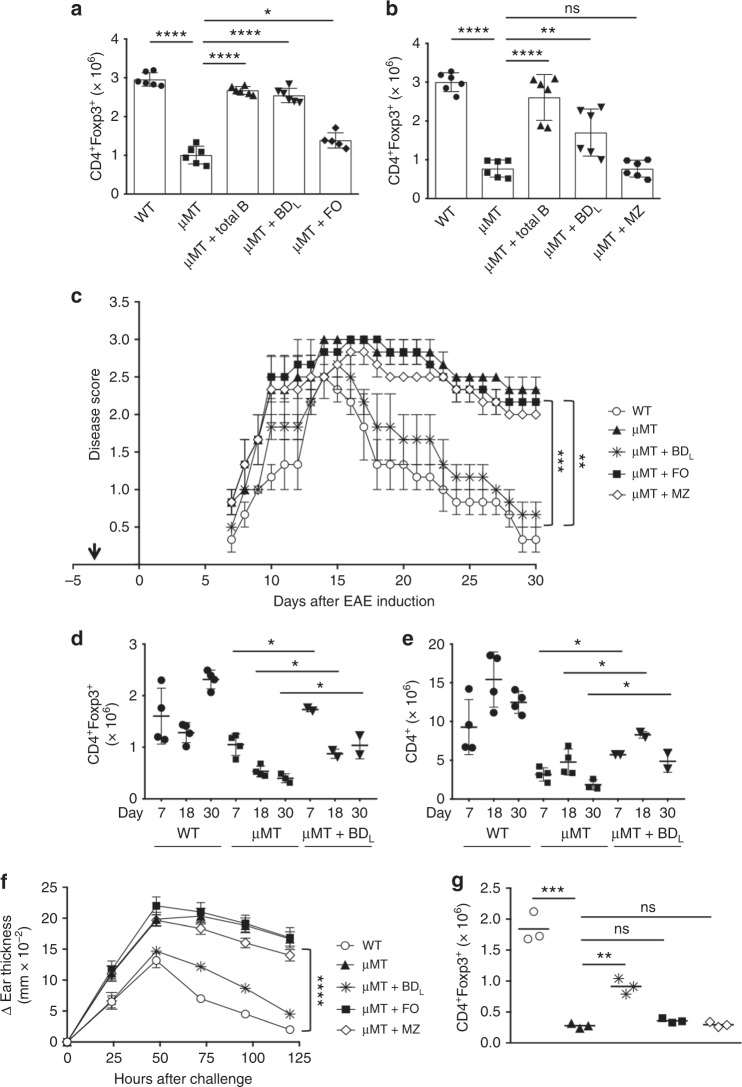
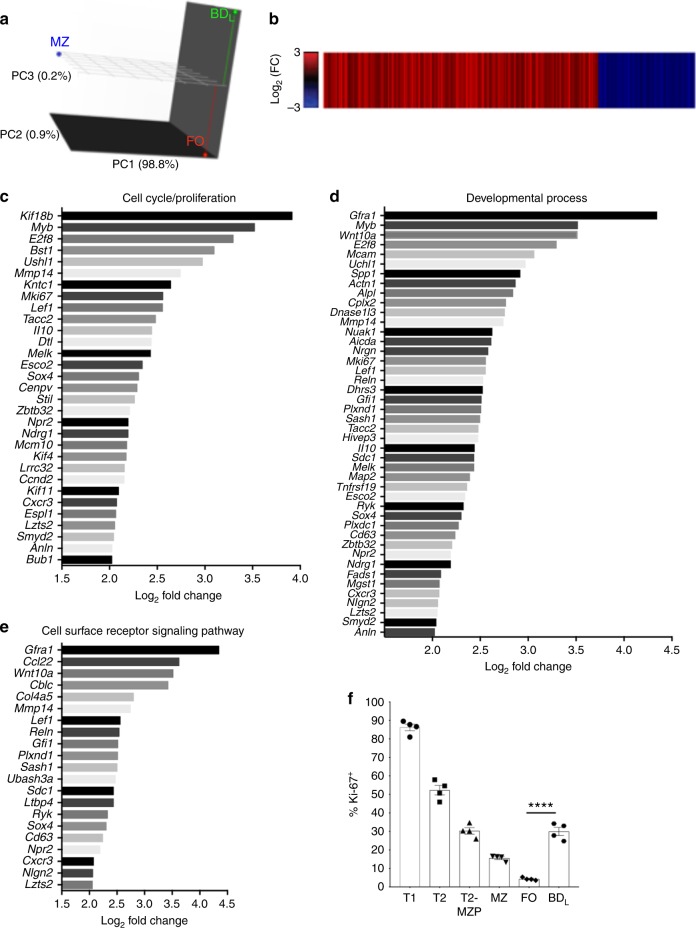
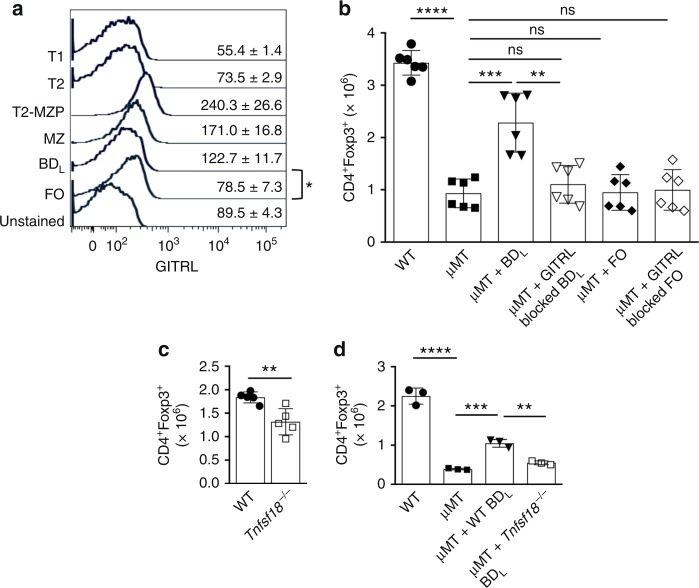
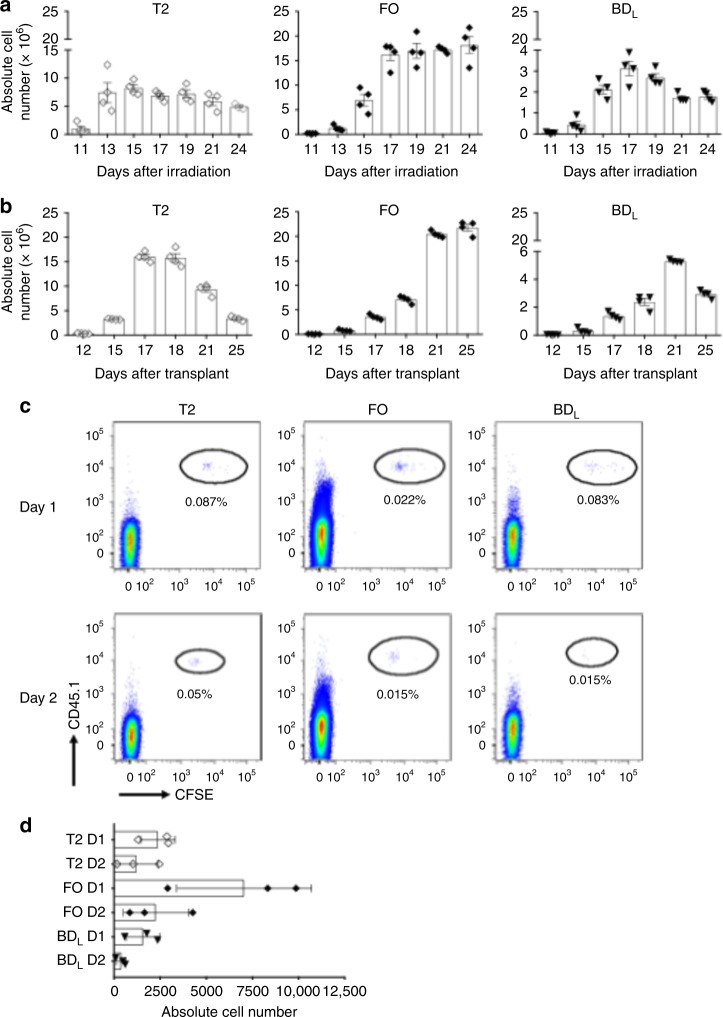
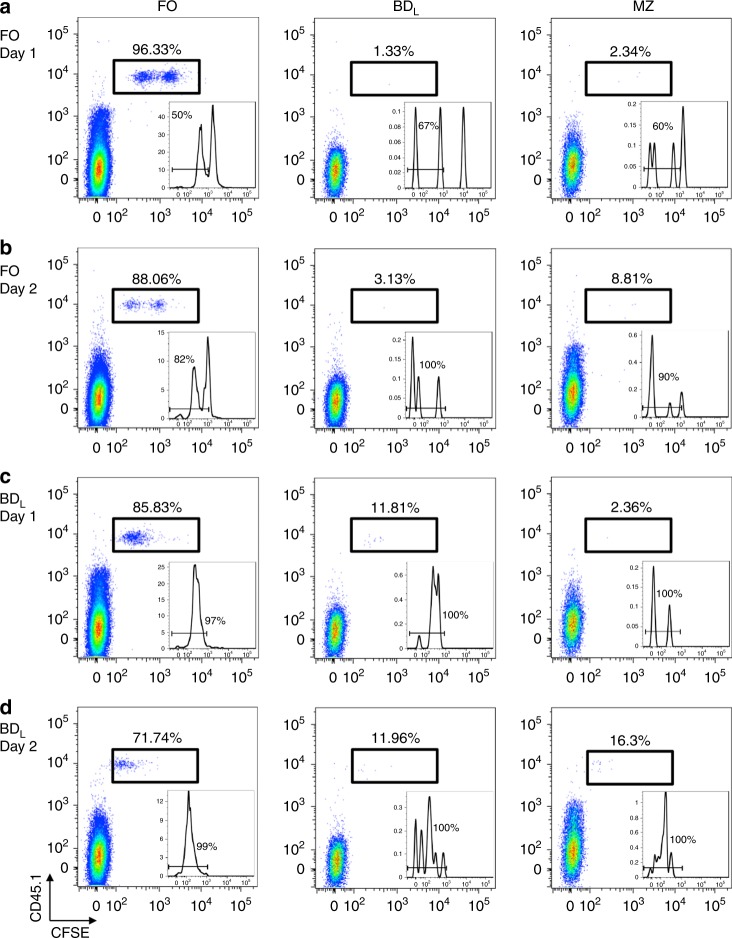
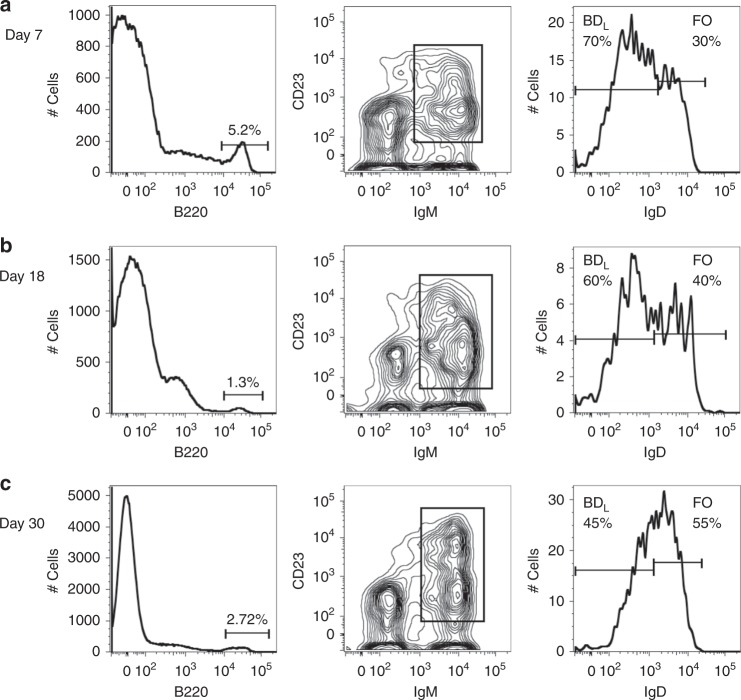
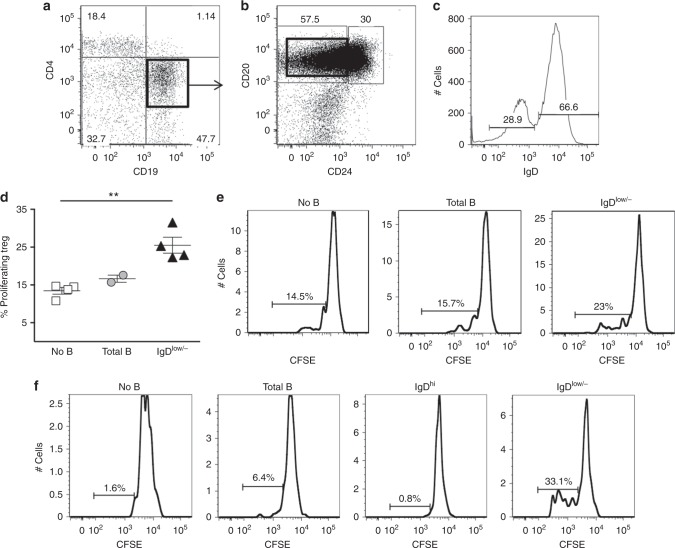
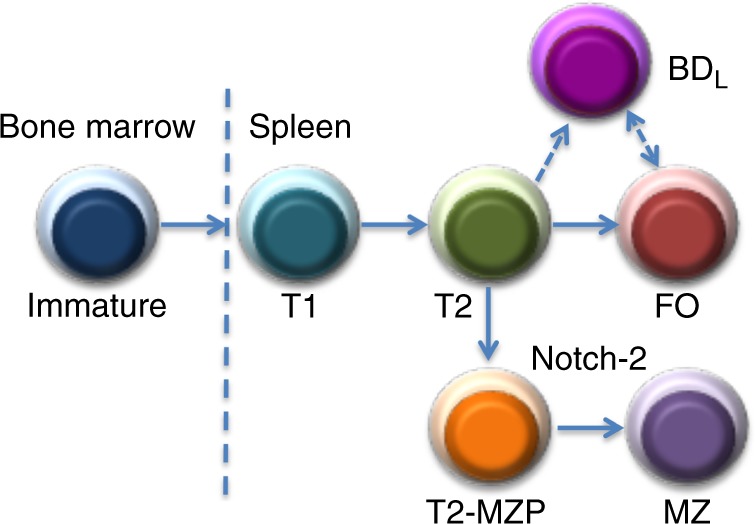
A number of different B cell subsets have been shown to exhibit regulatory activity using a variety of mechanisms to attenuate inflammatory diseases. Here we show, using anti-CD20-mediated partial B cell depletion in mice, that a population of mature B cells distinguishable by IgDlow/- expression maintains tolerance by, at least in part, promoting CD4+Foxp3+ regulatory T cell homeostatic expansion via glucocorticoid-induced tumor necrosis factor receptor ligand, or GITRL. Cell surface phenotyping, transcriptome analysis and developmental study data show that B cells expressing IgD at a low level (BDL) are a novel population of mature B cells that emerge in the spleen from the transitional-2 stage paralleling the differentiation of follicular B cells. The cell surface phenotype and regulatory function of BDL are highly suggestive that they are a new B cell subset. Human splenic and peripheral blood IgDlow/- B cells also exhibit BDL regulatory activity, rendering them of therapeutic interest.


Conflict of interest statement

The authors declare no competing interests.

Figures

Fig. 1
Fig. 1
B cells after anti-CD20 (IgG1) depletion exhibit regulatory activity. B10.PL mice were i.v. administered anti-CD20 (18B12IgG1) or its isotype control (2B8msIgG1), once (ad) or twice, 14 days apart (250 μg) (e, black arrows). On day 14, the absolute number of total splenic B cells (B220+) (a), FO B cells (B220+IgM+CD21intCD23+CD93) (a), MZ B cells (B220+IgMhiCD21hiCD23CD93) (a) and CD4+Foxp3+ Treg (d) was determined by flow cytometry. a, d Individual data points (mice) are shown superimposed upon the mean ± SEM. **p < 0.01. ns = not significant. b Representative flow cytometry dot plots with gating of splenic FO and MZ B cells shown for the isotype control (left panel) and anti-CD20 (right panel). c Splenic frozen sections from B10.PL mice treated with isotype control (left panel) or anti-CD20 (right panel) (250μg) were stained for CD3 (blue), IgD (green), IgM (purple), and SIGN-R1 (pink) 14 days post antibody treatment. Scale bar, 500 μM. e EAE was induced 3 days after the first antibody treatment by adoptive transfer of 1 × 106 encephalitogenic T cells. Clinical signs of EAE were evaluated daily and the data shown are the mean ± SEM daily disease score of nine to ten mice from two independent experiments. ****p < 0.0001, μMT vs. WT, isotype or anti-CD20 for the day 30 timepoint. f, g B10.PL mice were i.v. administered anti-CD20 (18B12IgG1) and 14 days after antibody administration total splenic B cells (B220+) (f), FO B cells (g), and MZ (g) B cells were FACS purified and 20 (f) or 5 × 106 (g) cells were adoptively transferred into sublethally irradiated B10.PLμMT mice and 3 days later EAE was induced as for e. WT and μMT control mice received PBS. The data shown are the mean daily disease score ± SEM of three to five mice from one representative experiment of two. f **p < 0.001, WT vs. μMT and μMT vs. μMT + B cells for the day 28 timepoint. e *p < 0.05, μMT vs. FO; **p < 0.01, WT vs. MZ; ***p < 0.001, WT vs. μMT for the day 35 timepoint. Statistical significance was determined using the unpaired t test
Fig. 2
Fig. 2
Retained B cells after anti-CD20 IgG1 depletion are enriched for IgDlow/− expression. a Representative flow cytometry gating strategies in B10.PL mice are shown for splenic B220+ B cells differentiating T1, T2, T3, T2-MZP, FO, and MZ B cells utilizing differential expression of IgM, CD21, CD23, and CD93 14 days after administration of isotype (top row) or anti-CD20 IgG1 (bottom row). b IgD expression was assessed on the FO B cell subset from a. ci WT C57BL/6 mice were used to assess expression levels of IgD (c), IgM (d), B220 (e), CD20 (f), CD23 (g), CD21 (h), and CD93 (i) on MZ, BDL, and FO B cells by flow cytometry. The mean fluorescence intensity ± SEM is shown from nine mice
Fig. 3
Fig. 3
Splenic BDL exhibit regulatory activity while FO and MZ B cells do not. a, b B10.PLμMT (μMT) mice were treated with PBS or reconstituted with 10 × 106 FACS-purified splenic total (B220+) or 5 x 10⁶ BDL (a, b), FO (a), or MZ (b) B cells from anti-CD20 IgG1-treated mice and the absolute number of splenic Treg was determined by flow cytometry 10 days later. B10.PL (WT) mice received PBS. Pooled data from two independent experiments are shown. Individual data points (mice) are shown superimposed upon the mean ± SEM. a *p < 0.05, μMT vs. FO; ****p < 0.0001, WT vs. μMT, μMT vs. Total B and μMT vs. BDL. b **p < 0.01, μMT vs. BDL; ****p < 0.0001, WT vs. μMT and μMT vs. Total B. ns = not significant. ce B10.PL (WT) or B10.PLμMT (μMT) mice were sublethally irradiated and 5 × 106 BDL, FO, or MZ B cells were adoptively transferred into B10.PLμMT mice (arrow) and 3 days later EAE was induced as for Fig. 1e. c EAE scores were assessed daily. The data shown are the mean ± SEM daily disease score of three mice from one representative experiment of three. **p < 0.01, WT vs. μMT, WT vs. FO, μMT vs. BDL, and μMT vs. Total B; ***p < 0.001, WT vs. MZ for the day 30 timepoint. d, e The absolute number of Treg (CD4+Foxp3+, d) and conventional CD4 T cells (CD4+Foxp3, e) was determined in the spleen by flow cytometry on days 7, 18, and 30 following EAE induction. n = 2–4. *p < 0.05. f, g CHS was induced in C57BL/6 WT or μMT mice treated with PBS or μMT mice that had received 5 × 106 BDL, FO, or MZ B cells by painting one ear with 3% oxazolone on days 0 and 6. f Ear thickness was measured every 24 h for 6 days. Data shown are the mean change in ear thickness ± SEM from time 0 measured just prior to the second treatment. n = 6. ****p < 0.0001, WT vs. μMT, MZ and FO WT and μMT vs. μMT + BDL for the 120 h timepoint. g CD4+Foxp3+ Treg were quantitated in the spleen at 120 h. **p < 0.01, μMT vs. μMT + BDL; ***p < 0.0001, WT vs. μMT for the 120 h timepoint. n = 3 mice. ns = not significant. Statistical significance was determined using the unpaired t test
Fig. 4
Fig. 4
BDL undergo a high rate of proliferation. RNA-seq analysis was performed on FACS purified splenic BDL, FO, and MZ B cells from B10.PL mice. a PC analysis was performed on the log2-transformed FPKM, with the % variance encompassed within each PC shown. The distribution of BDL (green), FO (red), and MZ (blue) B cells within the 3D plot are shown. b A heat map displaying the log2 fold change for genes that showed a significant difference (Benjami–Hochberg adjusted p < 0.05) between BDL and FO B cells are shown. Red bars show genes more highly expressed and blue reduced expression in BDL . n = 3. ce Barplots of the most highly differentially expressed genes (log2 fold change >2) in BDL compared to FO cells within the select Gene Ontology terms cell cycle/proliferation (c), developmental process (d), and cell surface signaling pathway (e) are shown. f The percentage of splenic T1 (B220+IgMhiCD21lowCD23CD93+), T2, T2-MZP (B220+IgMhiCD21hiCD23+), MZ, BDL and FO B cells from C57BL/6J mice expressing Ki-67 was determined by flow cytometry. f Individual data points (mice) are shown superimposed upon the mean ± SEM from one independent experiment of two. ****p < 0.0001. Statistical significance was determined using the unpaired t test
Fig. 5
Fig. 5
BDL regulatory activity is GITRL-dependent. a Splenic T1, T2, T2-MZP, MZ, BDL, and FO B cells from B10.PL mice expressing GITRL was determined by flow cytometry. The data shown are the MFI  ± SEM of three mice from one of four independent experiments. *p < 0.05, BDL vs. FO B cells. bd C57BL/6μMT mice were reconstituted with 5 × 106 FACS-purified WT BDL (b, d), WT FO (b, d), Tnfsf18−/− (GITRL−/−) BDL (d) cells from C57BL/6 mice with (b) or without (d) GITRL antibody blocking and the absolute number of splenic Treg was determined by flow cytometry 10 days later. c Treg were quantitated in the spleen of WT and Tnfsf18−/− mice by flow cytometry. b Individual data points (mice) are shown superimposed upon the mean ± SEM from two independent experiments. **p < 0.01, μMT + WT BDL vs. μMT + GITRL blocked WT BDL; ***p < 0.001, μMT vs. μMT + WT BDL; ****p < 0.0001, WT vs. μMT. c Individual data points (mice) are shown superimposed upon the mean ± SEM of five mice. **p < 0.01. d **p < 0.01, μMT + WT BDL vs. μMT + Tnfsf18−/− BDL; ***p < 0.001, μMT vs. μMT + WT BDL; ****p < 0.0001, WT vs. μMT. Statistical significance was determined using the unpaired t test
Fig. 6
Fig. 6
BDL are mature and emerge from the T2 stage. a C57BL/6J mice were sublethally irradiated (500 rad) and the emergence of T2, FO, and BDL was tracked in the spleen on the days indicated by flow cytometry and the absolute number of cells was calculated. b C57BL/6J mice were lethally irradiated (950 rad) and transplanted with syngeneic BM and the emergence of T2, FO, and BDL was tracked in the spleen on the days indicated by flow cytometry and the absolute number of cells was calculated. a, b Individual data points (mice) are shown superimposed upon the mean ± SEM. c, d C57BL/6J CD45.1 mice were sublethally irradiated (500 rad) and 15 days later T2 cells were FACS purified, labeled with CFSE, and 1.25 × 106 cells/recipient were adoptively transferred to C57BL/6J CD45.2 mice and 24 and 48 h later the percentage (c) and absolute number (d) of T2, FO, and BDL was determined in the spleen by flow cytometry. T2, FO, and BDL B cell subsets were gated as for Fig. 2a, b. c Data shown are one representative experiment of three. d Individual data points (mice) are shown superimposed upon the mean ± SEM from one representative experiment of three. Statistical significance was determined using the unpaired t test
Fig. 7
Fig. 7
Following adoptive transfer a subset of BDL are stable phenotypically. C57BL/6 CD45.1 FO (a, b) or BDL (c, d were FACS purified, CFSE labeled, and adoptively transferred (1.5 × 106) into C57BL/6J CD45.2 mice that were sublethally irradiated (500 rad) 11 days prior. On days 1 and 2 the presence of FO, BDL, and MZ B cells was assessed in the spleen. The transferred cells were gated as CD45.1+ and the percentage of each B cell subset within the gate is provided and shown as dot plots with CFSE. The inset is a histogram of the CFSE data with the percentage of cells having undergone proliferation indicated. Data shown are one representative experiment of four
Fig. 8
Fig. 8
Following adoptive transfer and EAE induction BDL are stable up to 30 days. BDL adoptive transfer and EAE was performed as for Fig. 3c and the data are from the same mice used for Fig. 3d, e. On days 7 (a), 18 (b), and 30 (c) of EAE, B220+ lymphocytes were gated for IgM+CD23+ and analyzed for IgD expression by flow cytometry. The percentage of BDL and FO B cells is provided. Data shown are one representative mouse of two
Fig. 9
Fig. 9
Human IgDlow/− B cells induce the proliferation of human Treg in vitro. Human splenic B cells (CD19+) (a) and IgDlow/− (CD19+CD20+CD24IgDlow/−) B cells (ac) and Treg (CD4+CD25hi) were FACS purified and the Treg were labeled with CFSE. d Treg (0.5 × 105) were cultured alone or with splenic B cells (1 × 105) in the presence of anti-CD3 (2 mg/ml) and irradiated APC (CD4CD8CD19) for 96 h. Each symbol represents a single human sample. **p < 0.01, no B cells vs. IgDlow/−. e Representative flow cytometry histograms with gating of proliferating cells is shown from one experiment of four from d. f Human peripheral blood B cells (CD19+), IgDhi (CD19+CD20+CD24IgDhi) B cells, IgDlow (CD19+CD20+CD24IgDlow/−) B cells, and Treg (CD4+CD25hi) were FACS purified. CFSE-labeled Treg (0.5 × 105) were cultured alone or with 1 × 105 total B cells, IgDhi, or IgDlow/− in the presence of plate bound anti-CD3 (10 mg/ml) and anti-CD28 (10 mg/ml). After culture, the cells were stained with CD4 and the percentage of proliferating Treg cells was determined by flow cytometry. Data shown are one representative experiment of two. Statistical significance was determined using the unpaired t test
Fig. 10
Fig. 10
Revised model of B cell differentiation in the spleen including the BDL subset. Currently, it is thought that immature B cells exit the BM and enter the spleen where they undergo sequential differentiation into T1 then T2, which differentiate into either FO B cells or T2-MZP that upon Notch-2 signaling further differentiate into MZ B cells. BDL are a new mature B cell subset that differentiates directly from the T2 stage. Alternatively, BDL could be a subset of FO B cells or differentiate from the FO stage

Similar articles

Cited by

References

    1. Wolf SD, Dittel BN, Hardardottir F, Janeway CA., Jr. Experimental autoimmune encephalomyelitis induction in genetically B cell-deficient mice. J. Exp. Med. 1996;184:2271–2278. doi: 10.1084/jem.184.6.2271. - DOI - PMC - PubMed
    1. Mann MK, Maresz K, Shriver LP, Tan Y, Dittel BN. B cell regulation of CD4+CD25+T regulatory cells and IL-10 via B7 is essential for recovery from experimental autoimmune encephalomyelitis. J. Immunol. 2007;178:3447–3456. doi: 10.4049/jimmunol.178.6.3447. - DOI - PubMed
    1. Ray A, Basu S, Williams CB, Salzman NH, Dittel BN. A novel IL-10-independent regulatory role for B cells in suppressing autoimmunity by maintenance of regulatory T cells via GITR ligand. J. Immunol. 2012;188:3188–3198. doi: 10.4049/jimmunol.1103354. - DOI - PMC - PubMed
    1. Fillatreau S, Sweenie CH, McGeachy MJ, Gray D, Anderton SM. B cells regulate autoimmunity by provision of IL-10. Nat. Immunol. 2002;3:944–950. doi: 10.1038/ni833. - DOI - PubMed
    1. Tedder TF. B10 cells: a functionally defined regulatory B cell subset. J. Immunol. 2015;194:1395–1401. doi: 10.4049/jimmunol.1401329. - DOI - PubMed

Publication types

MeSH terms