. 2019 Jan 14;10(1):211.
doi: 10.1038/s41467-018-08217-3.

Intensiometric biosensors visualize the activity of multiple small GTPases in vivo

Affiliations

Intensiometric biosensors visualize the activity of multiple small GTPases in vivo

Jihoon Kim et al. Nat Commun. .

Abstract

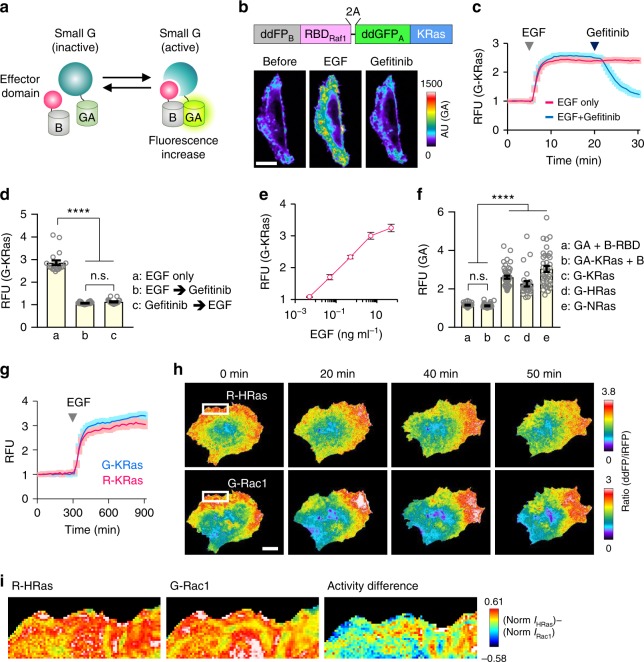
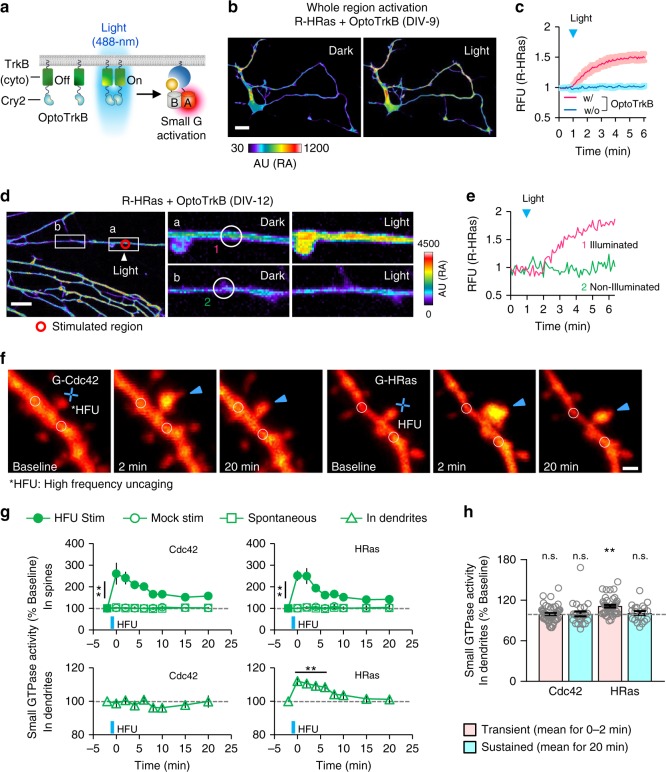
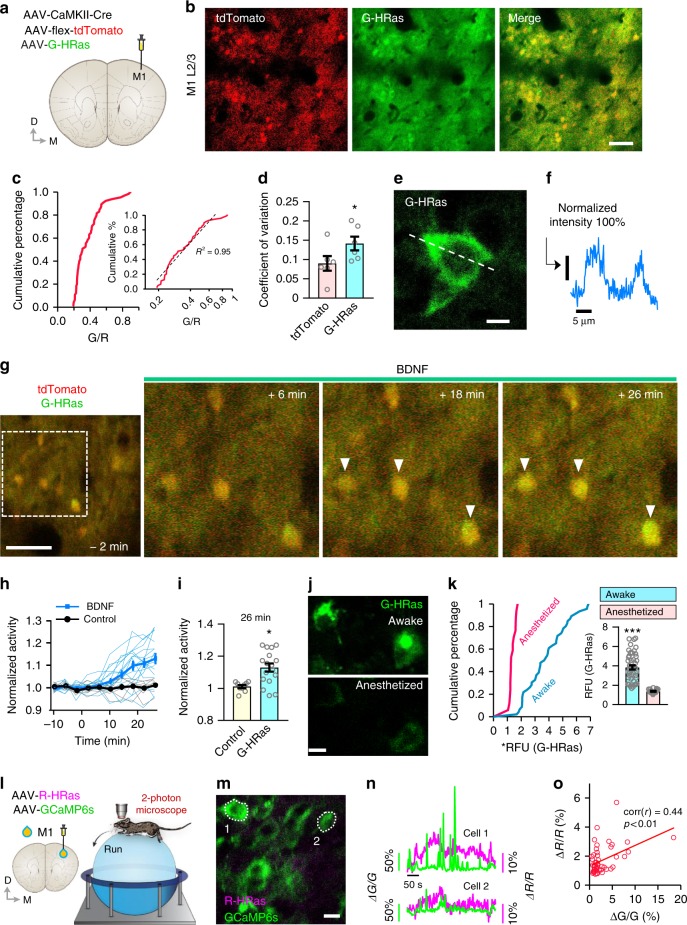
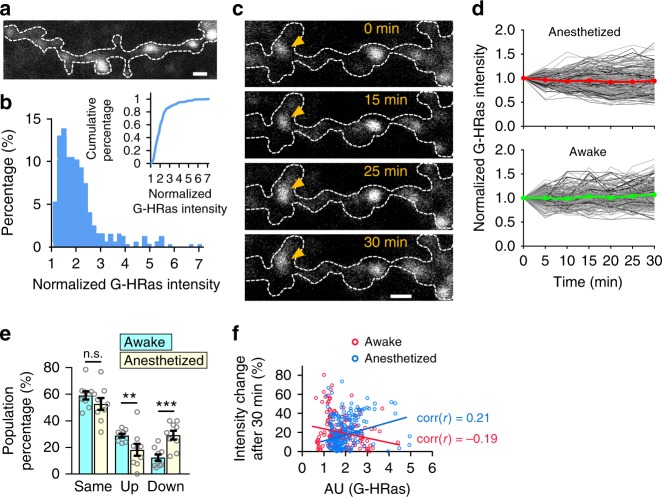
Ras and Rho small GTPases are critical for numerous cellular processes including cell division, migration, and intercellular communication. Despite extensive efforts to visualize the spatiotemporal activity of these proteins, achieving the sensitivity and dynamic range necessary for in vivo application has been challenging. Here, we present highly sensitive intensiometric small GTPase biosensors visualizing the activity of multiple small GTPases in single cells in vivo. Red-shifted sensors combined with blue light-controllable optogenetic modules achieved simultaneous monitoring and manipulation of protein activities in a highly spatiotemporal manner. Our biosensors revealed spatial dynamics of Cdc42 and Ras activities upon structural plasticity of single dendritic spines, as well as a broad range of subcellular Ras activities in the brains of freely behaving mice. Thus, these intensiometric small GTPase sensors enable the spatiotemporal dissection of complex protein signaling networks in live animals.


Conflict of interest statement

The authors declare no competing interests.

Figures

Fig. 1
Fig. 1
Development of intensiometric small GTPase biosensors. a Schematic of ddFP-based small GTPase sensor. b (top) Schematic depiction of KRas (G-KRas) sensor construct. (bottom) Fluorescence images showing Ras activity during sequential treatment of EGF (50 ng ml−1) and EGFR inhibitor, gefitinib (400 nM). Color bar indicates range of G-KRas intensity. c Time-lapse graph represents reversible fluorescence change of G-KRas upon EGF or gefitinib treatment. n = 77 (blue), 40 (red). d Graph representing maximal fold-changes of GA-KRas intensity in HeLa cells. One way analysis of variance (ANOVA), P < 0.0001 for (EGF vs. gefitinib); P < 0.0001 for (EGF vs. pre-gefitinib + EGF); P = 0.8948 for (EGF+gefitinib vs. pre-gefitinib+EGF). n = 19, 20, 19; n.s., not significant. e Graph showing dose-dependent fold-changes of G-KRas sensor intensity upon EGF treatment. n = 20 for each concentration. f Quantification of maximal fold change of ddGFP-based Ras GTPase sensors upon EGF treatment. Each group of cells was co-transfected with plasmids as indicated. One way analysis of variance (ANOVA), P < 0.0001 for (a vs. c, d, e); P < 0.0001 for (b vs. c, d, e); P > 0.9999 for (a vs. b). n = 32, 42, 44, 27, 37; n.s., not significant. g Time-lapse graph showing dynamics of G-KRas and R-KRas sensor intensities upon EGF treatment. Images were captured at 20-s intervals. n = 17 (G-KRas), 18 (R-KRas). h Simultaneous imaging of HRas and Rac1 activities in MDA-MB-231 cell co-expressing R-HRas, G-Rac1, and Lyn-miRFP. Fluorescence ratio images showing Ras and Rac1 activity during cell migration. i (left, middle) Magnified images (area indicated by white boxes in h) showing subcellular distribution of R-HRas and G-Rac1 activities. (right) A color-coded image showing difference between normalized activities of HRas and Rac1 in subcellular regions. RFU: relative fluorescence unit; All scale bars, 20 μm; Error bars, s.e.m. Images or quantified data are representatives of multiple experiments (N > 3)
Fig. 2
Fig. 2
Spatiotemporal visualization of small GTPase activation in dendrites and single spines upon optoTrkB activation and LTP induction. a Schematic of Ras activation by blue light-mediated OptoTrkB activation. b Cultured hippocampal neuron (DIV-9) showing fluorescence change of R-HRas upon blue light-induced whole cell activation of OptoTrkB. Whole-cell activation; light was globally illuminated in the whole field of view. c Time-lapse measurement showing fluorescence change of R-HRas upon light stimulation. n = 4 (red), 6 (blue). Scale bar, 20 μm. d (left) images showing local fluorescence increase of R-HRas intensity upon OptoTrkB activation. Local stimulation was applied to a small region of dendrite (indicated by red circle) of hippocampal neuron (DIV-12) at t = 1 min. (right) Enlarged images of the indicated regions (white boxes) showing fluorescence change of R-HRas at the region of illumination and a distal dendrite. Scale bar, 20 μm. e Time-lapse graph showing fluorescence changes of R-HRas within regions indicated by white circles in d (magenta; nearby stimulation, green; distal from stimulation). f Time-lapse images of dendrites from layer 2/3 pyramidal neurons co-expressing tdTomato (red) and small GTPases sensors, G-Cdc42 (left) and G-HRas (right). Target spines (arrowheads) were exposed to HFU (blue crosses). g Time-lapse measurement showing fluorescence changes of G-Cdc42 and G-HRas in HFU-stimulated spines (top) and nearby dendrites (bottom, indicated by white circles in f,  < 2.5 μm from target spines). Filled circles, G-Cdc42: **P < 0.01 at all post-HFU time points; n = 26 spines, 22 cells; G-HRas: **P < 0.01 at all post-HFU time points; n = 22 spines, 19 cells. Open circles, G-Cdc42: n = 10 spines, 10 cells; G-HRas: n = 11 spines, 11 cells. Open squares, G-Cdc42: n = 23 spines, six cells; G-HRas: n = 23 spines, six cells. Triangles (G-Cdc42), n = 26 spines, 22 cells. Triangles (G-HRas), **P < 0.01 up to 6 min; n = 22 spines, 19 cells. h Graph showing relative changes of fluorescence of G-Cdc42 and G-HRas in dendrites in different time periods (transient and sustained) following HFU. **P < 0.01. Statistical analysis were performed by Student’s two-tailed t test; n.s., not significant. *HFU: high-frequency uncaging; RFU: relative fluorescence unit; AU: arbitrary unit; Error bars: s.e.m. Images or quantified data are representatives of multiple experiments (N > 3)
Fig. 3
Fig. 3
Visualizing real-time dynamic changes of Ras activity in the intact brains of freely behaving mice. a Schematic depiction of virus injection and imaging positions. b In vivo two-photon imaging of G-HRas in layer 2/3 neurons. Scale bar, 100 μm. c Cumulative distribution of G/R ratio (n = 65 cells). Log-normal scaled plot of the distribution (inset, R2 = 0.95). d Coefficient of variation for tdTomato and G-HRas signals (average ± s.e.m: 9.01 ± 1.89 for tdTomato; 14.2 ± 1.79 for G-HRas). e A representative image of G-HRas expression in the cell body. Scale bar, 10 μm. f Normalized intensity profile of G-HRas expression across the cell body, indicated as a dotted line in e. g Time-lapse imaging of G-HRas fluorescence with BDNF treatment. h Individual and average time course graph of normalized activity of G-HRas (n = 17 cells for BDNF; n = 9 cells for control). i Comparison of G-HRas activity between control and BDNF groups (average ± s.e.m: 1.01 ± 0.01 for control; 1.13 ± 0.025 for BDNF). j Representative images of G-HRas activity in awake (top) and anesthetized (bottom) states. k Cumulative distribution of normalized G-HRas intensity in awake and anesthetized states (n = 46 cells, awake; n = 17 cells, anesthetized). Comparison of average G-HRas intensity (inset) (average ± s.e.m: 3.84 ± 0.22, awake; 1.37 ± 0.05, anesthetized). l Schematics of virus injection and two-photon microscopy in mice running on a spherical treadmill. m A representative image of neurons expressing R-HRas and GCaMP6s. n Traces of R-HRas and GCaMP6s signals from two exemplary neurons. o Correlation between R-HRas and GCaMP6s signals (n = 49 cells, Pearson’s r = 0.44). *P < 0.05, ***P < 0.001 by Student’s two-tailed t -test. RFU: relative fluorescence unit. Images or quantified data are representatives of multiple experiments (N > 3). BDNF brain-derived neurotrophic factor
Fig. 4
Fig. 4
Visualization of dynamic Ras activity at the synapse resolution in awake mice. a Schematic representative image of G-HRas expression in a dendrite in vivo. b Distribution of G-HRas intensity (n = 325). Cumulative distribution (inset). c Time-lapse in vivo two-photon imaging of G-HRas activity in the awake state. Arrow indicates example Ras signal punctum that shows fluorescence intensity increases. d Time courses of activity in anesthetized and awake states. Gray scaled and colored (red, green) lines indicate changes of individual puncta and average, respectively (n = 194 for the anesthetized, n = 165 for the awake). e Categorized G-HRas responses at t = 30 min: same (>80 and <120%; average ± s.e.m: 59.07 ± 3.09 for the awake, average ± s.e.m: 52.72 ± 4.42 for the anesthetized), up (≥ 120%; average ± s.e.m: 28.89 ± 1.40 for the awake, average ± s.e.m: 18.19 ± 4.50 for the anesthetized), and down (≤ 80%; average ± s.e.m: 12.38 ± 2.39 for the awake, average ± s.e.m: 29.24 ± 3.33 for the anesthetized). f Correlations between G-HRas intensity and intensity change after 30 min for awake and anesthetized states (Pearson’s r = −0.19 for the awake, r = 0.21 for the anesthetized). *P < 0.05, ***P < 0.001 by Student’s two-tailed t test, n.s., not significant. Error bars, s.e.m. All scale bars, 2 μm. Images or quantified data are representatives of multiple experiments (N > 3)

Similar articles

Cited by

References

    1. Hall AG. Proteins and Small GTPases: distant relatives keep in touch. Science. 1998;280:2074–2075. doi: 10.1126/science.280.5372.2074. - DOI - PubMed
    1. Etienne-Manneville S, Hall A. Rho GTPases in cell biology. Nature. 2002;420:629. doi: 10.1038/nature01148. - DOI - PubMed
    1. Ridley AJ, et al. Cell migration: integrating signals from front to back. Science. 2003;302:1704–1709. doi: 10.1126/science.1092053. - DOI - PubMed
    1. Machacek M, et al. Coordination of Rho GTPase activities during cell protrusion. Nature. 2009;461:99–103. doi: 10.1038/nature08242. - DOI - PMC - PubMed
    1. Kennedy MB, Beale HC, Carlisle HJ, Washburn LR. Integration of biochemical signalling in spines. Nat. Rev. Neurosci. 2005;6:423. doi: 10.1038/nrn1685. - DOI - PubMed

Publication types

MeSH terms

Substances