. 2019 Jan 14;10(1):201.
doi: 10.1038/s41467-018-08033-9.

Coordinative metabolism of glutamine carbon and nitrogen in proliferating cancer cells under hypoxia

Affiliations

Coordinative metabolism of glutamine carbon and nitrogen in proliferating cancer cells under hypoxia

Yuanyuan Wang et al. Nat Commun. .

Abstract

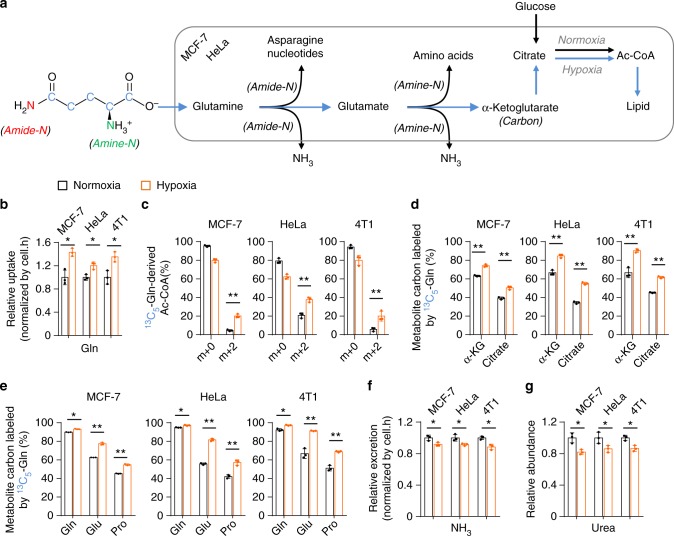
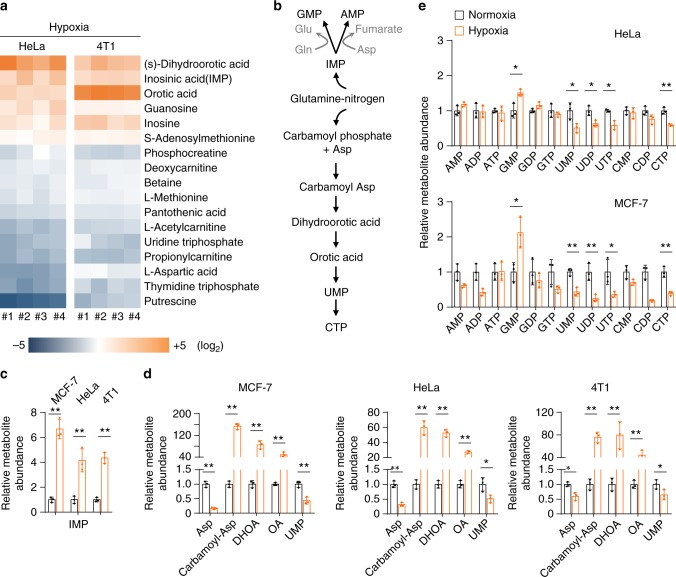
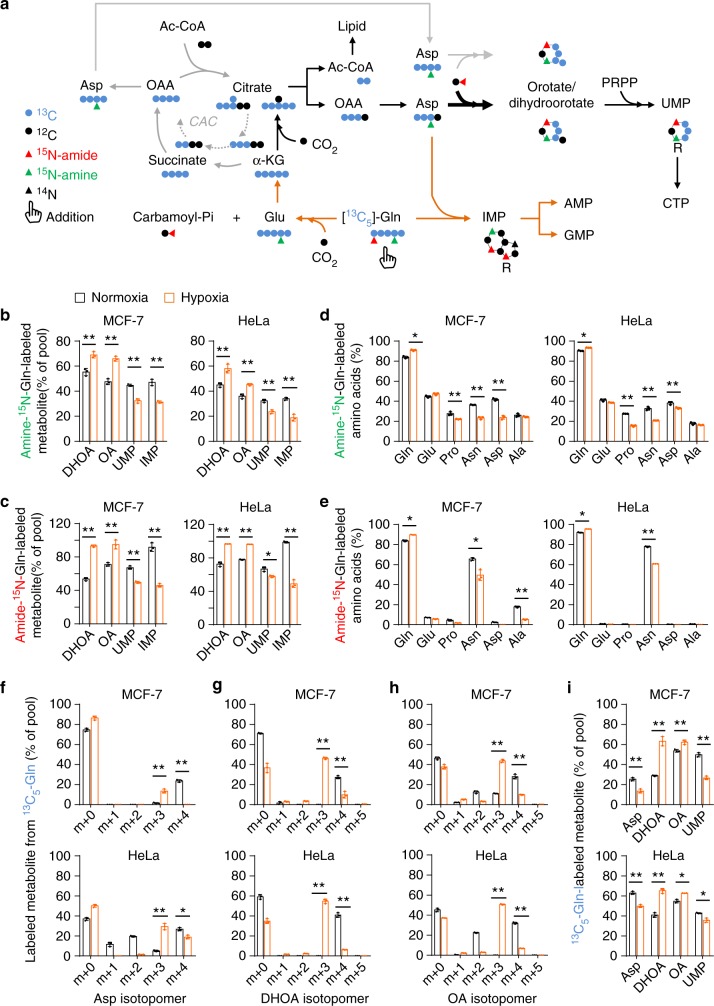
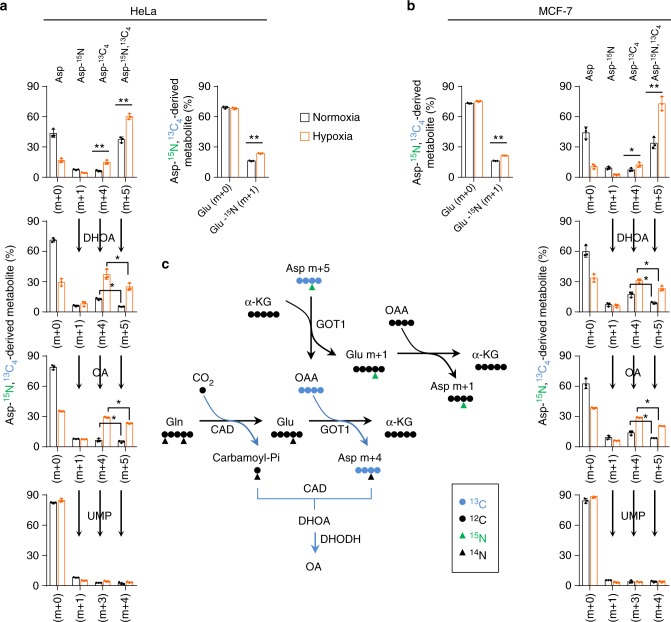
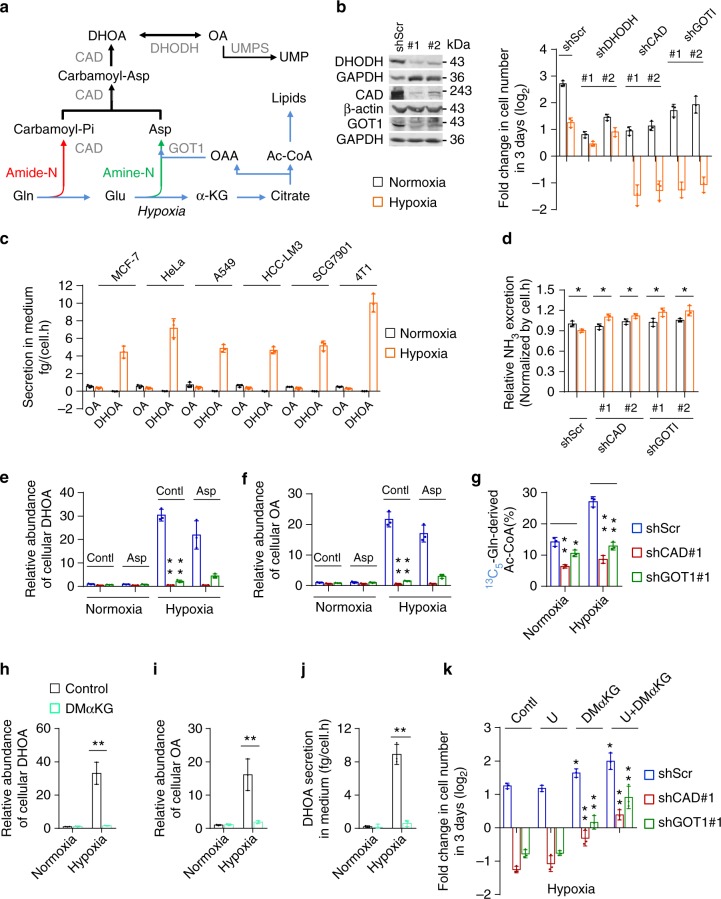
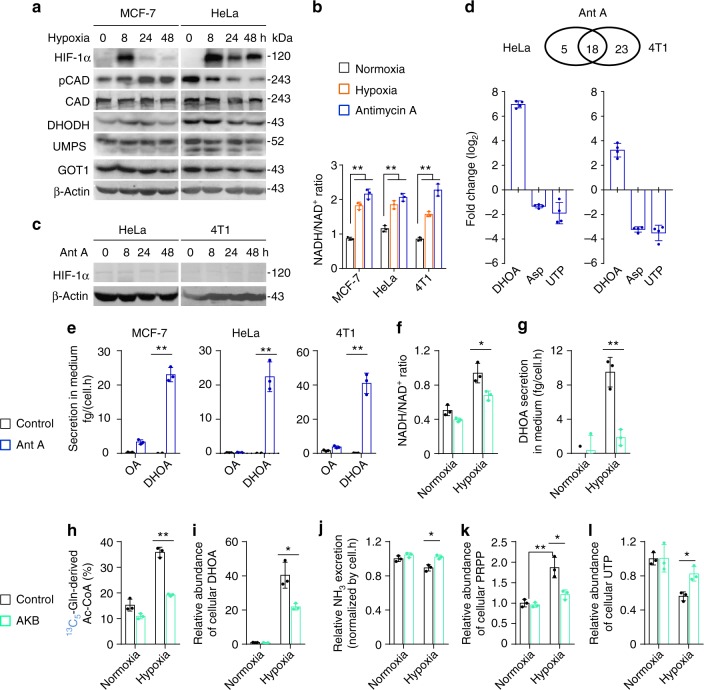
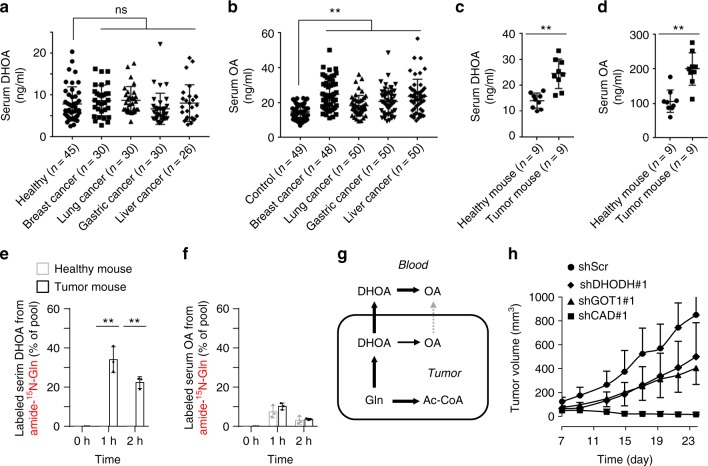
Under hypoxia, most of glucose is converted to secretory lactate, which leads to the overuse of glutamine-carbon. However, under such a condition how glutamine nitrogen is disposed to avoid over-accumulating ammonia remains to be determined. Here we identify a metabolic flux of glutamine to secretory dihydroorotate, which is indispensable to glutamine-carbon metabolism under hypoxia. We found that glutamine nitrogen is necessary to nucleotide biosynthesis, but enriched in dihyroorotate and orotate rather than processing to its downstream uridine monophosphate under hypoxia. Dihyroorotate, not orotate, is then secreted out of cells. Furthermore, we found that the specific metabolic pathway occurs in vivo and is required for tumor growth. The identified metabolic pathway renders glutamine mainly to acetyl coenzyme A for lipogenesis, with the rest carbon and nitrogen being safely removed. Therefore, our results reveal how glutamine carbon and nitrogen are coordinatively metabolized under hypoxia, and provide a comprehensive understanding on glutamine metabolism.


Conflict of interest statement

The authors declare no competing interests.

Figures

Fig. 1
Fig. 1
Increased glutamine as the carbon source under hypoxia. a A schematic to show the metabolism of glutamine carbon and nitrogen. b Relative glutamine uptake in MCF-7, HeLa, and 4T1 cells cultured under hypoxia and normoxia for 8 h. c Mass isotopomer analysis of acetyl-CoA in MCF-7, HeLa, and 4T1 cells cultured with the medium containing 1 mM of 13C5-glutamine under hypoxia and normoxia for 8 h. d, e The 13C5-labeled fraction of metabolites in MCF-7, HeLa, and 4T1 cells cultured with the medium containing 1 mM of 13C5-glutamine for 8 h under hypoxia or normoxia. f Relative ammonia excretion from MCF-7, HeLa, and 4T1 cells cultured under hypoxia and normoxia for 8 h. g Relative cellular urea in MCF-7, HeLa, and 4T1 cells cultured under hypoxia and normoxia for 8 h. All cultures were supplied with 10% dialyzed serum. Values are the means ± SEM of three independent experiments. *p < 0.05; **p < 0.01 (Student’s t-test)
Fig. 2
Fig. 2
Accumulation of cellular nucleotide precursors under hypoxia. a Heatmap of N-contained metabolites in HeLa and 4T1 cells significantly (p < 0.05) affected by hypoxia for 8 h. Cellular metabolites were measured by LC–MS-based metabolomics. b A schematic to show the metabolic assimilation of glutamine-nitrogen to nucleotide biosynthesis. c Relative cellular IMP in MCF-7, HeLa, and 4T1 cells cultured under hypoxia and normoxia for 8 h. d Relative cellular aspartate, carbamoyl-aspartate, dihydroorotate, orotate, and UMP in MCF-7, HeLa, and 4T1 cells cultured under hypoxia and normoxia for 8 h. e Relative cellular nucleotides in MCF-7 and HeLa cells cultured under hypoxia and normoxia for 8 h. All cultures were supplied with 10% dialyzed serum. Values are the means ± SEM of three independent experiments. *p < 0.05; **p < 0.01 (Student’s t-test)
Fig. 3
Fig. 3
Metabolic flux of glutamine-nitrogen and glutamine-carbon in nucleoside biosynthesis. a A schematic to show the metabolism of isotope-labeled glutamine. b, c The 15N-labeled fraction of dihydroorotate, orotate, UMP, and IMP in MCF-7 and HeLa cells cultured with the medium containing 1 mM of amine-15N-glutamine or amide-15N-glutamine for 8 h under hypoxia or normoxia. d, e The 15N-labeled fraction of amino acids in MCF-7 and HeLa cells cultured with the medium containing 1 mM of amine-15N-glutamine or amide-15N-glutamine for 8 h under hypoxia or normoxia. f–h Mass isotopomer analysis of aspartate, dihydroorotate, and orotate in MCF-7 and HeLa cells cultured with the medium containing 1 mM of 13C5-glutamine for 8 h under hypoxia or normoxia. i The 13C5-labeled fraction of metabolites in MCF-7 and HeLa cells cultured with the medium containing 1 mM of 13C5-glutamine for 8 h under hypoxia or normoxia. All cultures were supplied with 10% dialyzed serum. Values are the means ± SEM of three independent experiments. *p < 0.05; **p < 0.01 (Student’s t-test)
Fig. 4
Fig. 4
Promotion of aspartate to pyrimidine precursors under hypoxia. a, b Mass isotopomer analysis of aspartate, glutamate, dihydroorotate, orotate, and UMP in MCF-7 and HeLa cells cultured with the medium containing 10 mM of 13C4, 15N-aspartate for 8 h under hypoxia or normoxia. Values are the means ± SEM of three independent experiments. *p < 0.05; **p < 0.01 (Student’s t-test). c A schematic to show the metabolic flux of 13C4, 15N-aspartate in the biosynthesis of aspartate, glutamate, dihydroorotate, and orotate
Fig. 5
Fig. 5
Association of glutamine-carbon metabolism with its nitrogen assimilation under hypoxia. a A schematic to show the metabolism of glutamine carbon and nitrogen in the pyrimidine biosynthesis. b Proliferation of HeLa cells with or without knockdown of DHODH, CAD, and GOT1 cultured under hypoxia and normoxia for 3 days. Values are the means ± SEM of triplicate experiments. Western blot to validate the knockdown of DHODH, CAD, and GOT1. c Excretion of dihydroorotate and orotate to medium from cells cultured under hypoxia and normoxia for 8 h. d Relative ammonia excretion from HeLa/shScramble, HeLa/shCAD, and HeLa/shGOT1 cells cultured under hypoxia and normoxia for 8 h. Values are the means ± SEM of triplicate experiments. e, f Relative cellular dihydroorotate and orotate in HeLa/shScramble, HeLa/shCAD, and HeLa/shGOT1 cells cultured under hypoxia and normoxia for 8 h in the presence or absence of 10 mM aspartate. g Mass isotopomer analysis of acetyl-CoA in HeLa/shScramble, HeLa/shCAD, and HeLa/shGOT1 cells cultured with the medium containing 1 mM of 13C5-glutamine under hypoxia and normoxia for 8 h. h, i The relative abundance of cellular dihydroorotate and orotate in HeLa cells cultured under hypoxia and normoxia for 8 h in the presence or absence of 2 mM dimethyl α-ketoglutarate (DMαKG). j Excretion of dihydroorotate to medium from HeLa cells cultured under hypoxia and normoxia for 8 h in the presence or absence of 2 mM DMαKG. k Proliferation of HeLa/shScramble, HeLa/shCAD, and HeLa/shGOT1 cells cultured under hypoxia for 3 days in the presence or absence of 100 μM uridine and/or 2 mM DMαKG. Values are the means ± SEM of triplicate experiments. All cultures were supplied with 10% dialyzed serum. Values are the means ± SEM of three independent experiments, if not specified. *p < 0.05; **p < 0.01 (Student’s t-test)
Fig. 6
Fig. 6
Hypoxia-induced NADH accumulation promotes biosynthesis and excretion of dihydroorotate. a Western blot of lysates from MCF-7 and HeLa cells cultured under hypoxia for different time as indicated. b NADH/NAD+ ratio in MCF-7, HeLa, and 4T1 cells cultured under hypoxia and normoxia for 2 h. Values are the means ± SEM of triplicate experiments. c Western blot of lysates from MCF-7 and 4T1 cells cultured under hypoxia for different time as indicated. d Targeted metabolomics of HeLa and 4T1 cells cultured under hypoxia or treated with antimycin A (1 μM) for 8 h. The relative abundance of dihydroorotate, asparatate, and UTP were listed here. Values are the means ± SEM of four independent experiments. e Excretion of dihydroorotate and orotate to medium from cells treated with or without antimycin A for 8 h. f NADH/NAD+ ratio in HeLa cells cultured under hypoxia and normoxia for 2 h in the presence or absence of 1 mM α-ketobutyrate. g Excretion of dihydroorotate to medium from HeLa cells cultured under hypoxia and normoxia for 8 h in the presence or absence of 1 mM α-ketobutyrate. h Mass isotopomer analysis of acetyl-CoA in HeLa cells cultured with the medium containing 1 mM of 13C5-glutamine under hypoxia and normoxia for 8 h in the presence or absence of 1 mM α-ketobutyrate. i The relative abundance of cellular dihydroorotate in HeLa cells cultured under hypoxia and normoxia for 8 h in the presence or absence of 1 mM α-ketobutyrate. j Relative ammonia excretion from HeLa cells cultured under hypoxia and normoxia for 8 h in the presence or absence of 1 mM α-ketobutyrate. Values are the means ± SEM of triplicate experiments. k, l The relative abundance of cellular PRPP and UMP in HeLa cells cultured under hypoxia and normoxia for 8 h in the presence or absence of 1 mM α-ketobutyrate. All cultures were supplied with 10% dialyzed serum. Values are the means ± SEM of three independent experiments, if not specified. *p < 0.05; **p < 0.01 (Student’s t-test)
Fig. 7
Fig. 7
Glutamine-derived dihydroorotate is required for tumor growth. a, b Serum dihydroorotate and orotate in healthy controls and cancer patients. c, d Serum dihydroorotate and orotate in healthy and HeLa-derived tumor-bearing nude mice. e, f The 15N-labeled fraction of blood dihydroorotate and orotate in healthy and HeLa-derived tumor-bearing nude mice intraperitoneally injected with 5 mmol kg−1 of amide-15N-glutamine for 1 or 2 h. Values are the means ± SEM of data from three mice. g Tumors directly excreted dihydroorotate that was oxidized to orotate in blood. h The in vivo tumor growth of HeLa/shScramble, HeLa/shDHODH, HeLa/shCAD, and HeLa/shGOT1 cells. *p < 0.05; **p < 0.01 (Student’s t-test)

References

    1. Nakazawa MS, Keith B, Simon MC. Oxygen availability and metabolic adaptations. Nat. Rev. Cancer. 2016;16:663–673. doi: 10.1038/nrc.2016.84. - DOI - PMC - PubMed
    1. Vander Heiden MG, Cantley LC, Thompson CB. Understanding the Warburg effect: the metabolic requirements of cell proliferation. Science. 2009;324:1029–1033. doi: 10.1126/science.1160809. - DOI - PMC - PubMed
    1. Mayers JR, Vander Heiden MG. Famine versus feast: understanding the metabolism of tumors in vivo. Trends Biochem. Sci. 2015;40:130–140. doi: 10.1016/j.tibs.2015.01.004. - DOI - PMC - PubMed
    1. Altman BJ, Stine ZE, Dang CV. From Krebs to clinic: glutamine metabolism to cancer therapy. Nat. Rev. Cancer. 2016;16:619–634. doi: 10.1038/nrc.2016.71. - DOI - PMC - PubMed
    1. Coloff JL, et al. Differential glutamate metabolism in proliferating and quiescent mammary epithelial cells. Cell Metab. 2016;23:867–880. doi: 10.1016/j.cmet.2016.03.016. - DOI - PubMed

Publication types

MeSH terms